


Abstract
Measurements of tumor glucose use by 18F-FDG PET need to be standardized within and across institutions. Various parameters are used for measuring changes in tumor glucose metabolic activity with 18F-FDG PET in response to cancer treatments. However, it is unknown which of these provide the lowest variability between observers. Knowledge of the interobserver variability of quantitative parameters is important in sarcomas as these tumors are frequently large and demonstrate heterogeneous 18F-FDG uptake. Methods: A total of 33 patients (16 men, 17 women; mean age, 47 ± 18 y) with high-grade sarcomas underwent 18F-FDG PET/CT scans before and after neoadjuvant chemotherapy. Two independent investigators measured the following parameters on the pretreatment and posttreatment scans: maximum standardized uptake value (SUVmax), peak SUV (SUVpeak), mean SUV (SUVmean), SUVmean in an automatically defined volume (SUVauto), and tumor-to-background ratio (TBR). The variability of the different parameters was compared by concordance correlation coefficient (CCC), variability effect coefficient, and Bland–Altman plots. Results: Baseline SUVmax, SUVpeak, SUVmean, SUVauto, and TBR averaged 10.36, 7.78, 4.13, and 6.22 g/mL and 14.67, respectively. They decreased to 5.36, 3.80, 1.79, and 3.25 g/mL and 6.62, respectively, after treatment. SUVmax, SUVpeak, and SUVauto measurements and their changes were reproducible (CCC ≥ 0.98). However, SUVauto poorly differentiated between responding and nonresponding tumors. The high intratumoral heterogeneity of 18F-FDG resulted in frequent failure of the thresholding algorithm, which necessitated manual corrections that in turn resulted in a higher interobserver variability of SUVmean (CCCs for follow-up and change were 0.96 and 0.91, respectively; P < 0.005). TBRs also showed a significantly higher variability than did SUVpeak (CCCs for follow-up and change were 0.94 and 0.86, respectively; P < 0.005). Conclusion: SUVmax and SUVpeak provided the most robust measurements of tumor glucose metabolism in sarcomas. Delineation of the whole-tumor volume by semiautomatic thresholding did not decrease the variability of SUV measurements. TBRs were significantly more observer-dependent than were absolute SUVs. These findings should be considered for standardization of clinical 18F-FDG PET/CT trials.
PET/CT with the glucose analog 18F-FDG is increasingly used for monitoring the effectiveness of therapy in patients with malignant diseases (1,2). Use of quantitative measurements of tracer uptake is preferable to use of visual assessment in determining accurately and objectively the degree of tumor response (3,4). Quantitative analysis of tumor 18F-FDG PET uptake requires delineation of the tumor tissue by regions of interest (ROIs). Various approaches are being used for defining ROIs on 18F-FDG PET scans including measuring the single maximum pixel value within the slice with the highest radioactivity concentration (maximum standardized uptake value [SUVmax]) (5–7) or placing a fixed ROI in the area of the tumor with the highest level of 18F-FDG uptake (peak SUV [SUVpeak]) (8–10). Alternatively, volumes of interest (VOIs) can be defined using semiautomated (11–13) or automated (14–16) thresholding algorithms for calculating the mean SUV within this glucose metabolic tumor volume (GMTV) (mean SUV [SUVmean]/mean SUV in an automatically defined volume [SUVauto]). Finally, tumor-to-background ratios (TBRs) have been used frequently for deriving a semiquantitative index of tumor glucose use (3,17).
Most of these different approaches used to define ROIs are not fully automated. Therefore, the interobserver variability of quantitative measurements based on these ROIs must be evaluated. Thus far, however, only limited data on the interobserver variability of ROI definitions are available. Marom et al. (18) used 5 independent readers to determine the SUVmax in 20 patients with non–small-cell lung cancer. SUVmax was determined using 2 different methods: by manually shifting a fixed-size (1-cm) circular ROI around the primary tumor until SUVmax was detected and by creating a freehand drawing around the primary tumor in the slice that visually appeared to exhibit the highest tumor 18F-FDG uptake. This permitted a comparison between a semiautomated and a manual ROI approach. The SUVmax measurements determined by Marom et al. (18) demonstrated a low variability with Pearson correlation coefficients of more than 0.95 and low variability with several other statistical methods (regression analysis, Bland–Altman analysis, and ANOVA).
Stahl et al. (19) tested the agreement between 2 observers in 40 patients with locally advanced gastric carcinomas and in 10 control subjects; agreement by linear regression analysis was excellent (R2 = 0.97). SUVpeak and SUVmax were derived from manually placed ROIs (diameter, 1.5 cm). Using a similar approach, Avril et al. (20) reported an excellent interobserver variability of SUVpeak between 2 observers in 20 patients with breast cancer.
Knowledge of the interobserver variability of quantitative measurements is becoming increasingly important for the planning of multicenter studies evaluating the usefulness of 18F-FDG PET for treatment monitoring in larger patient populations. Therefore, we investigated the interobserver variability of commonly used parameters for measuring glucose metabolic activity in patients with sarcomas undergoing 18F-FDG PET/CT studies before and after neoadjuvant chemotherapy. These parameters included the SUVmax, SUVpeak, SUVmean, SUVauto, and TBRs.
Subsequently, we also determined which parameter of glucose metabolic activity provided the most robust predictions of histopathologic treatment responses. We used sarcomas as the “worst-case scenario” to address the interobserver variability of SUV measurements because of their considerable heterogeneity in 18F-FDG uptake due to frequently large necrotic areas.
MATERIALS AND METHODS
Patients
A total of 33 consecutive patients with biopsy-proven osteosarcoma (n = 8) or soft-tissue sarcoma (STS) (n = 25) who were considered surgical candidates and were scheduled to undergo preoperative chemotherapy or chemoradiotherapy were enrolled prospectively. There were 16 male and 17 female patients (mean age, 47.1 ± 17.7 y; range, 19–86 y).
The most common site of disease was the extremity (n = 27; 82%), followed by retroperitoneal or abdominal (n = 5; 15%) and chest or trunk (n = 1; 3%). Twenty-eight (85%) patients presented with primary disease, 3 (9%) with locally recurrent disease, and 2 (6%) with metastatic disease. Tumors ranged in size from 3.4 to 20.3 cm before treatment and from 2.3 to 25.8 cm after treatment.
All patients underwent a whole-body PET/CT scan before the initiation of neoadjuvant therapy (baseline scan). The baseline PET/CT scan was performed 8 ± 6.8 d before the start of therapy (range, 2–28 d). After the completion of chemotherapy (n = 13) or chemoradiotherapy (n = 20) and before surgery, patients underwent a second whole-body PET/CT study (follow-up scan).
Tumor resection was performed in all patients after they completed neoadjuvant therapy. Excised tumors were examined for extent of necrosis, and the percentage necrosis was used as the reference standard to assess treatment response. In this study, patients with 10% or fewer viable tumor cells were classified as histopathologic responders as previously described (7).
The study was approved by the UCLA Institutional Review Board for Human Subjects, and written informed consent was obtained from all participants at enrollment.
PET/CT Image Acquisition and Analysis
Patients were instructed to fast for at least 6 h before 18F-FDG PET, and blood glucose levels were measured before injection of 18F-FDG. Patients were excluded if their blood glucose levels at the time of any of the scans exceeded 150 mg/dL (21).
Sixty minutes before the start of imaging, 7.5 MBq of 18F-FDG per kilogram (0.21 mCi/kg) were injected intravenously.
All patients received 700–900 mL of the oral contrast barium sulfate (Readi-cat 2; EZEM) 1 h before the study. The intravenous contrast iohexol (Omnipaque; Novaplus) was administered in all patients at a rate of 2 mL/s 30–40 s before imaging commenced.
Image Acquisition
Patients were imaged using a PET/CT system (Biograph Duo; Siemens) consisting of a whole-body PET scanner (ECAT ACCEL; Siemens) and dual-detector helical CT scanner (22). The following parameters were used for CT image acquisition: 130 kVp, 120 mAs, 1-s rotation, 4-mm slice collimation, and 8-mm/s bed speed.
The length of the PET emission scan varied with patient weight as described previously (23). Patients were instructed to use shallow breathing to minimize misregistration and attenuation artifacts between PET and CT images (24).
PET/CT Image Reconstruction
CT images were reconstructed using conventional filtered backprojection, at 3.4-mm axial intervals to match the slice separation of the PET data. PET images were reconstructed using iterative algorithms (ordered-subset expectation maximization [OSEM], 2 iterations, 8 subsets). To correct for photon attenuation, the previously validated CT-based algorithm was applied (25).
CT Image Interpretation
A soft-tissue CT window was used to display tumor images on the CT scan. A single observer measured tumor size on the axial slice, with the largest tumor diameter detected on the baseline and the follow-up scans.
PET Image Interpretation
All PET/CT scans were analyzed quantitatively by 2 independent observers unaware of the clinical data and histopathologic response. Both observers used the same workstation (REVEAL-MVS; CTI Mirada Solutions) to view PET and CT images to define ROIs and VOIs and to coregister baseline and follow-up PET/CT studies. Observers were instructed to use the approaches described in the next sections to place ROIs and VOIs.
SUVmax
Loosely fitting ROIs covering the whole tumor were placed manually over every axial image plane in which tumor tissue was visualized by abnormal 18F-FDG accumulation. Then the software determined the SUVmax in this set of ROIs (Fig. 1).
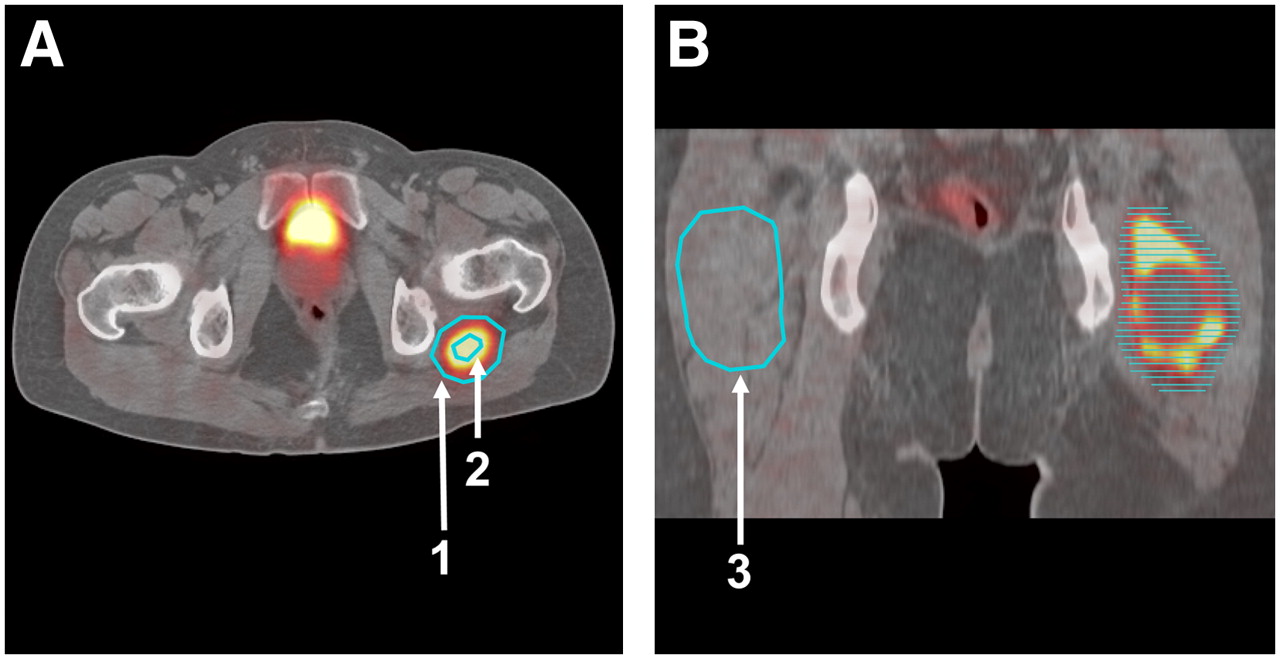
ROI approach used for detecting SUVmax and SUVpeak within tumor (left thigh) and mean activity concentration in contralateral background region (right thigh). (A) Loosely fitting ROIs were placed manually around entire tumor on every axial image plane in which tumor tissue was visualized by abnormal 18F-FDG accumulation (arrow 1). (B) All ROIs were placed on multiple axial slices. Each ROI placed on axial images is represented by horizontal line. Within this set of ROIs, computer automatically identified SUVmax. To obtain SUVpeak, 15-mm ROI was manually placed around SUVmax (arrow 2). Then circular ROI was drawn in contralateral normal soft tissue on coronal PET/CT images to determine SUV of background region (arrow 3).
SUVpeak
The single maximum pixel value within the slice with the highest radioactivity concentration was detected by creating a second circular ROI with a diameter of 15 mm and by moving this ROI over the tumor volume until the single maximum pixel value was detected. Investigators were instructed to place the pixel with the SUVmax at the center of the circular ROI. SUVpeak was defined by the average pixel value within this 15-mm ROI (Fig. 1A). This approach was used for both baseline and follow-up scans.
SUVauto
SUVauto is the SUVmean of an automatically defined VOI. This VOI includes pixels containing more than 50% of the maximum 18F-FDG concentration (SUVmax). SUVauto was defined in the baseline and the follow-up scans using the region-growing algorithm implemented in the Mirada software.
SUVmean
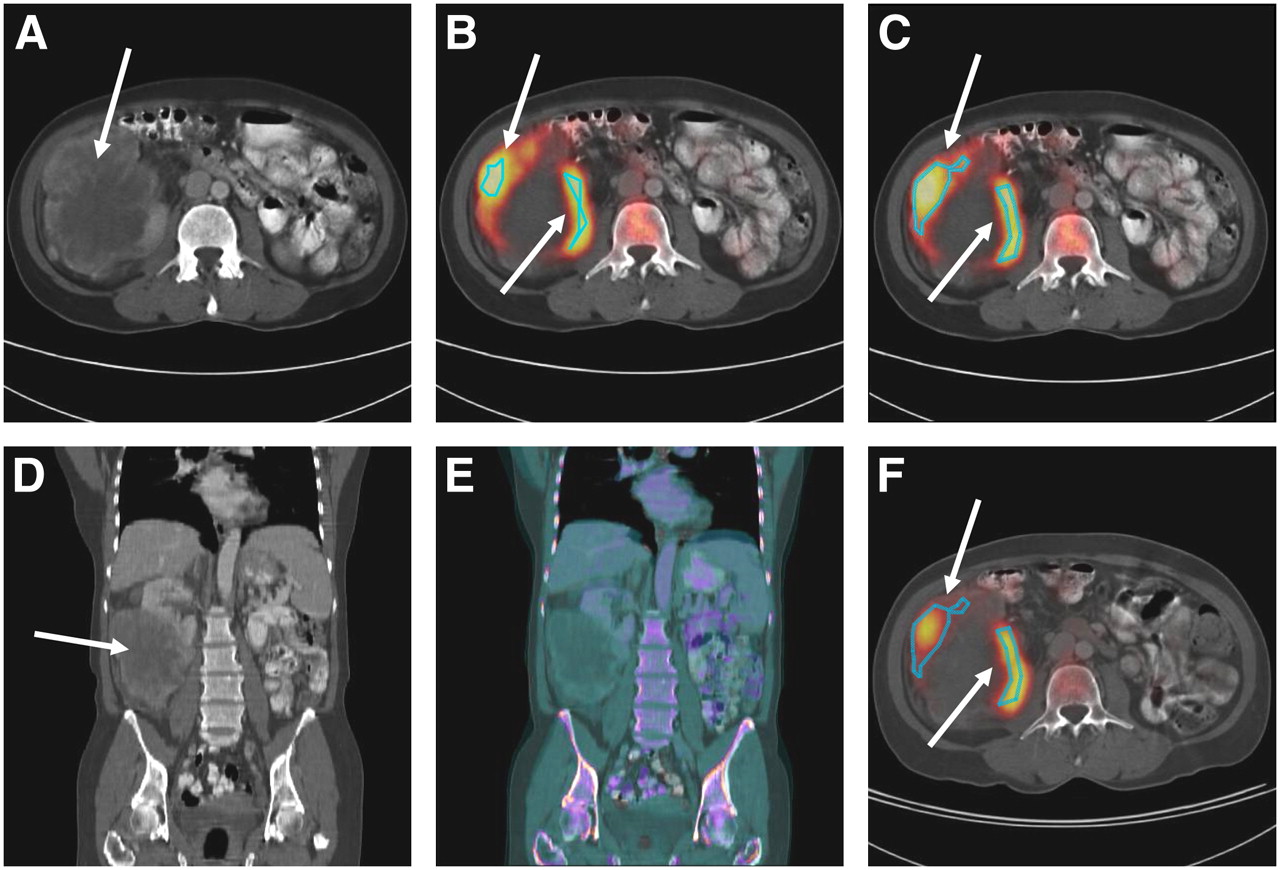
The SUVmean was then determined on baseline and follow-up scans within the tumor borders derived from the baseline PET (Fig. 2). First the baseline GMTV was determined by applying thresholding at 50% of maximum pixel activity as described above.

(A) Dedifferentiated liposarcoma located in right lower abdomen (arrows). (B) For placement of ROI, 50% isocontour thresholding approach was used. (C) ROI from B was manually adjusted to better fit hypermetabolic region. (D) Tumor in coronal views. To ascertain identical ROI placement in baseline and follow-up studies, 2 CT images were fused (E). Baseline images in D are displayed in gray scale, whereas follow-up images are color-scaled. (F) ROI placement used in follow-up was identical to that used in baseline scan in C.
In some cases normal tissues with relatively high 18F-FDG uptake were included in the VOIs or the VOIs excluded obvious tumor tissue. In these cases, manual corrections of ROI placement were applied (Fig. 2C).
The GMTV derived from the baseline scan was then copied to the coregistered follow-up study to determine the posttreatment SUVmean. Thus, baseline and follow-up SUVmeans were determined within the same volume.
For coregistration of the baseline and follow-up PET/CT studies, image fusion was performed using the Mirada software. This software is based on a mutual information algorithm as reported previously (26). In this approach, the parameters of transformation are estimated through multidimensional optimization (27). This rigid fusion approach does not use geometric landmarks but searches for feature similarities across voxels instead. The mutual information algorithm was applied to the CT data from the baseline and follow-up scans (Figs. 2D and 2E). This translation information was then used to coregister the baseline and follow-up PET images.
TBR
Circular ROIs approximately matching the diameter of the tumor were placed in the contralateral normal soft tissue on coronal PET/CT images. The TBR was calculated by dividing the tumor SUVpeak by the mean activity concentration in the contralateral ROI (i.e., the background region) (Fig. 1B).
Statistical Analysis
Statistical analysis was performed using commercially available software. Values of P less than 0.05 were considered statistically significant. The absolute values of the measured parameters are expressed as mean ± 1 SD.
Intra- and interindividual comparisons of absolute values and changes in tumor 18F-FDG uptake were performed with the Wilcoxon signed rank test and the Mann–Whitney test, respectively. Interobserver variability was assessed by using Lin's concordance correlation coefficient (CCC) (28) and Bland–Altman analysis (29). To determine whether CCCs differed significantly between the various parameters of tumor glucose use, CCCs were compared as reported elsewhere (30). Parameters for assessing the effectiveness of therapy should feature 2 main qualities: low interobserver variability and the ability to differentiate between treatment responders (R) and nonresponders (NR). To combine both qualities in 1 parameter, we defined a variability effect coefficient (VEC) as follows: where average(R) and average(NR) denote the mean value of a parameter for the group of histopathologic responders and nonresponders, respectively, and SD(R) and SD(NR) represent the SD of a parameter in the responders and nonresponders, respectively. For calculation of average(R), average(NR), SD(R), and SD(NR), the measurements of observer 1 and observer 2 were averaged for each tumor. For calculation of SD(OB), the SDs of the measurements of the 2 observers were determined for each tumor and the resulting 33 SDs were averaged.
Thus, the enumerator of the VEC describes how well a parameter separates the histopathologic responders from the nonresponders, that is, by how many SDs the parameter differs in responders and nonresponders. The denominator of the VEC describes the interobserver variability of the measurements. When no interobserver variability exists, the denominator becomes 1. A high VEC therefore indicates that a parameter shows a low interobserver variability and separates well the histopathologic responders from the nonresponders.
RESULTS
Histopathology
On the basis of excised tumor tissue, 10 patients were classified as histopathologic responders (≥90% necrosis) and 23 as nonresponders (30.3% response rate). The average percentage of tumor necrosis was 65%, ranging from 9% to 99.9%. Thus, tumors exhibited high inter- and intratumoral heterogeneity in 18F-FDG-uptake at baseline and at follow-up (Table 1).
SUV Parameters and Their Changes as Assessed by 2 Observers
SUV and TBR Measurements
Baseline and follow-up 18F-FDG uptake parameters as determined by the 2 observers are listed in Table 1. SUVmax, SUVpeak, SUVmean, SUVauto, and TBR averaged 10.36, 7.78, 4.13, and 6.22 g/mL and 14.67, respectively, at baseline. They decreased to 5.36, 3.80, 1.79, and 3.25 g/mL and 6.62, respectively, after treatment (all P < 0.005).
The data were further stratified by histopathologic response (Fig. 3). Changes in SUVmax, SUVpeak, and SUVmean were significantly more pronounced in responders than in nonresponders (P < 0.005).
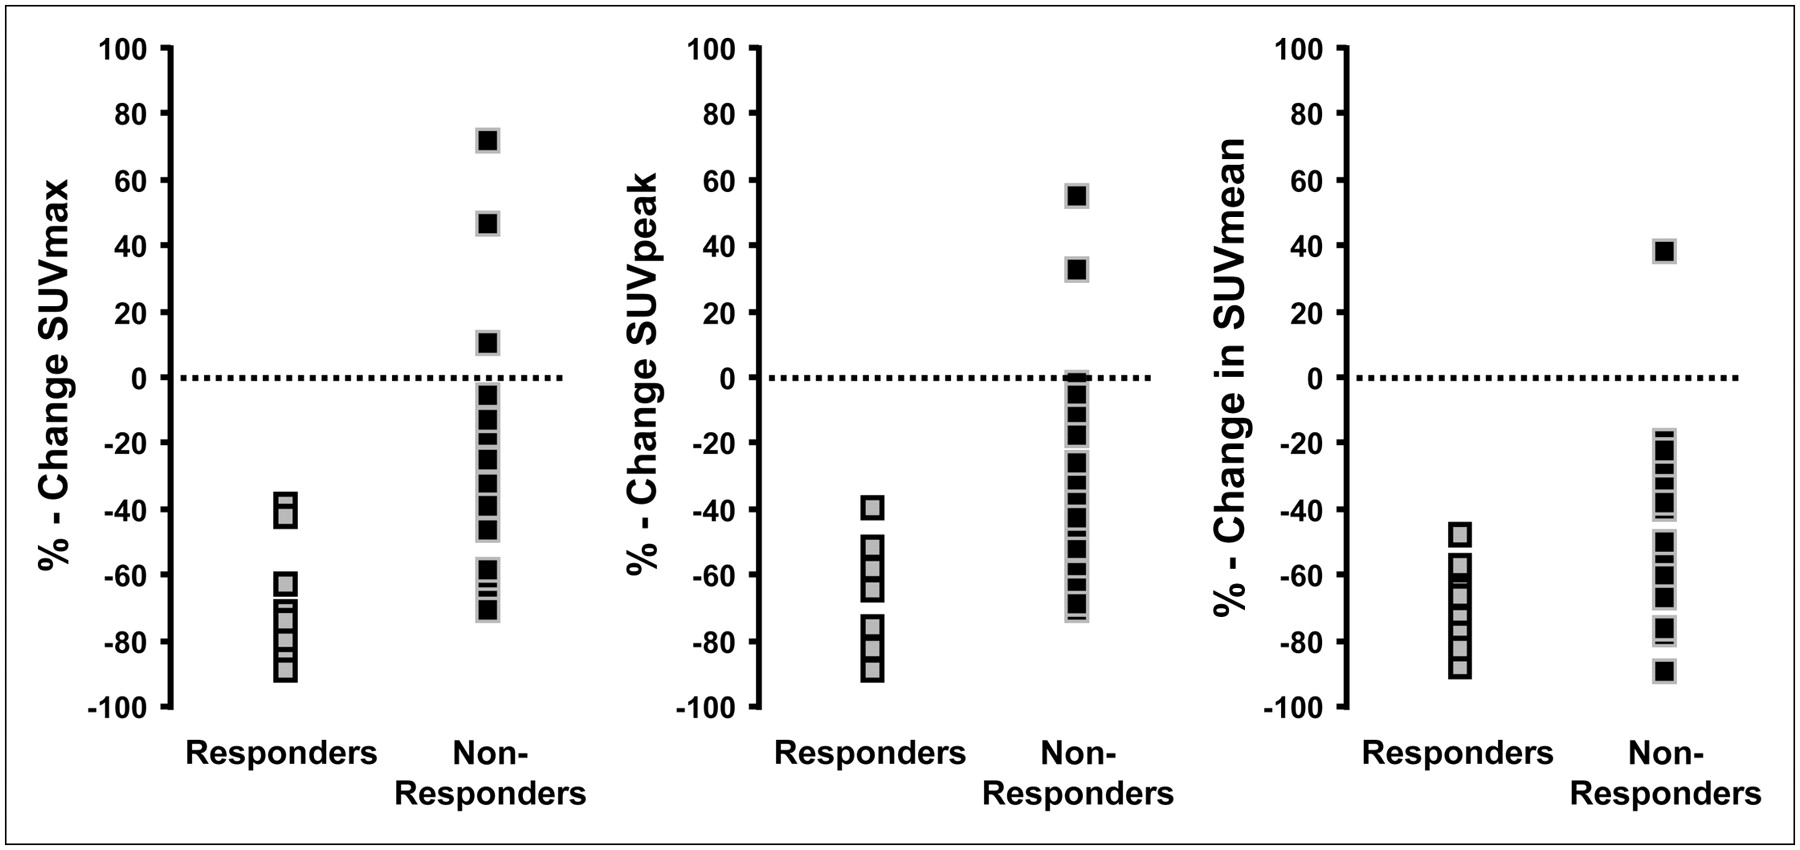
Changes in tumor SUVmax, SUVpeak, and SUVmean are stratified for responders and nonresponders as defined by histopathology. Each data point represents mean of measurements of 2 observers.
In the baseline scans, SUVmax and SUVauto measurements of the 2 readers were identical in all studies (100% concordance, CCC = 1), indicating that the procedure for observer-independent identification of maximum tumor 18F-FDG uptake was successful in all cases. SUVpeak also demonstrated a low interobserver variability (CCC = 0.99), and interobserver variability was significantly higher for SUVmean and TBR (CCC = 0.84 and CCC = 0.92, respectively; P < 0.005).
An identical ranking of the CCC was found for the follow-up study and for changes from the baseline to the follow-up study. (SUVmax = SUVauto > SUVpeak > SUVmean > TBR). Again, SUVmean and TBR demonstrated a higher interobserver variability than did SUVmax, SUVpeak, and SUVauto (Table 2).
CCC, SD of Differences, and Comparison Between CCCs
SUVpeak, SUVmean, and TBR changes from the baseline to follow-up scan tended to show a higher interobserver variability than did the pretherapeutic or posttherapeutic SUVpeak, SUVmean, or TBR measurements (Table 2).
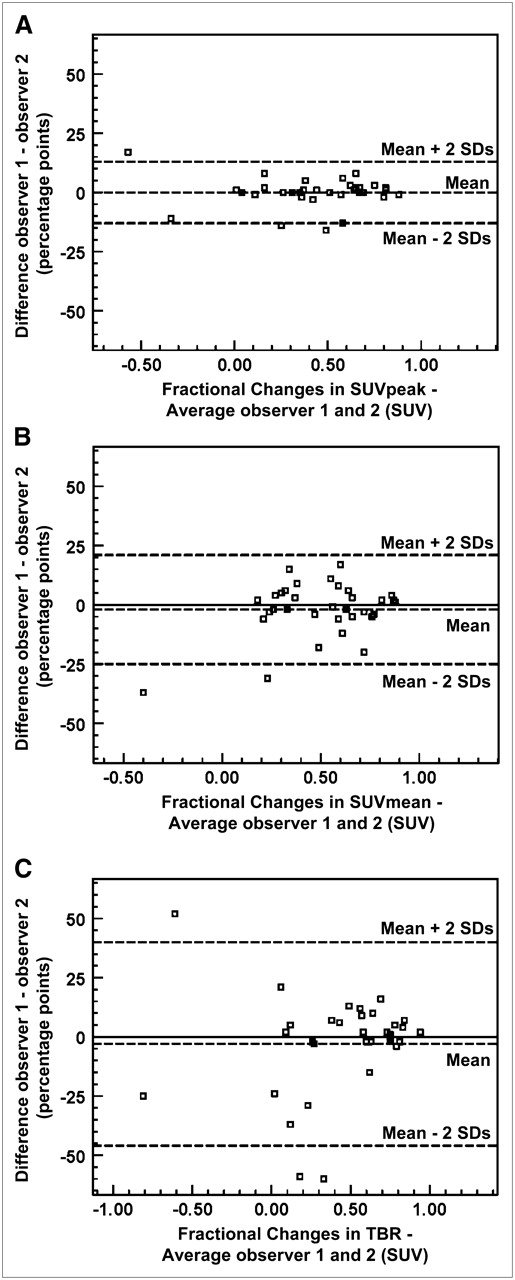
The Bland–Altman plots in Figure 4 illustrate the higher interobserver variability of SUVmean and TBR than of SUVpeak for SUV and TBR changes. Bland–Altman plots for baseline and posttherapeutic SUV also indicated a lower interobserver variability of SUVpeak than of SUVmean and TBR (data not shown). The SD of differences of measurements by observer 1 and observer 2 is shown in Table 2. This type of analysis also ranked the interobserver variability of SUVpeak lower than that of SUVmean and TBR (Table 2).

Bland–Altman plots exemplifying that differences between observers 1 and 2 were smaller for changes in SUVpeak (A) than for changes in SUVmean (B) and in TBR (C).
The VEC that combines interobserver variability and the ability to differentiate between treatment responders and nonresponders was higher for changes in SUV than for absolute SUVs or TBRs. Among the changes in parameters, the VEC ranking was as follows: SUVmax > SUVpeak > SUVmean > TBR > SUVauto (Fig. 5). Thus, SUVauto was a relatively poor parameter to differentiate histopathologic responders and nonresponders, despite its excellent interobserver variability.

VEC combining interobserver variability and ability to differentiate between treatment responders and nonresponders. High coefficient signifies robust and valid data. VEC was higher for changes in SUV than for absolute SUVs or TBR. Changes in parameters rather than their absolute values are preferable for assessing effectiveness of therapy.
DISCUSSION
The present study indicates that different approaches to define ROIs result in considerably different interobserver variability. Specifically, SUVmean and TBR demonstrated a significantly higher interobserver variability than did SUVmax, SUVpeak, and SUVauto. Although this seems to suggest that the latter parameters are preferable to SUVmean and TBR for treatment monitoring, our study also indicates that focusing on the interobserver variability alone can be misleading. An automated thresholding approach for delineation of tumor contours (SUVauto) provided observer-independent results but was a poor discriminator between histopathologically responding and nonresponding tumors.
We therefore propose that the interobserver variability of parameters for monitoring the effects of cancer therapy should be measured on the basis of their ability to differentiate responding and nonresponding tumors. When applying such a metric, the most suitable parameters for monitoring tumor response in patients with STSs were SUVmax and SUVpeak. Our findings confirm that in patients with sarcoma, SUVmax and SUVpeak provide reproducible parameters of tumor glucose use (19,20). However, the excellent interobserver variability of SUVmax can be achieved only when observers are provided with an accurate guideline for detecting SUVmax. Furthermore, the use of combined PET/CT facilitated ROI placement in the appropriate anatomic location (31).
In contrast, mean SUV and TBR measurements were associated with considerable variability. This observation is consistent with results from a previous study by Hashimoto et al. (32). In that study, 43 patients with benign and malignant solid pulmonary lesions with 18F-FDG SUVs less than 2.5 were semiquantitatively analyzed by 2 independent raters. The interobserver concordance of SUVmax and SUVmax-to-background ratios was tested using the coefficient of variation. TBRs were determined by measuring the highest activity in the tumor ROI (SUVmax) and in the contralateral normal lung ROI (background). The introduction of a background ROI resulted in a high variability of quantitative measurements (coefficient of variation, 142%), which agreed with our results. The relatively high interobserver variability of TBR relates to the calculation of a TBR requiring the definition of a second ROI, which introduces another observer-dependent factor. Furthermore, counting rates in normal lung tissue are low. This makes a TBR in the lung very sensitive to image noise.
To minimize interobserver variability and the effect of image noise, we instructed observers to draw large background lesions for assessing TBRs. Nevertheless, they showed low concordance, which was primarily because of a high interobserver variability in SUVs from background regions.
The high interobserver variability of SUVmean may appear surprising, because SUVmax measurements were 100% concordant between the 2 investigators, and the ROI for calculation of SUVmean was defined to include all adjacent pixels with 18F-FDG-uptake of at least 50% of the maximum. However, in all 33 cases manual corrections were performed eventually, because the tumor contours based on a single threshold value excluded obvious tumor tissue or included adjacent normal tissue (Fig. 2). We tried to minimize the effect of interobserver variability by defining the tumor contours only in the baseline study and then reorienting the follow-up scan to the baseline study by a mutual information algorithm. Nevertheless, the manual adjustments of the ROIs introduced a relatively high degree of interobserver variability.
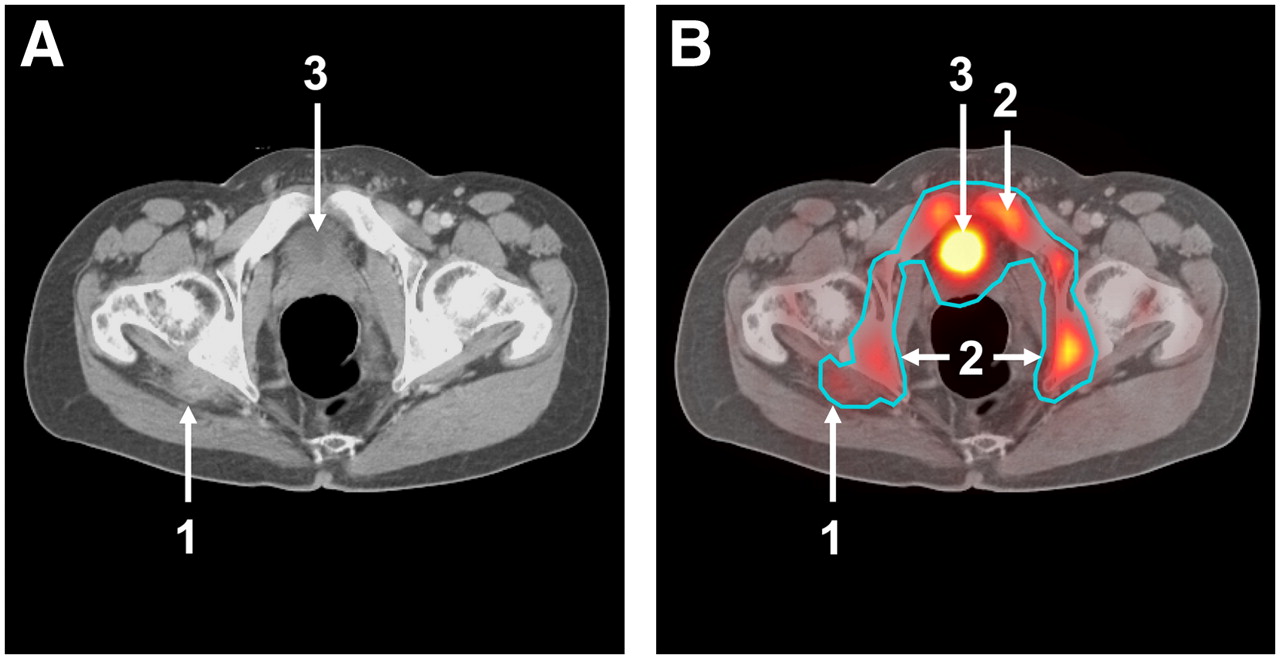
When no manual adjustments were performed, interobserver variability was eliminated, but the resulting parameter, SUVauto, poorly differentiated between responding and nonresponding tumors. The poor performance of SUVauto was because inhomogeneous 18F-FDG uptake frequently caused the automatically defined tumor contours to include large areas of normal tissues (Fig. 6) or excluded large parts of the tumor mass (Fig. 2). However, STSs demonstrate a particularly high inter- and intratumoral heterogeneity of 18F-FDG uptake. In tumors with more homogeneous 18F-FDG uptake, a thresholding approach may be more appropriate.

Images depicting treated, histopathologically responding malignant peripheral nerve sheath tumor located in right gluteal area. (A) Tumor on axial CT soft-tissue window (arrow 1). (B) ROI placement using 50% isocontour thresholding approach. This automatically defined contour includes tumor (arrow 1) and large area of normal tissues (bone marrow, arrow 2; bladder, arrow 3).
In this study, we used several commonly applied approaches (CCC, Bland–Altman plots) to assess the interobserver variability of different approaches for ROI definition. All these established approaches ranked the interobserver variability of the tested parameters in the same order (SUVmax = SUVauto < SUVpeak < SUVmean < TBR). However, a low interobserver variability is only 1 parameter for reliably assessing tumor responses to therapy; it is also important that the differences between responding and nonresponding tumors are compared with the interobserver variability. Therefore, we introduced the VEC and determined the ability of all tested parameters to differentiate between histopathologic responders and nonresponders (Fig. 5).
In this approach, low variability between observers (denominator) and large differences in parameters between histopathologic responders and nonresponders (enumerator) resulted in a high coefficient signifying robust and valid data. Changes in SUV parameters tend to show higher interobserver variability (as indicated by lower CCCs). Nevertheless, the introduction of the VEC supports the notion that changes in these parameters rather than their absolute values are preferable for assessing the effectiveness of therapy (Fig. 5).
SUVmax showed the highest VEC, indicating low interobserver variability and good separation between responding and nonresponding tumors. However, SUVmax and to a lesser extent also SUVpeak are more prone to variations due to statistical noise as well as image reconstruction and parameters after processing (33). Therefore, the use of SUVmax might be limited when studies are performed on different PET scanners as can be the case in multicenter clinical trials.
The following proved to be limitations of this study. First, we analyzed the interobserver variability of 5 commonly used approaches to quantify tumor 18F-FDG uptake. However, several other and more sophisticated techniques have been described that may provide a better segmentation of the tumor tissue. These include, among others, the use of higher threshold values (e.g., 70%) for tumor segmentation (34–36), correction of background activity before segmentation (11,12), and isocontour methods that take into account local contrast (37,38). An analysis of the interobserver variability of all these approaches for tumor segmentation is beyond the scope of this investigation and warrants future studies. Second, images were reconstructed with 1 set of parameters routinely used for clinical PET/CT scans. However, other reconstruction parameters may facilitate tumor delineation by thresholding techniques. For example, less smoothing during reconstruction may facilitate delineation of tumors with a 50% isocontour, because image contrast is increased. Future studies are needed to systematically evaluate the impact of image reconstruction and postprocessing on interobserver variability and on the ability of quantitative parameters to separate histopathologically responding from nonresponding tumors.
CONCLUSION
We have expanded on previous studies by systematically testing several frequently used parameters for estimating tumor glucose use. SUVmax and SUVpeak showed low variability and effectively separated histopathologically responding and nonresponding tumors. TBRs and SUVmean were significantly more observer-dependent than were SUVpeak and SUVmax. An automated delineation of tumor borders by a thresholding algorithm provided reproducible results but failed to correctly delineate tumor borders. As a consequence, this approach was not useful for differentiating histopathologically responding and nonresponding tumors. Further studies will have to elucidate whether these findings obtained in glucose metabolically heterogeneous sarcomas can be reproduced in smaller lesions and tumor types with less heterogeneous 18F-FDG uptake.
Footnotes
-
Guest Editor: Barry A. Siegel, Mallinckrodt Institute of Radiology
-
COPYRIGHT © 2008 by the Society of Nuclear Medicine, Inc.
References
- Received for publication December 21, 2007.
- Accepted for publication March 4, 2008.


Jump to section
Related Articles
Cited By...
- Evaluation of 18F-FDG PET and DWI Datasets for Predicting Therapy Response of Soft-Tissue Sarcomas Under Neoadjuvant Isolated Limb Perfusion
- Identification of Biomarkers Including 18FDG-PET/CT for Early Prediction of Response to Neoadjuvant Chemotherapy in Triple-Negative Breast Cancer
- Noise Considerations for PET Quantification Using Maximum and Peak Standardized Uptake Value
- 18F-FDG-PET/CT Imaging as an Early Survival Predictor in Patients with Primary High-Grade Soft Tissue Sarcomas Undergoing Neoadjuvant Therapy
- 18F-FDG PET/CT for Monitoring Treatment Responses to the Epidermal Growth Factor Receptor Inhibitor Erlotinib
- Correlation Between Glycolytic Phenotype and Tumor Grade in Soft-Tissue Sarcomas by 18F-FDG PET
- Assessment of Interobserver Reproducibility in Quantitative 18F-FDG PET and CT Measurements of Tumor Response to Therapy
- Prediction Model of Chemotherapy Response in Osteosarcoma by 18F-FDG PET and MRI
- FDG-PET/CT Imaging Predicts Histopathologic Treatment Responses after the Initial Cycle of Neoadjuvant Chemotherapy in High-Grade Soft-Tissue Sarcomas
- 18F-FDG PET and PET/CT in the Evaluation of Cancer Treatment Response