


Abstract
Response to neoadjuvant chemotherapy is a significant prognostic factor for osteosarcoma; however, this information can be determined only after surgical resection. If we could predict histologic response before surgery, it might be helpful for the planning of surgeries and tailoring of treatment. We evaluated the usefulness of 18F-FDG PET for this purpose. Methods: A total of 70 consecutive patients with a high-grade osteosarcoma treated at our institute were prospectively enrolled. All patients underwent 18F-FDG PET and MRI before and after neoadjuvant chemotherapy. We analyzed the predictive values of 5 parameters, namely, maximum standardized uptake values (SUVs), before and after (SUV2) chemotherapy, SUV change ratio, tumor volume change ratio, and metabolic volume change ratio (MVCR) in terms of their abilities to discriminate responders from nonresponders. Results: Patients with an SUV2 of less than or equal to 2 showed a good histologic response, and patients with an SUV2 of greater than 5 showed a poor histologic response. The histologic response of a patient with an intermediate SUV2 (2 < SUV2 ≤ 5) was found to be predictable using MVCR. A patient with an MVCR of less than 0.65 is likely to be a good responder, whereas a patient with an MVCR of greater than or equal to 0.65 is likely to be a poor responder. According to our model, the predictive values for good responders and poor responders were 97% (31/32) and 95% (36/38), respectively. Conclusion: We found that combined information on 18F-FDG PET and MRI scans, acquired before and after chemotherapy, could be used to predict histologic response to neoadjuvant chemotherapy in osteosarcoma.
Tumor necrosis induced by neoadjuvant chemotherapy has been reported to be the most powerful prognostic indicator of survival in osteosarcoma patients (1). Moreover, although histology is the accepted gold standard for response evaluations, it is time- and labor-consuming and is prone to inter- and intraobserver variabilities. Above all, tumor necrosis rate can be determined only in resected specimens, and thus, response monitoring during the course of chemotherapy is not possible. To overcome these limitations, other diverse imaging modalities have been investigated (2,3). In particular, in osteosarcoma, these modalities include bone scintigraphy (4), CT (5), MRI (6), and 18F-FDG PET (7).
Recently, PET using 18F-FDG has been examined in the context of determining prognosis (8), grading (9), staging and restaging (10,11), guiding biopsy, and monitoring response in many types of malignancies (12). 18F-FDG PET is a functional imaging modality and can detect changes in tissue metabolism that usually precede structural changes. Furthermore, in terms of response evaluations, several reports have commented on the potential versatility of 18F-FDG PET (7,13–16).
In this prospective study, we evaluated the usefulness of metabolic and volumetric information obtained by 18F-FDG PET and MRI before and after the completion of chemotherapy with the aim of predicting histologic response to neoadjuvant chemotherapy in patients with osteosarcoma.
MATERIALS AND METHODS
Patients
A total of 70 consecutive patients with osteosarcoma treated at our institute were prospectively enrolled. Eligibility requirements included primary high-grade osteosarcoma, the completion of neoadjuvant chemotherapy and surgical resection, MRI and 18F-FDG PET scans obtained before and after neoadjuvant chemotherapy, a time between the first 18F-FDG PET scan and the initiation of chemotherapy of no more than 2 wk, and a time between the second 18F-FDG PET scan and surgery of no more than 2 wk. Our institutional review board approved this study. All patients provided written informed consent, and this study was performed according to the ethical guidelines of our institutional clinical research committee.
Pretreatment Evaluation
Patients underwent a conventional evaluation (plain radiography and MRI of the primary tumor, a 99mTc-methylene diphosphonate bone scan, and a CT scan of the chest) and 18F-FDG PET before neoadjuvant chemotherapy. Osteosarcoma diagnoses were confirmed on the basis of histologic examinations of tumor tissues obtained by open or needle biopsy, which was performed on average 2.1 d (range, 1–5 d) before the first PET scan.
18F-FDG PET/CT
18F-FDG PET/CT scans were acquired using an integrated PET/CT scanner (Discovery LS; GE Healthcare), which consisted of a PET scanner (Advanced NXi; GE Healthcare) and an 8-slice helical CT scanner (LightSpeed Plus; GE Healthcare). All patients were instructed to fast for at least 6 h before the scans. Blood glucose levels in all 70 patients were less than 6.6 mmol/L. Truncal PET scans were obtained in 2-dimensional mode using 5–7 bed positions to ensure adequate coverage from head to pelvic floor. Additional regional PET scans were also acquired in the same manner as the truncal scans (using 3–5 bed positions) to cover tumor sites located in the lower extremities. Emission scans (5 min/frame; 128 × 128 matrix) were obtained 50 min after an intravenous injection of 18F-FDG (370 MBq). In the case of children (under 15 y), 7.4 MBq of 18F-FDG per kilogram of body weight (mean, 222 MBq; range, 185–333 MBq) were injected intravenously. CT scans were obtained immediately before PET scans, using a multidetector helical CT scanner. The imaging parameters used were as follows: 140 kVp, 80 mA, 0.8 s/CT rotation, pitch of 6, and a 22.5 mm/s table speed. No contrast material was administered. CT images were created using a 512 × 512 matrix but were reduced to a 128 × 128 matrix to correspond to PET emission images. PET/CT images were reconstructed using CT scans for attenuation correction and the ordered-subset expectation maximization algorithm (2 iterations, 16 subsets), as previously described (17). Images were coregistered using dedicated software (eNTEGRA; GE Healthcare).
18F-FDG PET/CT Image Interpretation
Abnormal 18F-FDG uptake was defined as uptake greater than background uptake in surrounding tissues that did not exhibit tracer uptake. Areas of abnormal 18F-FDG uptake were identified, and intensities of 18F-FDG uptake were quantified by calculating standardized uptake values (SUVs) from amounts of 18F-FDG injected, total body weight, and regional uptake in attenuation-corrected regional images. Specifically, SUV was defined as maximum SUV (SUVmax) of the region of interest (ROI) and calculated by the following equation: (activity/unit volume)/(injected dose/total body weight). All PET/CT scans were reviewed and interpreted by an experienced nuclear physician.
MRI
MRI sequences included a standard (spin-echo) T1-weighted sequence (repetition time [ms]/echo time [ms], 400–900/10–20), with or without gadolinium enhancement, and an intermediate-weighted/T2-weighted sequence (1,500–2,500/70–100), without fat suppression. Intramedullary tumor lengths were measured in coronal sections of unenhanced T1-weighted sequences, and tumor widths and depths were measured in axial enhanced T1- and T2-weighted sequences without fat suppression (18). MR images were independently reviewed by 2 of the authors of this article. When the 2 reviewers found a size discrepancy of more than 10%, images were reviewed simultaneously, and decisions were made by consensus.
Neoadjuvant Chemotherapy
All patients underwent 2 cycles of preoperative chemotherapy using the modified T10 protocol (19). Briefly, each cycle of chemotherapy consisted of high-dose methotrexate, adriamycin, and cisplatin. Methotrexate was administered twice at a dose of 8–12 g/m2 on days 1 and 7. Cisplatin was administered at a dose of 100 mg/m2 on day 14 over 2 h. Subsequently, adriamycin was administered at 60 mg/m2 over 18 h. The intervals between the end of the first cycle of chemotherapy and initiation of the second cycle, and between the end of the second cycle of chemotherapy and surgery, were around 3 wk.
Histologic Assessments of Response to Preoperative Chemotherapy
The effects of preoperative chemotherapy were graded histologically as described by Rosen et al.: grades III and IV (>90% necrosis) indicate good response and grades I and II (<90% necrosis) indicate poor response (19).
Definitions and Calculations of Parameters
We defined prechemotherapy SUVmax as SUV1 and preoperative SUVmax as SUV2. Tumor volume (TV) was calculated using the ellipsoid formula, as described previously (18). The following parameters were calculated using these values:

Statistics
We analyzed the predictive values of 5 parameters—SUV1, SUV2, SCR, VCR, and MVCR—in terms of their abilities to discriminate responders from nonresponders. For this purpose, we used receiver-operating-characteristic (ROC) curves and calculated areas under curves (AUCs) for each parameter. We chose parameters that best predicted response and determined cutoffs that showed highest accuracy. Then we grouped the patients using these cutoffs and calculated positive and negative predictive values. Finally, we devised a decision tree for predicting response based on imaging parameters and calculated predictive values using this model. All calculations were performed using SPSS (version 13.0; SPSS Inc.). All P values were derived from the 2-sided test, and values of less than 0.05 were considered significant.
RESULTS
Patients' Characteristics
Patients' characteristics are detailed in Table 1. The median age of patients was 14 y (range, 5–59 y), and 69% of patients were male. The median tumor volume was 149 cm3 (range, 17–2,882 cm3). On the basis of the revised American Joint Committee on Cancer staging system, 24 patients (34.3%) had a stage IIA tumor, 40 (57.1%) had a stage IIB tumor, and 6 (8.6%) had a stage IV tumor. Half of the 70 patients presented with a tumor in the distal femur. The median tumor SUV1 and SUV2 values were 8.0 and 4.5, respectively. Median time between the first PET examination and the initiation of chemotherapy was 6 d. Median time between the end of chemotherapy and the second PET examination was 19 d (range, 16–22 d), and median time between the second PET examination and surgery was 2 d. Thirty-three patients (47.1%) showed good histologic response in resected specimens after neoadjuvant chemotherapy.
Patient Characteristics
ROC Curve Analysis of Response Prediction
Before plotting the ROC curves, we checked the bivariate association between histologic response and clinicopathologic parameters; however, no significant correlation was found. ROC curves of SUV1, SUV2, SCR, VCR, and MVCR were plotted to predict histologic response (Fig. 1). All parameters, except SUV1, predicted histologic response. We calculated the predictive values of SUV2, SCR, VCR, and MVCR at each cutoff value (Table 2). We found that low (≤2) and high (>5) SUV2 values predicted histologic response and, therefore, set 2 cutoff values for SUV2. On the basis of these cutoffs, we divided patients into 3 groups: group I (SUV2 ≤ 2; n = 7), group II (2 < SUV2 ≤ 5; n = 33), and group III (SUV2 > 5; n = 30). All 7 patients in group I were good responders, whereas most of the patients (28/30) in group III were poor responders. Of the 33 patients in group II, 24 (73%) were good responders and 9 (27%) were poor responders.

ROC curve analysis of response prediction. ROC curves of SUV1 (A), SUV2 (B), SCR (C), VCR (D), and MVCR (E) were plotted to predict histologic response. On basis of AUC, all parameters—except SUV1—predicted histologic response.
Predictive Values of SUV2, SCR, VCR, and MVCR in 70 Patients
ROC Curve Analysis for Group II Patients
To predict histologic response for group II patients, we drew ROC curves and calculated the AUCs of SUV1, SCR, VCR, and MVCR. MVCR was found to predict histologic response best among group II patients (AUC, 0.93). All 8 patients with an MVCR of greater than or equal to 0.65 showed a poor response, whereas most patients (24/25) with an MVCR of less than 0.65 showed a good response.
Decision Tree for Response Prediction
A decision tree was devised to predict histologic response based on SUV2 and MVCR values (Fig. 2). According to our model, 32 patients were predicted to be good responders and the remaining 38 to be poor responders. Predictive values for good responders and poor responders were 97% (31/32) and 95% (36/38), respectively. Briefly, patients with an SUV2 of less than or equal to 2 showed a good histologic response (predictive value, 100%; 95% confidence interval [CI], 77%−100%), and patients with an SUV2 of greater than 5 showed a poor histologic response (predictive value, 93%; 95% CI, 87%−93%). The histologic response of a patient with an intermediate SUV2 (2 < SUV2 ≤ 5) was found to be predictable using MVCR; for example, a patient with an MVCR of less than 0.65 is likely to be a good responder (predictive value, 96%; 95% CI, 89%−96%), whereas a patient with an MVCR of greater than or equal to 0.65 is likely to be a poor responder (predictive value, 100%; 95% CI, 77%−100%).
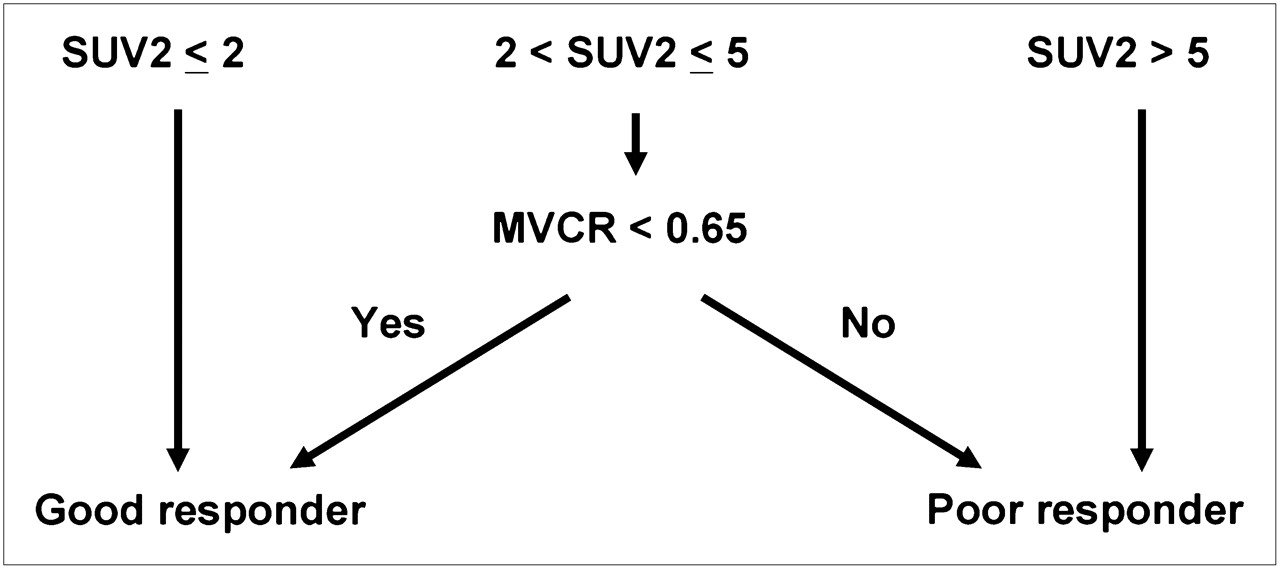
Decision tree for response prediction. Decision tree was devised to predict histologic response based on SUV2 and MVCR values. Predictive values of our model for good responders and poor responders were 97% (31/32) and 95% (36/38), respectively.
DISCUSSION
Unlike morphologic imaging modalities, 18F-FDG PET reflects the metabolic rate of glycolysis in tumors, and thus, 18F-FDG PET should be more accurate for assessing treatment response because it can more correctly identify viable residual tumors. Most studies conducted on this topic have demonstrated a strong correlation between a reduction in tumor glucose metabolism after chemotherapy and tumor necrosis rate. These studies used various types of 18F-FDG uptake indices—such as tumor-to-background ratio (TBR) (9,13,16), SUV2 (14), and SUV2-to-SUV1 ratios (15)—and have suggested various cutoff values for 18F-FDG uptake indices to predict response (Table 3). However, most of these studies lacked statistical power because of low patient numbers.
Summary of Previous Studies
Previous studies have used two 18F-FDG PET scan parameters, namely, TBR and SUVmax. SUVmax represents the highest metabolic activity point in a tumor, whereas the TBR (or mean SUV) represents mean activity in the ROI. In sarcoma patients, TBR values, which are highly dependent on ROIs analyzed, are known to be more prone to interobserver variability than SUVmax (20). In 3 studies that used TBR (7,13,16), TBR was calculated by dividing average tumor uptakes in ROIs by average uptake in contralateral ROIs, and in these studies 3 different cutoffs of TBR-change ratios before and after chemotherapy were used. Although it is difficult to compare TBR directly with SUVmax because of individual differences in background uptake and body weight, changes in their ratios (TBRpost/TBRpre and SUVpost/SUVpre) are likely to be comparable. In the present study, when we applied these 3 cutoffs to our patients (TBRpost/TBRpre, 0.46, 0.6, and 0.7), predictive values for good responders were 85%, 74%, and 64%, respectively, and those for poor responders were 70%, 80%, and 87%, respectively (Table 2). In 2 previous studies, SUVmax was used a parameter for response prediction (14,15). In these studies, it was found that SUV2/SUV1 and SUV2 correlated with histologic response and that an SUV2 of less than 2 and an SUV2/SUV1 of less than 0.4 were good response indicators. These results are partly concordant with ours, but it is difficult to draw a definite conclusion from the data presented because these previous studies included fewer than 20 osteosarcoma patients and more than 70% were poor responders.
In the present study, we used SUVmax—which represents the highest metabolic activity—as a semiquantitative parameter of 18F-FDG uptake. Our data show that SUV2 rather than SUV1 can predict response, suggesting that 18F-FDG PET after chemotherapy can identify residual tumors more correctly than that before chemotherapy and, thus, predict histologic response more accurately. Furthermore, SUV2 was found to be an independent predictor of response to chemotherapy when it was high (>5) or low (≤2), regardless of residual tumor volumetric information. However, SUV2 alone could not precisely predict histologic response for intermediate values of SUV2 (2–5).
For tumors with intermediate SUV2, MVCRs—which encompass both SUV and tumor volume changes—were found to have predictive value. Furthermore, our model was able to predict histologic response correctly in 67 of 70 patients; its predictive values for good and poor responders were 97% and 95%, respectively.
Currently, delineations of tumor margins and the measurements of tumor volumes on PET scans are problematic, because of the arbitrariness of tumor margin cutoff values. Therefore, direct measurement of metabolic volume on a PET scan is difficult. Tumor volume measurements are easier and more reproducible in osteosarcoma than in other tumor types, when an appropriate MRI technique is used (21). Furthermore, in the present study, we used a new parameter, MVCR, to reflect both metabolic and volumetric changes induced by chemotherapy. For all 70 patients, MVCR could discriminate good responders from poor responders with a predictive value of 82% (31/38) and 94% (30/32), respectively (cutoff of MVCR, 0.65). However, in those cases with an intermediate SUV2, MVCR could correctly predict histologic response. Thus, the approach we suggest uses SUV2 initially to predict response and follows this with MVCR in those with an intermediate SUV2 value.
Nevertheless, the present study has some inherent limitations. First, it is a single-center study with a relatively small number of patients. Therefore, the prediction model derived must be validated prospectively in a larger patient population. Second, the partial-volume effect produced by limited spatial resolution may have caused 18F-FDG uptake underestimations in small or necrotic lesions, which would reduce SUV accuracy. Third, VCRs calculated using the ellipsoidal formula might have over- or underestimated tumor volume. Fourth, we did not analyze the cost-effectiveness of 18F-FDG PET. Fifth, our suggested SUV cutoffs may differ for different 18F-FDG PET scanners. Finally, we did not use more a quantitative form of analysis, such as Patlak graphical analysis or other kinetic methods.
CONCLUSION
We found that 18F-FDG PET provides a useful tool for predicting histologic response in osteosarcoma patients. We suggest that combined metabolic and volumetric information on 18F-FDG PET and MRI scans, acquired before and after completing chemotherapy, could be used to predict histologic response to neoadjuvant chemotherapy in osteosarcoma. A future external validation of our prediction model is mandatory. We hope that this study proves to be of benefit during surgical planning, but we emphasize that before using our model to assess response to chemotherapy or tailor neoadjuvant treatment, further confirmatory studies are required.
Acknowledgments
This work was partly supported by Korea Science and Engineering Foundation (KOSEF) grant M20702010002-08N0201-00000, funded by the Korean government (MEST).
Footnotes
-
COPYRIGHT © 2009 by the Society of Nuclear Medicine, Inc.
References
- Received for publication March 1, 2009.
- Accepted for publication May 11, 2009.


Jump to section
Related Articles
Cited By...
- 18F-FDG PET/CT in the Management of Osteosarcoma
- 18F-FDG PET/CT in the Management of Osteosarcoma
- 18F-FDG PET/MRI for Therapy Response Assessment of Isolated Limb Perfusion in Patients with Soft-Tissue Sarcomas
- 18F-FDG Uptake During Early Adjuvant Chemotherapy Predicts Histologic Response in Pediatric and Young Adult Patients with Osteosarcoma
- Sarcoma Mid-Therapy [F-18]Fluorodeoxyglucose Positron Emission Tomography (FDG PET) and Patient Outcome
- Initial Metabolic Tumor Volume Measured by 18F-FDG PET/CT Can Predict the Outcome of Osteosarcoma of the Extremities
- Combination of 18F-FDG PET/CT and Diffusion-Weighted MR Imaging as a Predictor of Histologic Response to Neoadjuvant Chemotherapy: Preliminary Results in Osteosarcoma
- Metabolic Tumor Volume Assessed by 18F-FDG PET/CT for the Prediction of Outcome in Patients with Multiple Myeloma
- Effects of Neoadjuvant Chemotherapy on Image-Directed Planning of Surgical Resection for Distal Femoral Osteosarcoma