


Abstract
Our purpose was to assess the diagnostic potential of simultaneously acquired 18F-FDG PET and MRI data sets for therapy response assessment of isolated limb perfusion (ILP) in patients with soft-tissue sarcomas (STS). Methods: In total, 45 patients with histopathologically verified STS were prospectively enrolled for an integrated 18F-FDG PET/MRI examination before and after ILP. Therapy response was assessed based on different MRI- and PET-derived morphologic (RECIST and the MR-adapted Choi criteria) and metabolic (PERCIST) criteria. In addition, a regression model was used combining relative changes in quantitative variables to predict treatment response under ILP. Histopathologic results after subsequent tumor resection served as the reference standard, and patients were categorized as responders or nonresponders on the basis of the 6-stage regression scale by Salzer-Kuntschik. Results: Histopathologic analysis categorized 27 patients as responders (grades I–III) and 18 patients as nonresponders (grades IV–VI). Calculated sensitivity, specificity, positive and negative predictive values, and diagnostic accuracy were 22%, 89%, 75%, 43%, and 49% for RECIST; 70%, 44%, 66%, 50%, and 60% for the Choi criteria; and 85%, 78%, 85%, 78%, and 82% for PERCIST. Receiver-operating-characteristic analysis revealed an area under the curve (AUC) of 0.56 for RECIST, 0.57 for the Choi criteria, and 0.82 for PERCIST. The combined regression model revealed higher values (AUC, 0.90) than for the stand-alone analysis, however, differences to metabolic parameters did not reach significance (P value: 0.067). Conclusion: Our study demonstrates the superiority of 18F-FDG PET over MRI data sets for response assessment of STS under neoadjuvant ILP. In a clinical setting, MRI delivers valuable information for presurgical assessment. Therefore, combining 18F-FDG PET and MRI data may enable more reliable treatment planning and therapy monitoring of STS.
Soft-tissue sarcomas (STS) are a heterogeneous group of malignant mesenchymal tumors that represent less than 1% of all cancers in adults (1). Limb-preserving complete tumor resection is an important objective for management of sarcoma of the extremities, as limb salvage therapy has been shown to equal limb amputation in terms of overall survival (2). Over the years, several different neoadjuvant therapeutic strategies have evolved to achieve local disease control in cases of locally advanced and nonresectable tumors. Hyperthermic isolated limb perfusion (ILP) with tumor necrosis factor-α and melphalan has been demonstrated to be an efficient preoperative treatment to ensure local disease regression and limb-preserving surgery (3–5). The technique of this neoadjuvant treatment enables the administration of high regional drug concentrations and causes in only rare cases systemic side effects. Previous studies described therapy response rates of 60%–90% and overall limb salvage rates of above 70% (5–7), with reported associations to the histologic sarcoma subtype (8,9).
In clinical practice, therapy response is routinely monitored by changes in tumor size according to RECIST (10). However, exclusive size-based criteria have been shown insufficient for reliable response evaluation of neoadjuvant treatment effects of STS (11,12). Therefore, Stacchiotti et al. introduced the MR-adapted Choi criteria, comprising modified size criteria for tumor response with, in addition, quantification of therapy-related changes in contrast-enhancing tumor parts (13,14). When Stacchiotti et al. compared RECIST with the MR-adapted Choi criteria for prediction of pathologic response in high-grade STS, the Choi criteria showed superior results (13). Apart from size- and morphology-based criteria, several studies have investigated the use of 18F-FDG PET data for therapy response evaluation in sarcomas and found metabolic assessment to be superior to RECIST and volumetric tumor measurements (15–18).
The clinical implementation of integrated PET/MRI systems enables the simultaneous acquisition of morphologic information based on MRI and metabolic data derived from the PET component (19,20). Therefore, this study aimed to perform a direct, intraindividual comparison of RECIST, the MR-adapted Choi criteria, and PERCIST, using a combination of PET- and MRI-derived quantitative parameters obtained within a single examination and to evaluate their clinical utility for response assessment of STS under neoadjuvant ILP.
MATERIALS AND METHODS
Patients
The present study was approved by the institutional review board. Written informed consent was obtained from all patients before each examination. In total, 45 patients (mean age, 53.6 ± 14.1 y) with primary (n = 26) or recurrent (n = 19) STS, scheduled for neoadjuvant treatment with ILP, were included in this prospective study between December 2012 and February 2018. All patients were scheduled to undergo an 18F-FDG PET/MRI examination before the initiation of treatment and a second scan after ILP before limb salvage surgery (mean delay between ILP and second scan, 43.6 ± 6.5 d). Surgery was performed with a mean delay of 21.1 ± 19.8 d after the second PET/MRI examination. The histologic subtypes of the STS are shown in Table 1.
Distribution of Histologic Subtypes of STS
ILP
ILP was performed under mild hyperthermia of 39°C. Nuclear medicine testing with radiolabeled serum (111In) was used for continuous monitoring for leakage. Vascular access via a femoral or iliac approach was chosen for the lower limb and via a brachial or axillar approach for the upper limb. In a first step, recombinant human tumor necrosis factor-α (Beromun; Boehringer-Ingelheim) was administered at a dosage of 1 mg for the upper limb and 2 mg for the lower limb, followed by application of melphalan (l-phenylalanine mustard) at a concentration of 11 mg/L for the legs and 13 mg/L for the arms, with a 15-min delay.
PET/MRI
PET/MRI examinations were obtained with the patient supine on a 3-T Biograph mMR scanner (Siemens Healthineers). Data acquisition started 60 min after a body weight–adapted dose of 18F-FDG had been administered intravenously, resulting in a mean activity of 247 ± 48 MBq for the first scan and 239 ± 42 MBq for the second scan. Patients were told to fast for at least 6 h before the scan. Blood samples were taken to ensure blood glucose levels below 150 mg/dL. PET/MRI data were obtained at 1 or 2 bed positions (depending on the tumor size) comprising a 10-min PET data acquisition per bed position. PET images were reconstructed using the iterative ordered-subset expectation maximization method, with 3 iterations and 21 subsets, a gaussian filter of 4 mm in full width at half maximum, and a 344 × 344 image matrix. Attenuation correction was performed by a vendor-supplied software solution using a 4-compartment-model attenuation map (μ-map) calculated from fat-only and water-only data sets, as obtained by Dixon-based sequences. For MRI of the extremities, mMR body phased-array coils and mMR spine coils were used. MRI data were acquired simultaneously with PET data, using the following sequence protocol: a coronal 3-dimensional volume-interpolated breath-hold examination (VIBE) sequence (repetition time [TR], 3.6 ms; echo time [TE], 1.23 and 2.46 ms; 3.12-mm slices; field of view (FOV), 500 mm), a coronal short tau inversion recovery sequence (TR, 5,990 ms; TE, 57 ms; inversion time, 220 ms; 5-mm slices; FOV, 380 mm), a transversal T1-weighted turbo spin echo (TSE) sequence (TR, 616 ms; TE, 12 ms; 5-mm slices; FOV, 380 mm), a transversal T2-weighted TSE sequence (TR, 4,860 ms; TE, 106 ms; 5-mm slices; FOV, 380 mm), and a fat-saturated transversal 3-dimensional VIBE sequence for dynamic imaging (TR, 4.32 ms; TE, 2.21 ms; 3.5-mm slices; FOV, 380 mm). Therefore, 3 repetitive scans were acquired at a delay of 25, 54, and 86 s after the application of intravenous contrast agent (0.1 mmol of Gadobutrol [Bayer Healthcare] per kilogram of body weight). Additionally, we obtained a transversal contrast-enhanced fat-saturated T1-weighted TSE sequence (TR, 555 ms; TE, 12 ms; 5-mm slices; FOV, 380 mm) and a coronal contrast-enhanced fat-saturated T1-weighted TSE sequence (TR, 549 ms; TE, 13 ms; 5-mm slices; FOV, 380 mm).
Image Analysis
Two physicians with 6 and 5 y of experience in reading MRI and hybrid imaging rated the pre- and posttherapeutic PET/MR images in consensus in random order using dedicated viewing software for hybrid imaging (Syngo.via B30; Siemens Healthineers). They were informed about the patients’ diagnosis and the planned treatment strategy (neoadjuvant ILP followed by surgery) but were blinded regarding histopathologic results after tumor resection. The readers were instructed to evaluate therapy response based on different MRI- and PET-derived morphologic (RECIST 1.1 and Choi criteria) and metabolic (PERCIST) criteria (10,13,21).
For RECIST analysis, the maximum diameter of the tumors was determined on contrast-enhanced fat-saturated T1-weighted MR images. For the MR-adapted Choi criteria, changes in contrast enhancement of the tumor lesions were additionally assessed. Therefore, digital subtractions of T1w VIBE images were obtained and a region of interest was manually drawn around the tumor margins on each slice, encompassing the entire tumor volume. The average contrast enhancement of pre- and posttherapeutic images was measured, and percentage changes were calculated.
To determine metabolic activity, a volume of interest was manually placed on attenuation-corrected 18F-FDG PET data sets, covering the entire tumor volume. SUVs were corrected for body weight, and the SUVpeak (average SUV within a spheric volume of interest of 1 cm3 around the hottest point in the tumor) was automatically generated. For both, contrast-enhancement measurements as well as the determination of 18F-FDG accumulation, muscle was used as the reference tissue. The readers were asked to classify each patient as a therapy responder (complete or partial response) or a nonresponder (stable or progressive disease) in accordance with RECIST, the MR-adapted Choi criteria, and PERCIST (Supplemental Fig. 1; supplemental materials are available at http://jnm.snmjournals.org).
In a further step, for the 3 different variables (tumor size, contrast enhancement, and SUVpeak in pre- and posttherapeutic examinations), the optimal threshold for percentage changes under treatment was calculated. In addition, we used a regression model combining relative changes in the quantitative variables to investigate the potential to predict treatment response under ILP.
Reference Standard
Histopathologic analysis of post-ILP surgical specimen served as the reference standard for the determination of therapy response. Microscopic evaluation was performed on hematoxylin and eosin-stained slides. Tumor regression after ILP was assessed by light microscopy using the grading scale of Salzer-Kuntschik (22). Therefore, histopathologic findings were subdivided into 6 stages based on the percentage of viable tumor amount after therapy, with grade I indicating no vital tumor; grade II, a single vital tumor cell or 1 cluster/5 mm; grade III, less than 10% vital tumor; grade IV, 10%–50% vital tumor; grade V, more than 50% vital tumor; and grade VI, no effect of therapy. Tumor stages I–III were categorized as therapy responders and stages IV–VI as nonresponders, as proposed in previous studies (12,13).
Statistical Analysis
Statistical analysis was performed using the R software environment (version 3.4.4, https://www.r-project.org). The sensitivity, specificity, positive predictive value, negative predictive value, and diagnostic accuracy for RECIST, the MR-adapted Choi criteria, and PERCIST were calculated. A McNemar test was used to determine the statistical significance of differences between the different ratings. P values of less than 0.05 were considered to be statistically significant. In addition, receiver-operating-characteristic (ROC) analysis was performed, and a bootstrap test was used to compare the corresponding area under the curve (AUC) values between the different response criteria. The resulting P values were adjusted according to the Holm–Bonferroni method.
In a further step, for each of the 3 quantitative variables (tumor size, contrast enhancement, and SUVpeak in pre- and posttherapeutic examinations), ROC analysis was performed and the AUCs and optimal threshold were calculated to predict treatment response under ILP. Finally, a combined score from all 6 quantitative variables was determined, and relative changes and all interactions were computed by a LASSO regression. Internal validation was performed by bootstrapping with 1,000 repeats.
RESULTS
Patients
According to the results of histopathologic analysis after surgical tumor resection, 27 (60%) patients were categorized as therapy responders and the remaining 18 (40%) patients as nonresponders (Fig. 1). Table 2 gives an overview of the tumor grades of all 45 patients.
A 56-y-old patient with a leiomyosarcoma of the left limb (arrows). The tumor manifestation does not show significant changes in tumor size (diameter: from 243 to 256 mm), contrast-enhancing tumor parts and metabolic activity (SUVpeak: from 3.9 to 3.6). Histopathologic analysis revealed a regression grade 5 (histopathologic nonresponder).
Tumor Grades of All Patients, According to 6-Stage Salzer-Kuntschik Regression Scale
Morphologic Response Assessment: RECIST
Morphologic analysis of all 45 patients revealed an overall tumor size reduction of 7.9% after ILP. Patients classified as histopathologic responders showed a mean reduction in tumor size of 8.4%; the mean decrease in the nonresponders was 6.9%.
According to RECIST, 8 patients were classified as therapy responders and 37 as nonresponders. Correlating these results with the reference standard, 6 of 27 patients were correctly defined as responders and 16 of 18 as nonresponders, thus resulting in false-positive findings in 2 cases and false-negative findings in the remaining 21 cases.
Morphologic Response Assessment: Choi criteria
Quantitative analysis revealed an overall reduction of 29.4% in contrast enhancement of the tumors during treatment. Contrast enhancement of tumors in histopathologic responders decreased by a mean of 33.2%, whereas the decrease was 23.3% in the nonresponders.
Furthermore, image analysis based on the MR-adapted Choi criteria defined 29 patients as responders and the remaining 16 as nonresponders. Among them, 19 of 27 patients were correctly classified as responders and 8 of 18 as nonresponders, whereas the MR-adapted Choi criteria led to findings that were false-positive in 10 cases and false-negative in 8 cases.
Metabolic Response Assessment
18F-FDG PET data quantification of the sarcomas in pre- and posttreatment examinations revealed a mean reduction in SUVpeak of 47.6%. The histopathologic responders showed a stronger decrease in metabolic activity (58.7%) than the nonresponders (20.1%).
According to PERCIST, 27 patients were rated as therapy responders and the remaining 18 as nonresponders. Based on the reference standard, therapy response was correctly identified in 23 of 27 patients and nonresponse in 14 of 18 patients. Additionally, false-positive and false-negative results were found in 4 patients each.
Comparison of Morphologic and Metabolic Response Criteria
Comparing the results of the 3 response evaluation criteria (Fig. 2; Tables 3 and 4), the Choi criteria and PERCIST enabled correct determination of therapy response with a significantly higher sensitivity than RECIST (P = 0.0016 and 0.0003, respectively; Fig. 3). For correct identification of nonresponders, RECIST and PERCIST revealed a significantly higher specificity than the MR-adapted Choi criteria (P = 0.014 and 0.0286, respectively). Moreover, PERCIST showed a significantly higher positive predictive value than the MR-adapted Choi criteria (P = 0.0202) and a higher negative predictive value than RECIST (P = 0.0014). In addition, PERCIST had better diagnostic accuracy, as well as a significantly higher AUC (0.82), than RECIST (0.56, P = 0.0016) or the MR-adapted Choi criteria (0.57, P = 0.0069).
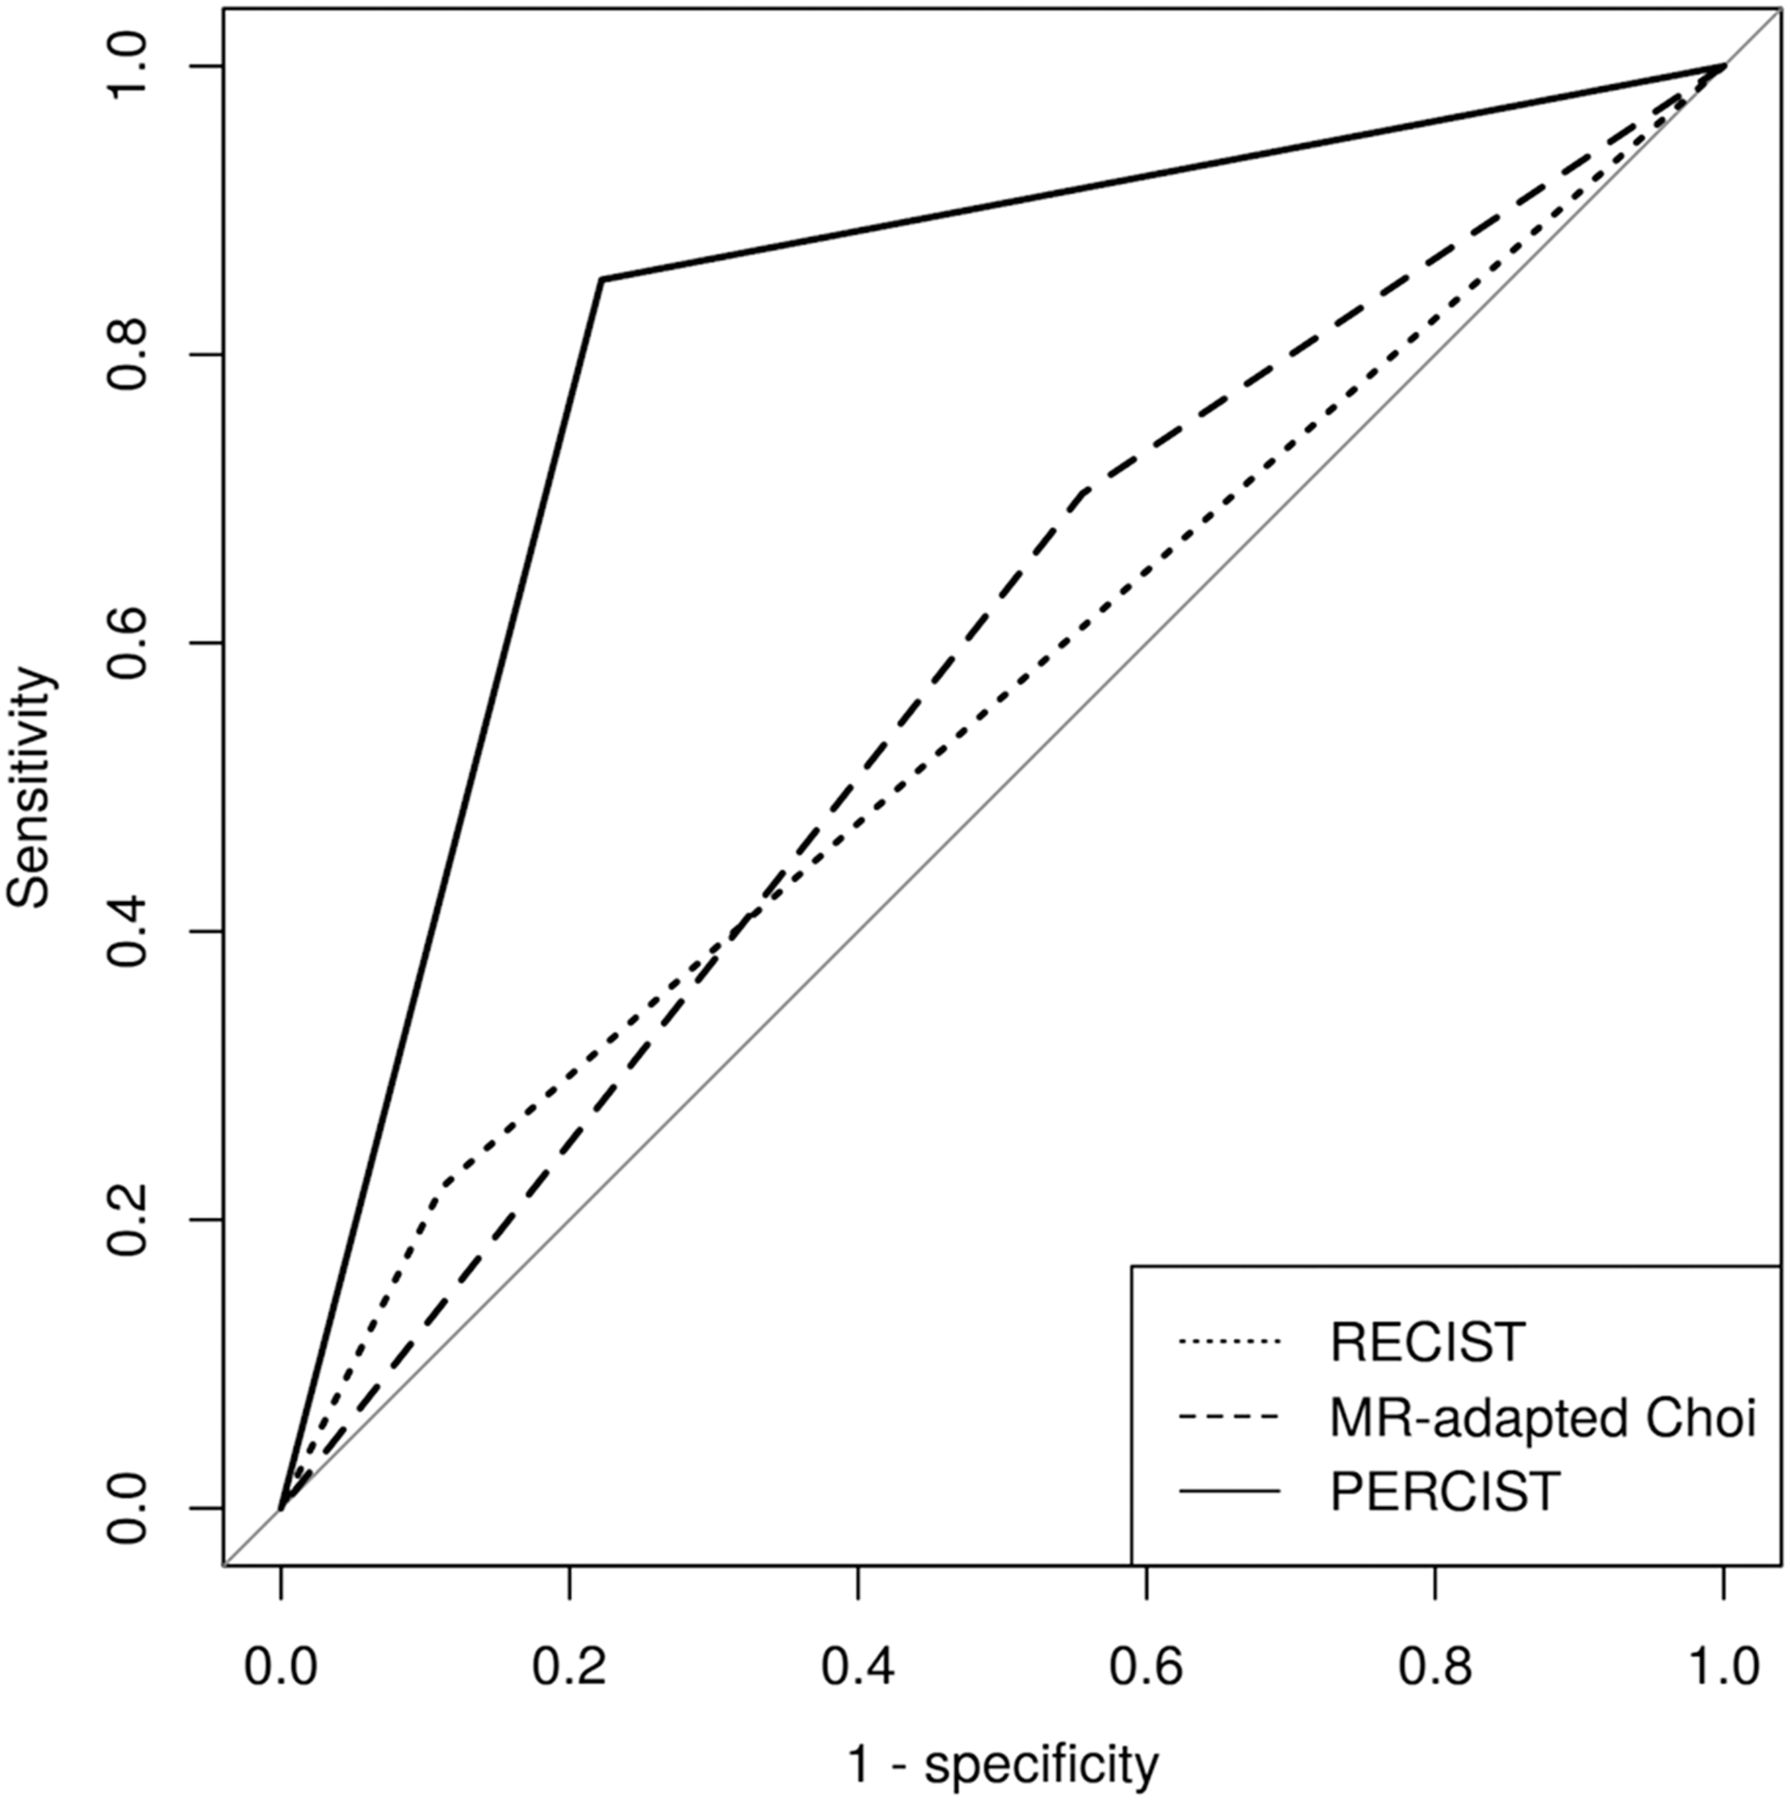
Receiver-operating-characteristic curves of ratings according to RECIST, Choi criteria, and PERCIST.
Sensitivity, Specificity, Positive Predictive Value, Negative Predictive Value, Diagnostic Accuracy, and AUC of the 3 Response Criteria for Differentiation Between Responders and Nonresponders
P Values for Comparison of RECIST, Choi criteria, and PERCIST

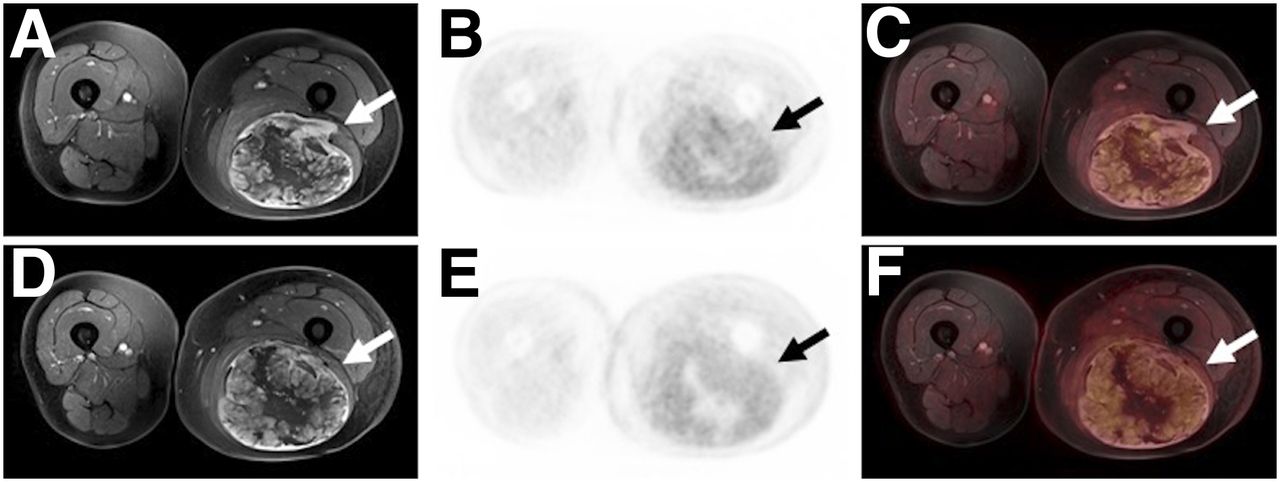
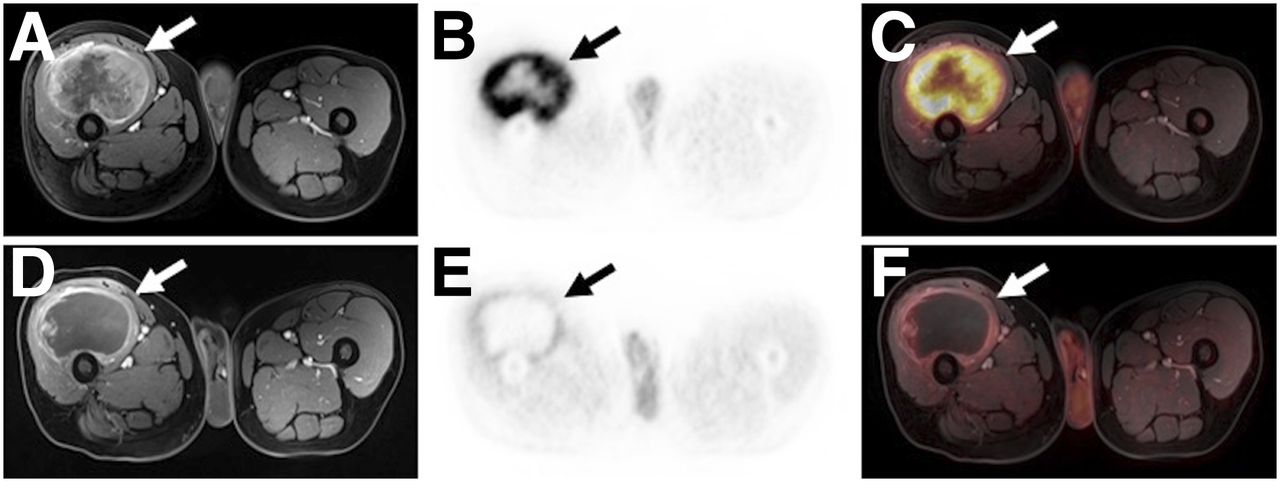
A 60-y-old patient with an undifferentiated pleomorphic sarcoma of the right limb (arrows). The tumor reveals an extensive tumor necrosis and a significant reduction of 18F-FDG uptake (SUVpeak: from 15.3 to 4.1) between pre- (A–C) and posttherapeutic (D–F) examinations, whereas tumor size remains substantially stable (diameter: from 99 to 97 mm). Histopathologic analysis revealed a regression grade 3 (histopathologic responder).
Furthermore, ROC analysis (Fig. 4) revealed an optimal threshold for percentage changes of the quantitative variables under ILP of −7.2% for the maximal tumor diameter, −2.6% for contrast-enhancement of the tumors, and −34.3% for the SUVpeak and corresponding AUC values of 0.59 (maximal tumor diameter), 0.60 (contrast-enhancement), and 0.82 (SUVpeak), respectively. The combined analysis considering relative changes of all 3 quantitative parameters under treatment revealed a higher AUC than for the stand-alone analysis, revealing significantly higher AUC value (0.90) than for tumor diameter and contrast-enhancement alone (P values: < 0.001), whereas differences to the results of SUVpeak did not reach the significance level (P value: 0.067).
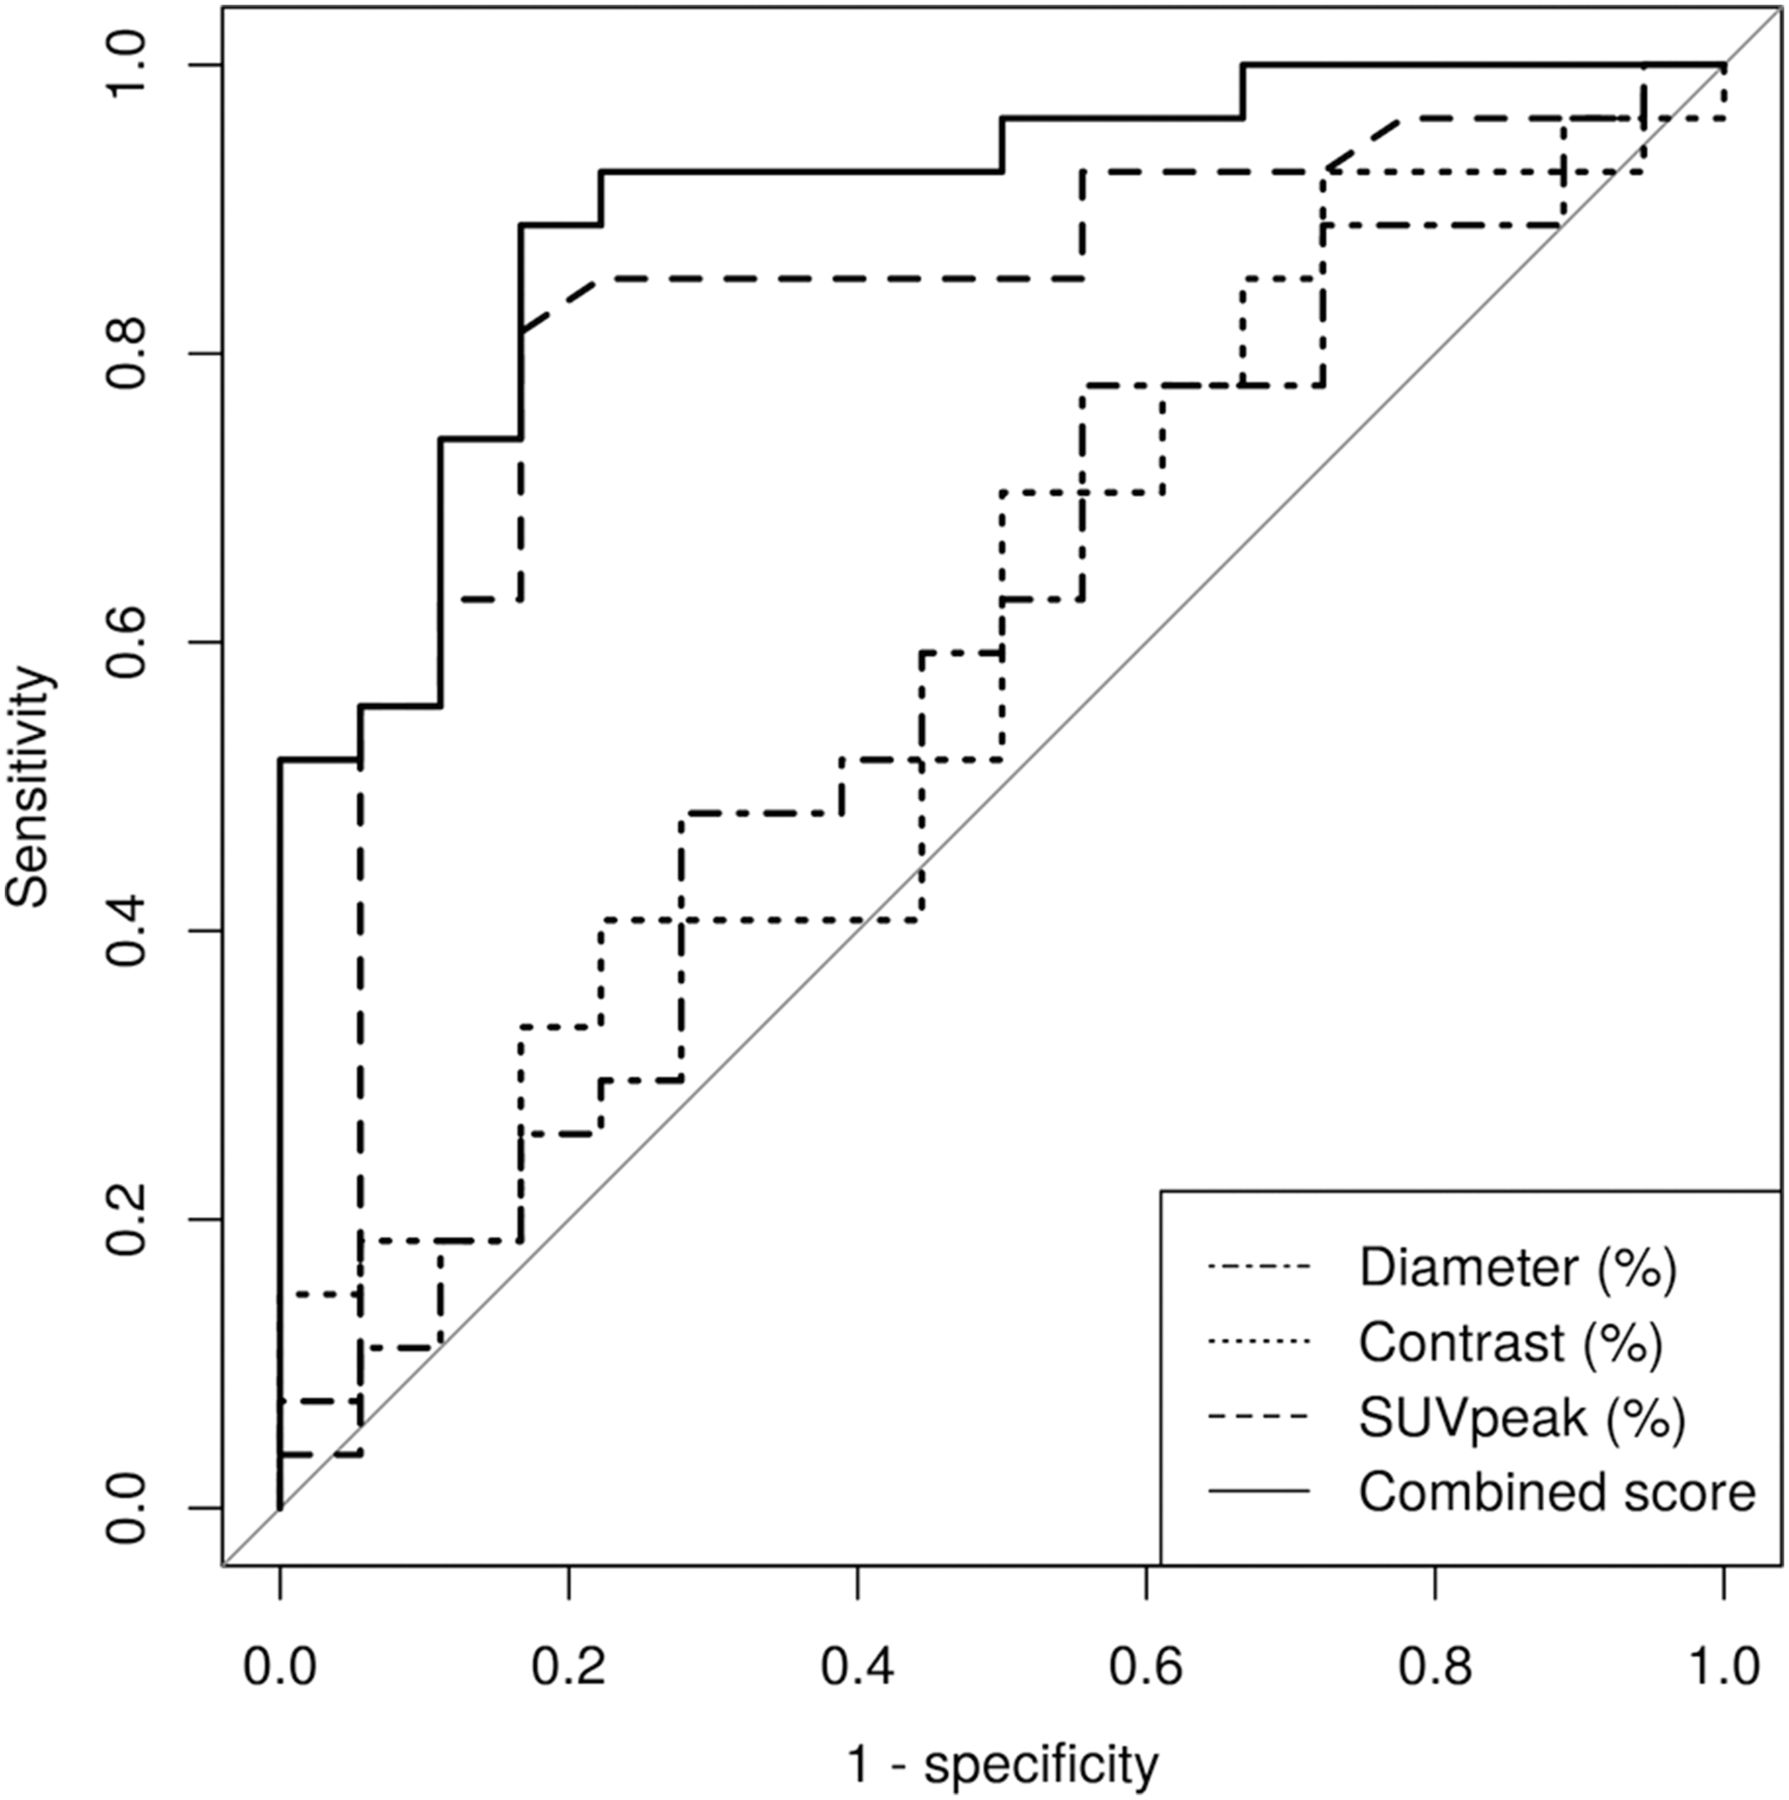
Receiver-operating-characteristic curves of quantitative variables for assessment of therapeutic response to ILP.
DISCUSSION
For locally advanced and nonresectable STS of the extremities, the application of hyperthermic ILP has proven to be an efficient neoadjuvant treatment strategy that enables high limb preservation rates (4,5). The effectiveness of this presurgical therapeutic procedure is determined histopathologically based on the amount of residual viable tumor cells after surgical excision and is of crucial prognostic value. In this context, a number of previous studies defined good histopathologic response in the case of less than 10% viable tumor cells after ILP and poor response to ILP, when residual viable tumor exceeded 10% (12,13,23). Accordingly, we applied this threshold as a reference in our study to assess the effectiveness of PET- and MRI-derived response criteria for differentiation between histopathologic therapy responders and nonresponders to ILP.
Based on its inherently high soft-tissue contrast, MRI is considered the imaging modality of choice for assessing local tumor extent and for planning surgery, as well as for treatment monitoring of STS. Although morphologic response evaluation according to RECIST remains the only universally accepted and the most commonly applied method of monitoring treatment changes in solid tumors, it has been demonstrated insufficient to determine a valid tumor response in STS (11,12). Our data go in line with these findings, yielding a sensitivity of 22% and a diagnostic accuracy of 49% for the prediction of histopathologic therapy response based on RECIST. Especially, large sarcomas commonly have a heterogeneous tissue composition and tend to show highly diverse histopathologic effects under neoadjuvant treatment, such as a persistent size or, in rare cases, an increase in size due to necrosis, fibrosis, and hemorrhage, instead of the anticipated tumor size reduction (24). These paradox treatment effects partially explain the weak association between solely size-based response assessment and therapy-induced histopathologic changes.
Considering these structural changes under therapy, new response criteria were proposed by Choi et al., combining the information of changes in tumor size and tumor density on CT images during treatment (25). Stacchiotti et al. modified and transferred those criteria to contrast-enhanced MRI and successfully applied them for investigations on STS (13,14). The authors reported the MR-adapted Choi criteria to be more sensitive than RECIST (82.4% vs. 41.2%) for preoperative therapy monitoring, when histopathologic response was defined as less than 10% remaining viable tumor cells. In accordance with these results, we found the MR-adapted Choi criteria to be significantly more sensitive than RECIST for correct identification of treatment responders (70.4% vs. 22.2%, P = 0.002). On the other hand, the MR-adapted Choi criteria tended to overestimate the response to therapy, resulting in a significantly lower specificity than RECIST (88.9% vs. 44.4%, P = 0.014). These results underline the weakness of using solely morphologic response criteria in STS, as microscopic regression patterns and functional tumoral changes are not considered.
With the increasing use of 18F-FDG PET in cancer diagnostics and treatment monitoring, several studies have shown the potential of using 18F-FDG PET data to predict the histopathologic response and survival of sarcoma patients (17,18,26). Evilevitch et al. reported a more accurate therapy response evaluation with 18F-FDG PET data quantifications than with tumor size changes (15). In another study, by Denecke et al., 18F-FDG PET data showed better results than MRI-derived parameters for noninvasive response evaluation of patients with osteosarcoma (27). Facing the need for more structured and standardized monitoring of treatment effects with PET, PERCIST criteria have been introduced and previously shown useful for the prediction of therapy response in different tumor entities (21,28). In our study, PERCIST provided the best results for response evaluation of ILP among the 3 different response criteria. Similar to the statements in a review article by Muheremu et al., our results yielded a high sensitivity, specificity, and AUC for 18F-FDG PET for the differentiation between responders and nonresponders under presurgical therapy (29).
In a preliminary study by Schuler et al. investigating a small group of 12 patients, the authors assessed the use of 18F-FDG PET/MRI for monitoring neoadjuvant systemic treatment of sarcoma patients (20). They reported poor agreement between 18F-FDG PET and MRI data for the assessment of therapy response. Although our data show the superiority of 18F-FDG PET in assessing response to therapy, the essential role of MRI for assessing local tumor extent and planning surgery stands without discussion. To underline and understand the importance of the combined assessment of MRI and PET parameters, we performed a combined analysis comprising the information of morphologic and metabolic quantitative parameters. This predictive model facilitated a slight increase in diagnostic accuracy and AUC for differentiation of therapeutic responders from nonresponders, compared with PERCIST alone. Our findings are supported by a study by Cheon et al. demonstrating the potential of combining metabolic and volumetric/morphologic information from 18F-FDG PET and MRI data for predicting histologic response to neoadjuvant chemotherapy in sarcoma patients (30).
Nevertheless, our study is not without limitations. Because of the scarcity of the disease and the strict inclusion criteria for this single-center study, the enrolled cohort was reasonable yet comparatively small. Accordingly, these preliminary results need to be validated in a larger cohort. Furthermore, the fact that our study population comprised patients with different histopathologic subtypes and with primary or recurrent sarcomas might have had an effect on our results.
CONCLUSION
Our results underline the superiority of using 18F-FDG PET data for response assessment of STS under neoadjuvant ILP, when compared with RECIST or the MR-adapted Choi criteria. Furthermore, combining the information of 18F-FDG PET and MR-derived morphologic parameters may enable a more accurate prediction of histopathologic tumor response. Therefore, integrated PET/MRI might serve as a valuable tool for pretherapeutic and presurgical assessment as well as for monitoring neoadjuvant treatment strategies for STS.
DISCLOSURE
No potential conflict of interest relevant to this article was reported.
KEY POINTS
QUESTION: Are there significant differences within an intraindividual comparison between 18F-FDG PET and MRI-derived morphologic criteria for response assessment of STS under neoadjuvant ILP?
PERTINENT FINDINGS: In this study, comprising patients with STS of the limb, 18F-FDG PET data enabled a more accurate differentiation between histopathologic responders and nonresponders under ILP than MRI-derived response criteria. In addition, a regression model combining the metabolic and morphologic information revealed better results, however, differences to metabolic parameters alone did not reach significance level.
IMPLICATIONS FOR PATIENT CARE: 18F-FDG PET data may be highly valuable when implemented into diagnostic algorithms for monitoring neoadjuvant treatment strategies for STS.
Footnotes
Published online Mar. 29, 2019.
- © 2019 by the Society of Nuclear Medicine and Molecular Imaging.
REFERENCES
- Received for publication January 30, 2019.
- Accepted for publication March 13, 2019.


