


Abstract
PET/MRI is an emerging dual-modality imaging technology that requires new approaches to PET attenuation correction (AC). We assessed 2 algorithms for whole-body MRI-based AC (MRAC): a basic MR image segmentation algorithm and a method based on atlas registration and pattern recognition (AT&PR). Methods: Eleven patients each underwent a whole-body PET/CT study and a separate multibed whole-body MRI study. The MR image segmentation algorithm uses a combination of image thresholds, Dixon fat–water segmentation, and component analysis to detect the lungs. MR images are segmented into 5 tissue classes (not including bone), and each class is assigned a default linear attenuation value. The AT&PR algorithm uses a database of previously aligned pairs of MRI/CT image volumes. For each patient, these pairs are registered to the patient MRI volume, and machine-learning techniques are used to predict attenuation values on a continuous scale. MRAC methods are compared via the quantitative analysis of AC PET images using volumes of interest in normal organs and on lesions. We assume the PET/CT values after CT-based AC to be the reference standard. Results: In regions of normal physiologic uptake, the average error of the mean standardized uptake value was 14.1% ± 10.2% and 7.7% ± 8.4% for the segmentation and the AT&PR methods, respectively. Lesion-based errors were 7.5% ± 7.9% for the segmentation method and 5.7% ± 4.7% for the AT&PR method. Conclusion: The MRAC method using AT&PR provided better overall PET quantification accuracy than the basic MR image segmentation approach. This better quantification was due to the significantly reduced volume of errors made regarding volumes of interest within or near bones and the slightly reduced volume of errors made regarding areas outside the lungs.
There is growing clinical and research-based interest in combined PET/MRI (1). However, the attenuation correction (AC) of PET data from PET/MRI acquisitions requires novel solutions (2). Current PET/MRI prototype systems are not equipped with standard transmission sources or CT transmission components (1,3). Therefore, evaluation of MRI-based AC (MRAC) methods must be based on image datasets acquired separately with MRI or PET/MRI and PET/CT, for which standard, validated PET attenuation correction is routinely available.
In general, no unique transformation of MR image intensities into attenuation coefficients exists. The simple rescaling of MR image intensities is impossible; rather, more advanced methods are needed. In the context of brain imaging, several approaches have been presented that derive the attenuation map of the patient's head based on the available MR images (4–8). The development of MRAC for whole-body imaging (3), however, is more challenging, because it involves transforming extended MR image volumes with inhomogeneous signal intensity into the appropriate PET attenuation maps (2,9).
However, the requirements for tissue class discrimination may be less demanding because the percentage of bone tissue in the body is lower than that present in the head. Therefore, in whole-body applications, AC methods that do not account for bone may be sufficient for a wide variety of clinical applications (10). In addition to generating a suitable map from the MR images, the attenuation of MRI radiofrequency coils and ancillary devices must also be accounted for (11,12).
Several innovative approaches to MRAC have been presented thus far. For example, one approach proposed by Martinez-Möller et al. (10) is based on ignoring bone during MR image segmentation. The tissue classes “fat” and “water” are identified using Dixon segmentation (13), “air” and “tissue” are separated using thresholding and a morphologic closing operation, and “lungs” are detected using connected components analysis. This approach is straightforward and easy to implement. However, it may yield local bias, particularly in regions of and near bone, which may represent a main area of clinical application for combined PET/MRI (14). The authors (10) performed a quantitative evaluation on 7 regions of interest in 2 patients, demonstrating the relative difference between the results attained using their segmentation approach and those attained using routine CT-based AC (CTAC), with the gap varying between −6% and 1%. Similar no-bone approaches were suggested by Hu et al. (15) and Steinberg et al. (16).
We previously (6) presented an approach that involved a combination of atlas and pattern-recognition (AT&PR) methods. Although it was designed to be usable in whole-body imaging, this method was clinically evaluated only for human brain imaging.
Here, we quantitatively assessed 2 methods for MRI-based AC in clinically relevant whole-body PET/MRI. Segmentation-based methods are most likely to be used in the first generation of PET/MRI systems because of their more straightforward implementation and fast runtime. Therefore, the first method is a reimplementation of the MRAC segmentation approach suggested by Martinez-Möller et al. (10). The second MRAC method is an extension of the AT&PR approach initially developed by our group for PET/MRI brain imaging (6).
MATERIALS AND METHODS
Data Acquisition
Pairs of MR and PET/CT images from 11 patients were used. All patients had a clinical indication for an 18F-FDG whole-body PET/CT study for oncologic diagnosis. The patients were 6 men and 5 women (mean age ± SD, 66 ± 10 y).
18F-FDG PET/CT examinations were performed on a Biograph HiRez 16 (Siemens) with a low-dose CT scan using a slice thickness of 5 mm and a voxel size of 1.37 × 1.37 mm within the axial image planes. Details of the protocol can be found in the study by Brechtel et al. (17). Patients were asked to hold their breath in normal expiration during the acquisition of the CT data.
Complementary MR images were acquired on a 3-T Verio system (Siemens) using a dual-echo sequence (echo time 1, 1.23 ms; echo time 2, 2.46 ms; repetition time, 3.6 ms; flip angle, 10°). The isotropic spatial resolution of the images was 2.6 mm. In addition, a 2-point Dixon method (13) was used to generate fat- and water-only MR images. The reconstructed opposed phase images (echo time 1) were not used in this study. The acquisition time for each bed position was 18 s, which allowed for breath-hold acquisition.
All data were acquired with patients’ arms up in the PET/CT and MRI examinations. As shown in Supplemental Figure 1 (supplemental materials are available online only at http://jnm.snmjournals.org), patient positioning was similar in the PET/CT and MRI acquisitions. The study was approved by the local ethics committee.
Data Preparation
Marked intensity inhomogeneities are typical of whole-body MR images (Supplemental Fig. 1). Assuming that intensity inhomogeneity can be described by a multiplicative term (18), we corrected for this through
Accurately aligned MRI/transmission or MRI/CT image pairs are mandatory prerequisites for the evaluation of MRAC methods in general. Here, MR and CT images were aligned using a combination of a rigid registration algorithm based on the maximization of mutual information and a nonrigid registration method using a vector field obtained via the composition of small displacements, as previously described (19).
To improve the correspondence between MR and CT image volumes in the training atlas database, areas outside the field of view in the head and neck region of the atlas MR images and misregistered arms were automatically corrected for; they were replaced with segmented areas from the corresponding atlas CT image. Original uncorrected MR images were used to evaluate the MRAC methods.
To evaluate the importance of bone in general and assess the maximum accuracy that can be achieved using a no-bone approach to AC, we generated pseudo-CT images from the original CT images. Two sets of images were generated: in CTnobone, all CT values greater than 200 Hounsfield units (HU) were set to 200 HU, leaving CT values of 200 HU or less unchanged. In CTseg, the CT image was segmented into the 4 classes: air, lung, fat, and soft tissue.
Basic MR Image Segmentation (MRSEG) Approach
We performed a 5-class segmentation of the MR images into air, lungs, fat tissue, a fat–nonfat tissue mixture, and nonfat tissue using the in-phase, fat, and water images. For this purpose, we used image intensity–based thresholding and a simple analysis of connected areas of low intensity. Air and nonfat tissue were determined by thresholding the intensity-normalized in-phase MR image. The misclassification of low-intensity bone voxels as air was minimized via a morphologic image closing operation (10). On the basis of the Dixon fat and water images, voxels within fat images of more than double the intensity as compared with water images were assigned to fat and vice versa. For voxels with fat and water intensities within a factor of 2, we assumed a mixture of fat and water and assigned an attenuation coefficient identical to the mean of the nonfat and fat tissue attenuation. The lungs were detected as the largest connected group of low-intensity voxels.
This approach failed for 2 of 11 patients; in those cases, metal implants caused signal loss, and the low-intensity voxels in the lung appeared as if they were connected with the air outside the patient. We addressed this problem by manually adjusting the lung segmentation for these 2 patients. More advanced methods of lung segmentation in MR images should be capable of fully automating this step (20), but that was beyond the scope of our work. The locations of the metal implants can be found in Table 1.
Relative PET Quantification Errors for 3 VOIs (1 VOI Per Patient) Located Near Metallic Objects Inside Patients
For each of the 5 segmented classes, we assigned the average CT value derived from segmented CT images (Table 2), creating a pseudo-CT image PsCTMRSEG.
Pseudo-CT and Corresponding PET Attenuation Values Used for Different Tissue Classes After MR Image Segmentation
AT&PR Approach
The AT&PR method is based on our previous work (6) but includes several modifications intended to assist in the processing of whole-body data. We used a different registration method and modified kernel function and added pre- and postprocessing steps. The nonrigidly registered MR/CT image pairs were used as an atlas and training database. In our evaluation, we used a leave-one-out cross-validation approach; that is, for each patient, we used the remaining 10 MRI/CT pairs as our atlas database. In the following, the phrase atlas database always refers to the complete database, excluding the images of the patient for whom we are predicting the pseudo-CT image.
In the first step in our process, MR images of the atlas database were registered to the patient MR image using Elastix (21). Images were registered using the 5-class segmentation. Low-intensity values in the abdominal region were assigned a value between those of fat and water to account for the variability in the number, shape, and position of gas pockets in the abdomen, which should be disregarded during the registration process.
The centers of gravity of the atlas and patient MR images were aligned to provide the registration algorithm with optimal initialization. The transformations of the atlas MR images to the patient MR image were applied to the corresponding atlas CT images. This process yielded 10 atlas-based pseudo-CT predictions for each patient.
In the second step, our method predicted a pseudo-CT value for each test voxel on the basis of nearby voxels in the atlas database, creating a pseudo-CT image PsCTAT&PR.
Although averaging the registered atlas CT images would already yield a valid pseudo-CT image for a given test patient, anatomic variability between subjects is high, and nonrigid registration and subsequent averaging would smooth out patient-specific details. It is important to note that the AT&PR method not only uses the position of a voxel in the registered images but also matches the local structures of the MR images, facilitating more patient-specific prediction. Gaussian process regression (22) was used to predict a pseudo-CT value for each voxel of interest.
The kernel, which acts as a similarity measure, was chosen as follows:
The algorithm was trained on samples d that were drawn from random locations in the atlas database. A higher sampling density was used near bone regions because these are particularly challenging.
The pseudo-CT value for each voxel of interest was calculated using
Because the kernel decays quickly with the distance
In the final step, we applied the following automatic postprocessing rules, which override the prediction of AT&PR in cases in which the MRI intensity is sufficient to reliably determine the tissue class: if the local intensity in the in-phase image is higher than a given threshold and if the Dixon segmentation predicts fat (or water), then the voxel in the predicted pseudo-CT image is determined to have at least the value of fat (or water). Voxels that have low MRI intensity and for which none of the atlas-registered CT images predict bone in a nearby location are assumed to be air with a pseudo-CT value of −1,000 HU. This rule helps us to identify gas pockets even if, because of the high variability between patients, no similar structure is present in the atlas database.
Data Evaluation
PET images were reconstructed using the e7 tools (Siemens) via ordered-subsets expectation maximization, with 4 iterations and 8 subsets as in our standard clinical image processing with attenuation and scatter correction. PET image reconstructions were performed using either CTAC (for the reference cases) or MRAC. To create the MRI-derived attenuation maps, the attenuation coefficients of objects outside the patient (including the bed, positioning devices, and ancillary objects) were added to the attenuation map derived from the original CT images. Supplemental Figure 2 shows the original MR and CT images, resulting pseudo-CT images, and PET images obtained using the pseudo-CT data for AC for a representative patient.
PET images obtained via these methods of AC were compared using a set of spheric volumes of interest (VOIs). A nuclear medicine expert placed 21 VOIs on regions of normal physiologic uptake (norm regions) in whole-body PET/CT scans (Fig. 1). In addition, 50% isocontour VOIs were placed on areas of abnormally increased tracer accumulation relative to the surrounding tracer uptake (lesions).

Mean relative errors for SUVs in PET images reconstructed using MRAC with reference images reconstructed using CTAC for VOIs in thorax (A), abdomen (B), and pelvis (C) and for lesion VOIs (D). Triangles indicate individual data points; circles and horizontal bars show means and SD.
To quantify the errors that would be observed in typical clinical settings, we evaluated the standardized uptake values (SUVs) in the PET images with CTAC and MRAC using both segmented and atlas-derived attenuation maps. The SUVs were calculated on the basis of body weight:
Of the 231 VOIs in standard anatomic regions, 223 VOIs were used for subsequent statistical evaluation, 7 were excluded, and 1 was evaluated separately because of artifacts caused by metallic implants. In addition, 28 VOIs were placed on lesions; of these, 22 were used for subsequent statistical evaluation, 4 were excluded, and 2 were evaluated separately. Of the 11 excluded VOIs, 3 were in abdominal gas pockets (which moved between MRI and CT acquisitions), 4 were in areas not properly aligned during MRI/CT registration, and 4 were in areas affected by severe breathing artifacts.
RESULTS
Quantitative Evaluation of PET Images
We reconstructed PET images with AC using CTseg, CTnobone, PsCTMRSEG, and PsCTAT&PR. In the following, we report the differences between these images and the PET images reconstructed with CTAC. Considering CTAC as the reference standard, we thus refer to these differences as errors.
A summary of the average relative errors for the mean SUVs in the VOIs is shown in Table 3. Table 4 shows the number of VOIs with an relative absolute error higher than 10% and 20%. Figure 1 shows the relative errors for each VOI. Supplemental Figure 3 shows a scatterplot of mean SUVs in the VOIs comparing MRAC results with reference CTAC.
Average Relative VOI PET Quantification Errors for Mean SUVs; Results Compared with Those Achieved Using CTAC
Percentage and Number of Nonpulmonary VOIs That Exceed Relative Absolute Quantification Error of 10% and 20%
For lesion VOIs, images reconstructed with AC using PsCTMRSEG showed an average relative error of 7.5% ± 7.9%, compared with 5.7% ± 4.7% when PsCTAT&PR was used (Table 3). The scatterplots (Supplemental Figs. 3C and 3D) are similar, with an R2 value of 0.981 for PsCTMRSEG and of 0.988 for PsCTAT&PR. The relative absolute error was below 20% for both MRI-based methods for all but 1 lesion (Fig. 1D).
The relative error for norm VOIs averaged over all body regions was 14.1% ± 10.2% for images reconstructed with AC using PsCTMRSEG and 7.7% ± 8.4% for those reconstructed with AC using PsCTAT&PR when both were compared with the results obtained using CTAC (Table 3). The scatterplots in Supplemental Figures 3A and 3B show a lower spread for the AT&PR method, with an R2 value of 0.988, as compared with 0.948 for MRSEG.
For the norm region VOIs in the thorax, PET images reconstructed using AC with CTnobone displayed an average relative quantification error of 1.0% ± 0.8% (Table 3). For images reconstructed using AC with CTseg and MRI-based PsCTMRSEG, the average relative error was 10.2% ± 7.5% and 13.5% ± 10.7%, respectively. AC using the AT&PR method created an average relative error of 14.0% ± 11.4%.
Of the 55 pelvic and abdominal VOIs placed in osseous tissue, more than 20 VOIs yielded relative absolute errors at a rate higher than 10% in images reconstructed using AC with CTnobone and CTseg (Table 4). The additional bias witnessed in AC with CTseg was caused by the segmentation of the CT image into tissue classes. For images reconstructed using AC with PsCTMRSEG, 47 VOIs yielded a relative absolute error higher than 10%, whereas this was the case for only 12 VOIs when PsCTAT&PR was used. The greater underestimation of bone in the attenuation maps derived from PsCTMRSEG resulted in generally lower SUVs in VOIs located in osseous tissue than was the case when CTAC was used.
For the 103 nonpulmonary VOIs outside osseous tissue, the modification of the CT images did not lead to a significant number of relative absolute errors above 10% or 20%. For PET images reconstructed using AC with PsCTMRSEG, 49 VOIs showed relative absolute error levels above 10%. Of those, 8 VOIs (which were mostly located in the immediate vicinity of osseous tissue) showed error rates higher than 20%. Ten VOIs showed higher error rates than 10% for images derived using AC with AT&PR. Only 1 VOI showed an error above 20%.
Metal Implants
Three of the 11 patients had metal implants that led to local signal loss in the MR images (Fig. 2). Because the presence of metal led to substantial errors, we evaluated these VOIs separately (Table 1).
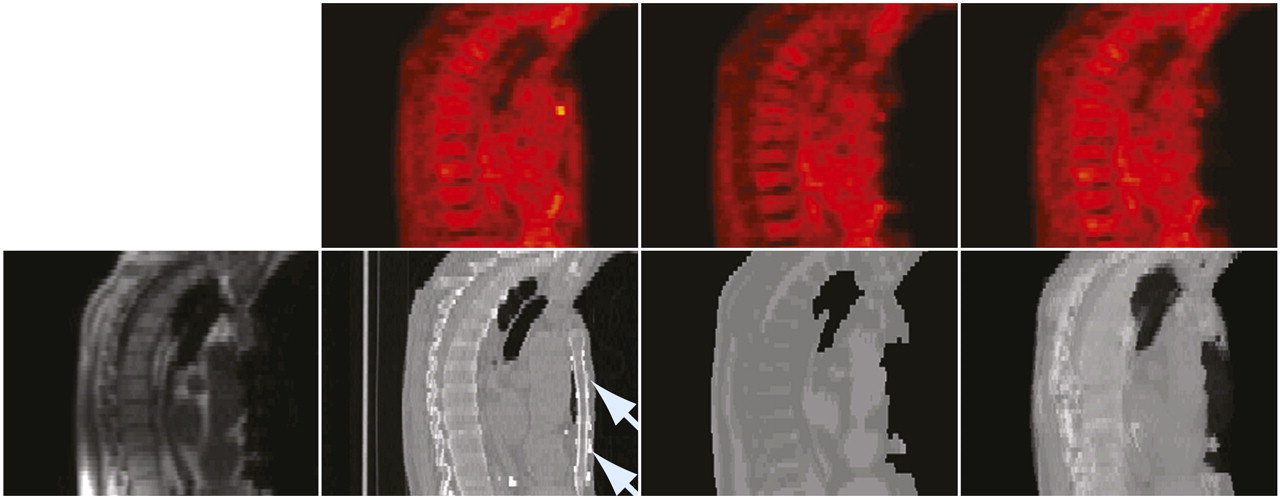
Patient with metal implant in sternum. Bottom row, from left to right: in-phase MR image; CT image, with arrows indicating location of metal implant; pseudo-CT from 5-class MR image segmentation; and AT&PR based pseudo-CT. Top row: corresponding PET images reconstructed using pseudo-CT images for AC.
For images reconstructed with AC using PsCTMRSEG, the relative absolute error was above 40% in all 3 cases; with PsCTAT&PR, it was below 10% for 2 cases and 40% in the other.
DISCUSSION
By performing attenuation correction using CT-derived attenuation maps CTnobone and CTseg, we evaluated the minimum achievable error of any AC method that ignores bone or segments the attenuation map into tissue classes. Subsequently, we evaluated the actual error obtained when AC is performed based on MR images using an MR image segmentation approach that ignores bone and the AT&PR method that predicts attenuation values on a continuous scale (including bone). The evaluation was performed using regional quantitative analysis in regions of normal uptake and in lesions defined via focally increased tracer uptake on 18F-FDG PET.
The attenuation maps created from the CT-derived images CTnobone and CTseg represent ideal scenarios for an AC approach that ignores bone because the bone voxels were always assigned the closest attenuation value among those of all other tissues. Thirty-eight percent of VOIs placed in osseous tissue showed quantification errors higher than 10% for images reconstructed with CTnobone attenuation maps when compared with PET images reconstructed after CTAC. Thus, for VOIs located in bone tissue, even a method of AC that does not predict attenuation values beyond the range of soft tissue but that is otherwise accurate might not be sufficiently precise for quantification tasks.
In practice, it is not immediately clear what tissue class an MR image segmentation approach will predict for bone areas. In our MR image segmentation approach, for example, the bone marrow in the vertebrae of the spine was often identified as fat via Dixon segmentation. This misclassification is one of the reasons why the PET quantification errors obtained for images reconstructed with AC using the MRI-derived pseudo-CT image PsCTMRSEG were higher than for those reconstructed via AC using the CT-derived CTseg when both were compared with the PET images reconstructed after CTAC.
Thus, although segmented CT images indicate a valid lower bound for the error that could theoretically be achieved using a segmentation-based MRAC method, these results hardly can be achieved in practice because of tissue misclassification.
Of the 2 evaluated MRAC methods, the AT&PR method yielded higher accuracy than did the basic MR image segmentation approach, mostly because of significantly better accuracy within and near bone tissue, in which MRSEG yielded error levels up to 51% and AT&PR yielded error levels only as high as 22%. Another reason was that attenuation values were predicted on a continuous scale on the basis of the local context. Because the prediction is based on the similarity of a patch around a voxel in patient MRI data to patches from multiple registered atlas MR images, individual MR image segmentation errors and artifacts in MRI data have a lower impact on the prediction accuracy if this method is used.
As previously mentioned, the relative absolute quantification error for images reconstructed after AC using both MRI-based methods was below 20% for all but 1 lesion. Against this backdrop, the first clinical applications of PET/MRI in the future will help to define a clinically acceptable bias for MRAC. Personal communication with nuclear medicine imaging experts indicated that error levels below 10% would typically not affect clinical diagnosis in oncology but that in more specific PET applications such as the evaluation of neuroreceptors or inflammation, or in β-cell mass imaging, quantification error would need to be reduced.
Both of the presented methods exhibited large relative PET SUV differences in the lungs (Table 3). Lung density varies between individuals, especially in cases of respiratory disease. Even for healthy patients, lung density and corresponding attenuation values depend on respiratory and body position (24), age, or smoking habits (25).
With the MRI sequences used in this study and other standard MRI sequences with echo times longer than 1 ms, signal intensity from the lungs is low, and different levels of lung density cannot be easily distinguished. Thus, MRI patches in the lung region could not provide sufficient information for the AT&PR method to distinguish between different lung densities, resulting in an equally high relative error level as that found with the segmentation approach, for which the same attenuation value was assigned to all lung voxels.
We suggest in a next step to evaluate dedicated MRI sequences that are suitable for MRAC in the lungs: for example, sequences with ultra-short echo times, which have been shown to produce signal from the lung parenchyma (26). Acquisition times for ultra-short echo time sequences are, however, far longer than would be acceptable for breath-hold acquisitions (8). Alternatively, emission data could be used to estimate the lung attenuation coefficients (27).
Martinez-Moeller et al. (10) pointed out that for a patient with a lung tumor, attenuation at the tumor location cannot be predicted on the basis of an atlas; accurate attenuation correction in the case of anatomic anomalies is of particular importance for clinical use. Indeed, a method based only on atlas registration cannot be used to predict the attenuation of any structure not present in the atlas template images. As outlined, we combine an atlas approach with pattern recognition to compare patches in the patient MR image with an extensive database of patches sampled from the template MR images. If the intensity in the MR image is above a certain threshold, then the predicted attenuation map at this position will have at least the attenuation value of soft tissue. This simple processing step ensures that for any anatomic structure visible on the MR image, our approach predicts at least the attenuation value of soft tissue. Therefore, our AT&PR approach is locally accurate for most lesions because tumors typically consist of soft tissue with an attenuation value similar to that of water.
Metal artifacts are known to bias PET quantification when propagated through CTAC (28,29). Our study indicates that metal-induced artifacts extend over larger image areas and are, therefore, more likely to affect quantification. Whereas metal objects in CTAC PET lead to both the overestimation and the underestimation of PET values (29), the signal loss in MR images would rather lead to the underestimation of PET attenuation and, therefore, lower PET values. Atlas-based methods include prior assumptions about attenuation values at a given location, which can make them more robust against artifacts caused by metal objects. Our study supports this assumption; the AT&PR method was able to produce an attenuation map with an absolute error level less than 10% for 2 of 3 cases. Its failure to do so in the third case was due to a metal artifact created by a sternal wire, which resulted in a large deterioration of the body outline (Fig. 2). The segmentation and subsequent atlas registration failed, resulting in an attenuation map with a deformed representation of the thorax.
Although in this study all patients were examined with their arms up during both the PET/CT and the MRI scans, with both examinations performed on the same day, there was unavoidable movement between exams. We attempted to account for this using nonrigid registration. This type of registration is a challenge for whole-body data, and we observed residual local inaccuracies. In obvious cases of misalignment, we excluded affected VOIs from further evaluation. However, other regions might also have been affected by less obvious registration errors. Therefore, the reported errors must be regarded as the sum of contributions from inaccurate MRI-based attenuation map prediction and from inaccurate MRI/CT registration. For areas of low intensity, the reconstruction process is noisy and may also contribute relative errors beyond what is caused only by errors in the attenuation maps. These errors affect the presented results for both the segmentation and the AT&PR approach and should, therefore, have little influence on our comparison of the 2 approaches.
As the CT and MRI datasets in the atlas database had a different slice thickness (5 mm for CT vs. 2.5 mm for MRI) the higher MRI interslice resolution could not be fully used, as the resulting pseudo-CTs were resampled to the same slice thickness as the CT images in the atlas database. When using CT data reconstructed with a lower slice thickness, we expect the pseudo-CT prediction quality to improve.
CONCLUSION
The MRAC method using AT&PR provided better overall PET quantification accuracy than did the basic MR image segmentation approach. This was because errors were significantly reduced for regions within or near bones and slightly reduced in other areas outside the lungs. Both algorithms performed relatively poorly in the lungs.
DISCLOSURE STATEMENT
The costs of publication of this article were defrayed in part by the payment of page charges. Therefore, and solely to indicate this fact, this article is hereby marked “advertisement” in accordance with 18 USC section 1734.
Acknowledgments
We thank Massachusetts General Hospital, Matthias Fenchel from Siemens MR, Erlangen, and Christophe Chefd'hotel from Siemens Corporate Research, Princeton, for providing the registered whole-body MRI/CT datasets. Financial research support was provided through Deutsche Forschungsgemeinschaft grants PI771/5-1 and PI771/1-1 as well as through the Swiss Werner Siemens Foundation. Thomas Beyer is the founder and president of Switzerland-based cmi experts GmbH and reports no conflict of interest. No other potential conflict of interest relevant to this article was reported.
Footnotes
↵* Contributed equally to this work.
Published online Aug. 9, 2011.
- © 2011 by Society of Nuclear Medicine
REFERENCES
- Received for publication May 11, 2011.
- Accepted for publication May 24, 2011.


Jump to section
Related Articles
Cited By...
- Optimized Whole-Body PET MRI Sequence Workflow in Pediatric Hodgkin Lymphoma Patients
- Zero-Echo-Time and Dixon Deep Pseudo-CT (ZeDD CT): Direct Generation of Pseudo-CT Images for Pelvic PET/MRI Attenuation Correction Using Deep Convolutional Neural Networks with Multiparametric MRI
- Impact of MR-Based Attenuation Correction on Neurologic PET Studies
- MRI-Based Attenuation Correction for PET/MRI Using Multiphase Level-Set Method
- Quantitative Evaluation of Segmentation- and Atlas-Based Attenuation Correction for PET/MR on Pediatric Patients
- Whole-Body PET/MR Imaging: Quantitative Evaluation of a Novel Model-Based MR Attenuation Correction Method Including Bone
- Impact of Time-of-Flight PET on Quantification Errors in MR Imaging-Based Attenuation Correction
- MR-Based Attenuation Correction Using Ultrashort-Echo-Time Pulse Sequences in Dementia Patients
- PET Attenuation Correction Using Synthetic CT from Ultrashort Echo-Time MR Imaging
- Improvement of Attenuation Correction in Time-of-Flight PET/MR Imaging with a Positron-Emitting Source
- Performance of Whole-Body Integrated 18F-FDG PET/MR in Comparison to PET/CT for Evaluation of Malignant Bone Lesions
- Clinical and research applications of simultaneous positron emission tomography and MRI
- MR-Based Attenuation Correction Methods for Improved PET Quantification in Lesions Within Bone and Susceptibility Artifact Regions
- Hybrid PET/MR Imaging of the Heart: Potential, Initial Experiences, and Future Prospects
- Comparison of Segmentation-Based Attenuation Correction Methods for PET/MRI: Evaluation of Bone and Liver Standardized Uptake Value with Oncologic PET/CT Data
- Workflow and Scan Protocol Considerations for Integrated Whole-Body PET/MRI in Oncology
- Variable Lung Density Consideration in Attenuation Correction of Whole-Body PET/MRI