


Abstract
Accurate measurement of changes in amyloid-β (Aβ) deposition over time is important in longitudinal studies, particularly in anti-Aβ therapeutic trials. To achieve this, the optimal reference region (RR) must be selected to reduce variance of Aβ PET measurements, allowing early detection of treatment efficacy. The aim of this study was to determine the RR that allows earlier detection of subtle Aβ changes using 18F-florbetaben PET. Methods: Forty-five patients with mild cognitive impairment (mean age ± SD, 72.69 ± 6.54 y; 29 men/16 women) who underwent up to 3 18F-florbetaben scans were included. Baseline scans were visually classified as high (Aβ+) or low (Aβ−) amyloid. Six cortical regions were quantified using a standardized region-of-interest atlas applied to the spatially normalized gray matter image obtained from segmentation of the baseline T1-weighted volumetric MRI. Four RRs (cerebellar gray matter [CGM], whole cerebellum [WCER], pons, and subcortical white matter [SWM]) were studied. The SUV ratio (SUVR) for each RR was calculated by dividing cortex activity by RR activity, with a composite SUVR averaged over 6 cortical regions. SUVR increase from baseline to 1 and 2 y, and percentage Aβ deposition per year, were assessed across Aβ+ and Aβ− groups. Results: SUVs for any RR were not significantly different over time. Percentage Aβ accumulation per year derived from composite SUVR was 0.10 ± 1.72 (Aβ−) and 1.36 ± 1.98 (Aβ+) (P = 0.02) for CGM and 0.13 ± 1.47 and 1.32 ± 1.75 (P = 0.01), respectively, for WCER. Compared with baseline, the composite SUVR increase in Aβ+ scans was significantly larger than in Aβ− scans at 1 y (P = 0.04 [CGM]; P = 0.03 [WCER]) and 2 y (P = 0.02 [CGM]; P = 0.01 [WCER]) using these 2 RRs. Significant SUVR changes using the pons as the RR were detected only at 2 y (P = 0.46 [1 y], P = 0.001 [2 y]). SUVR using the SWM as the RR showed no significant differences at either follow-up (P = 0.39 [1 y], P = 0.09 [2 y]). Conclusion: RR selection influences reliable early measurement of Aβ changes over time. Compared with SWM and pons, which do not fulfil the RR requirements and have limited sensitivity to detect Aβ changes, cerebellar RRs are recommended for 18F-florbetaben PET because they allow earlier detection of Aβ accumulation.
The approved method for the classification of amyloid-β (Aβ) PET scans in clinical practice is based on visual assessment. However, accurate measurement of changes in Aβ deposition over time is important in longitudinal observational studies and interventional therapeutic trials of Aβ-modifying treatments for Alzheimer disease (AD). PET is currently being used to monitor response to therapy in such trials (1–3), but longitudinal measurement of amyloid load is challenging because Aβ changes over time can be subtle (4,5). For this reason, optimization of image analysis is crucial to reduce variability and allow early detection of treatment efficacy.
One means of assessing amyloid load is semiquantitative measurement using the SUV ratio (SUVR). SUVR measurement does, however, require normalization of PET activity in the target region to a reference region (RR) to account for nondisplaceable radiotracer binding. A suitable RR must have the same nondisplaceable activity (free plus nonspecific binding) as the target region, to ensure it has blood flow characteristics similar to the target region and is free of Aβ (6). These requirements are fulfilled by cerebellar gray matter (CGM), except in patients with advanced-stage AD (7) and in those with some types of familial AD (8), in whom some Aβ may be present in the CGM. In the intended clinical population for brain Aβ imaging, however, CGM is likely to be devoid of Aβ. Furthermore, the effect of cerebellar plaques in cortical 18F-florbetaben SUVRs appears to be negligible, even in advanced stages of AD with high cortical Aβ load (9). Limitations of this RR, however, include the small size of the region and its proximity to the edge of the scanner field of view, where truncation or scatter influence can decrease the signal-to-noise ratio (6,10).
The potential issues with using the cerebellar cortex as the RR provide the rationale for testing other RRs, such as the whole cerebellum (WCER), white matter, or pons, for which nonspecific tracer retention means they do not fulfill the requirements for an RR. WCER has been used successfully to track amyloid changes in therapeutic clinical trials using 18F-florbetapir (3). However, recent research suggests that subcortical white matter (SWM) may improve the power to track longitudinal Aβ changes using 18F-florbetapir (11–15), whereas the pons seems superior to the cerebellar cortex for detecting change over time with 18F-flutemetamol PET (12). These findings are supported by a recent study in which SUV stability in different RRs was compared for different amyloid tracers (18F-flutemetamol, 18F-florbetapir, and 18F-florbetaben), across time, across clinical conditions, and across cerebral Aβ status (16). The study concluded that the RR with largest stability of SUV can be tracer-specific, not allowing the generalization of the findings from one Aβ radiotracer to the others.
Although CGM has been extensively validated in 18F-florbetaben cross-sectional studies (17–19), little is known about its robustness in tracking longitudinal changes over time and how it compares with other RRs. The objective of the present work was to identify an RR that allows early detection of subtle Aβ changes using 18F-florbetaben PET.
MATERIALS AND METHODS
Participants
The study population consisted of 45 patients with mild cognitive impairment (MCI) (mean age, 72.69 ± 6.54 y; 29 men/16 women) and has previously been described in detail (20–22). This study was conducted in accordance with the Declaration of Helsinki and was approved by the Austin Health Human Research Ethics Committee. All participants (or their legal representatives) provided written informed consent to undergo brain MRI and PET scanning with 18F-florbetaben.
Image Acquisition
Participants underwent MRI scans and 18F-florbetaben PET scans at baseline (n = 45), 1 y (n = 41), and 2 y (n = 36). Imaging was performed with a Philips Allegro PET camera as previously described (22). A 2-min transmission scan using a rotating 137Cs source was obtained for attenuation correction immediately before scanning. Each participant then received intravenous 18F-florbetaben (average, 286 ± 19 MBq), and images were acquired between 90 and 110 min after injection. Images were reconstructed using a 3-dimensional row-action maximum-likelihood algorithm (Philips). Three-dimensional T1-weighted MRI was performed before the PET scan.
Image Analysis
Image analysis was performed using SPM12 software (http://www.fil.ion.ucl.ac.uk/spm/doc/). Motion correction was conducted for each PET scan, and an average PET image was generated. Each patient’s 3 PET scans were then realigned to the average. The average PET image was coregistered to the baseline MR image, and the same transformation was applied to each individual PET scan. Baseline MR images were segmented into gray matter, white matter, and cerebrospinal fluid. Baseline MRI was normalized on the T1 template provided with SPM, and the same transformation was applied to the PET images and MRI segmentation.
The standardized Automated Anatomic Labeling volume of interest template (23) was applied to the spatially normalized gray segmentation of the MRI to generate regions of interest (ROIs) in the CGM and frontal, lateral temporal, occipital, parietal, anterior cingulate, and posterior cingulate cortices. SWM and pons ROIs were generated by applying a manually defined mask around the centrum semiovale to the spatially smoothed normalized white segmentation of the MRI with a gaussian kernel (full width at half maximum, 10 mm). The WCER ROI was generated using a manually defined mask to the sum of the normalized gray and white segmentation of the MRI (Fig. 1).
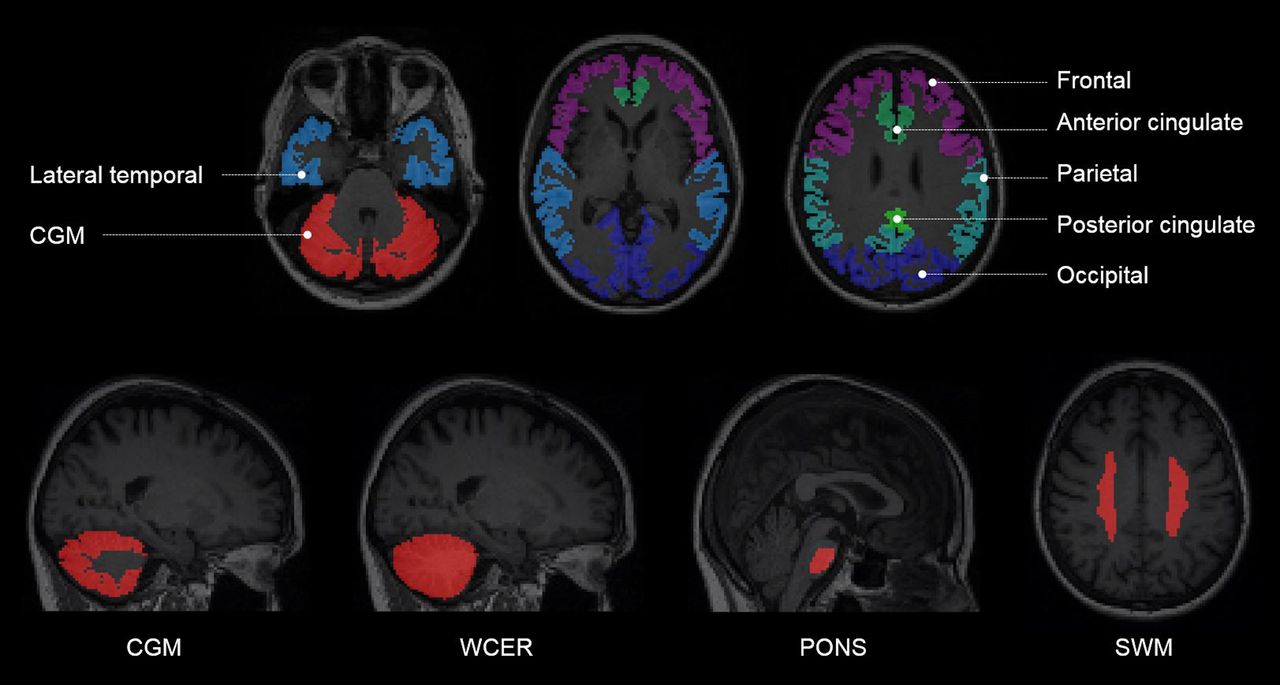
Example of regions of interest generated from segmentation of each subject’s MRI.
Mean radioactivity values were obtained from each ROI without correction for partial-volume effects applied to the PET data. The SUV, defined as the decay-corrected brain radioactivity concentration normalized for injected dose and body weight, was calculated for all regions. These values were then used to derive the SUVR, as the ratio of the activity in the cerebral cortical regions to the activity of the RR. Four RRs (CGM, WCER, pons, and SWM) were studied, and a composite SUVR was calculated for each RR by averaging the SUVR of 6 cortical regions (frontal, occipital, parietal, lateral temporal, and posterior and anterior cingulate regions) (24).
Visual Assessment
Baseline 18F-florbetaben PET images underwent visual assessment by 5 independent nuclear medicine physicians blinded to clinical data following the reading methodology previously described by Seibyl et al. (25). A scan was read as positive if increased tracer uptake was visible in any of the frontal, parietal, temporal, or posterior cingulate/precuneus cortices compared with white matter. The final result of the visual assessment was based on the majority read (i.e., agreement of most of the 5 independent blinded readers).
Study Hypothesis
Longitudinal measurement of Aβ is challenging, given the lack of a standard of truth. Aβ change cannot be inferred from postmortem histopathologic determination of Aβ accumulation in the brain, as performed in cross-sectional studies. The study hypothesis was that the accumulation of Aβ over the 2-y follow-up will progress in those MCI patients visually assessed as positive while no or little Aβ accumulation will be observed in MCI patients visually assessed as negative (26). The RR that yielded the lowest SUVR variance allowing the earliest detection of Aβ changes between Aβ-positive and -negative MCI patients was determined.
Statistical Analysis
Statistical analysis was performed using R (http://www.R-project.org/). A P value of lower than 0.05 was considered significant.
SUV Analysis
SUVs at baseline, 1 y, and 2 y were assessed using a repeated-measures ANOVA to analyze possible change over time. Relative changes in SUVs between 2 RRs (REF1 and REF2) were assessed by calculating the ratio of the SUVs of these 2 RRs (SUVRRR = SUVRREF2/SUVRREF1) at baseline, 1 y, and 2 y. A linear regression model was fitted to each participant’s data ( ), where SUVRRR is the SUVR, t is the scan time, and α0 and α1 are the coefficients of the model. The slope of the regression line (α1) in the groups of participants visually assessed as positive and negative was compared with zero using t tests (
 vs.
vs.  ). Rejection of the null hypothesis in these tests indicates that the 2 RRs compared show different behavior over time. Because of the explorative nature of this analysis, no corrections for multiple comparisons were made.
SUVR Analysis
The change in SUVR from baseline (SUVRbaseline) to 1 y (SUVR1y) and 2 y (SUVR2y) was calculated as follows:

The SUVR change between the groups of participants visually assessed as positive and negative was compared using unpaired t tests ( vs.
vs.  ). A linear regression model was fitted to each participant’s data
  , where t is the scan time, and β0 and β1 are the coefficients of the model. The percentage of Aβ deposition per year (Aβdep) was defined as Aβdep = 100·β1/SUVRbaseline. The Aβdep was compared in the groups of participants visually assessed as positive and negative using an unpaired t test (
 vs.
vs.  ). Cohen’s d was used to measure the effect size of the percentage Aβ accumulation per year between scans visually assessed as negative and positive.
RESULTS
SUV Analysis
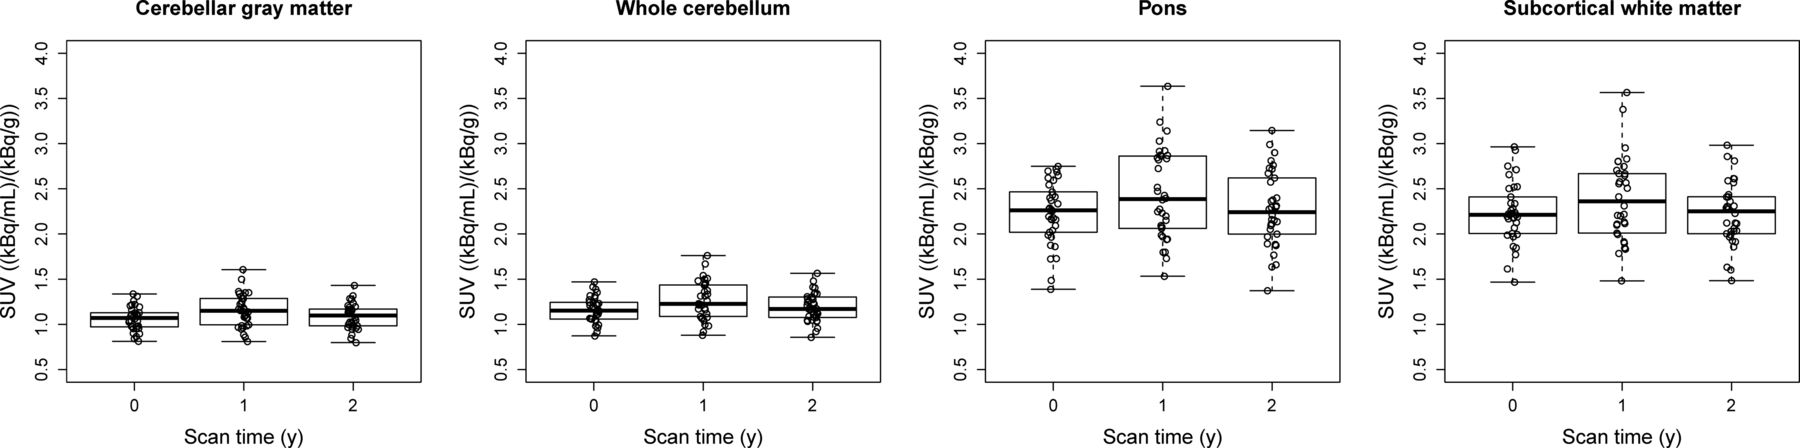
No statistically significant differences over time were detected in SUV for any of the RRs studied (P = 0.53 [CGM], 0.57 [WCER], 0.68 [pons], and 0.89 [SWM]) (Fig. 2). Further analysis showed that the ratio of SUV in WCER and pons to the SUV in CGM (SUVRRR) was stable over time, indicating that WCER and pons follow time courses similar to CGM (P = 0.78 [SUVWCER–to–SUVCGM ratio], P = 0.37 [SUVpons–to–SUVCGM ratio]). SUV of the SWM showed, however, a statistically significant tendency to decrease with respect to the SUV of the CGM in the negatives group (P = 0.05 [SUVSWM–to–SUVCGM ratio]), indicating that SWM did not follow a time course similar to CGM for all the subjects.

SUVs over time for different RRs.
SUVR Change and Aβdep
Composite SUVR
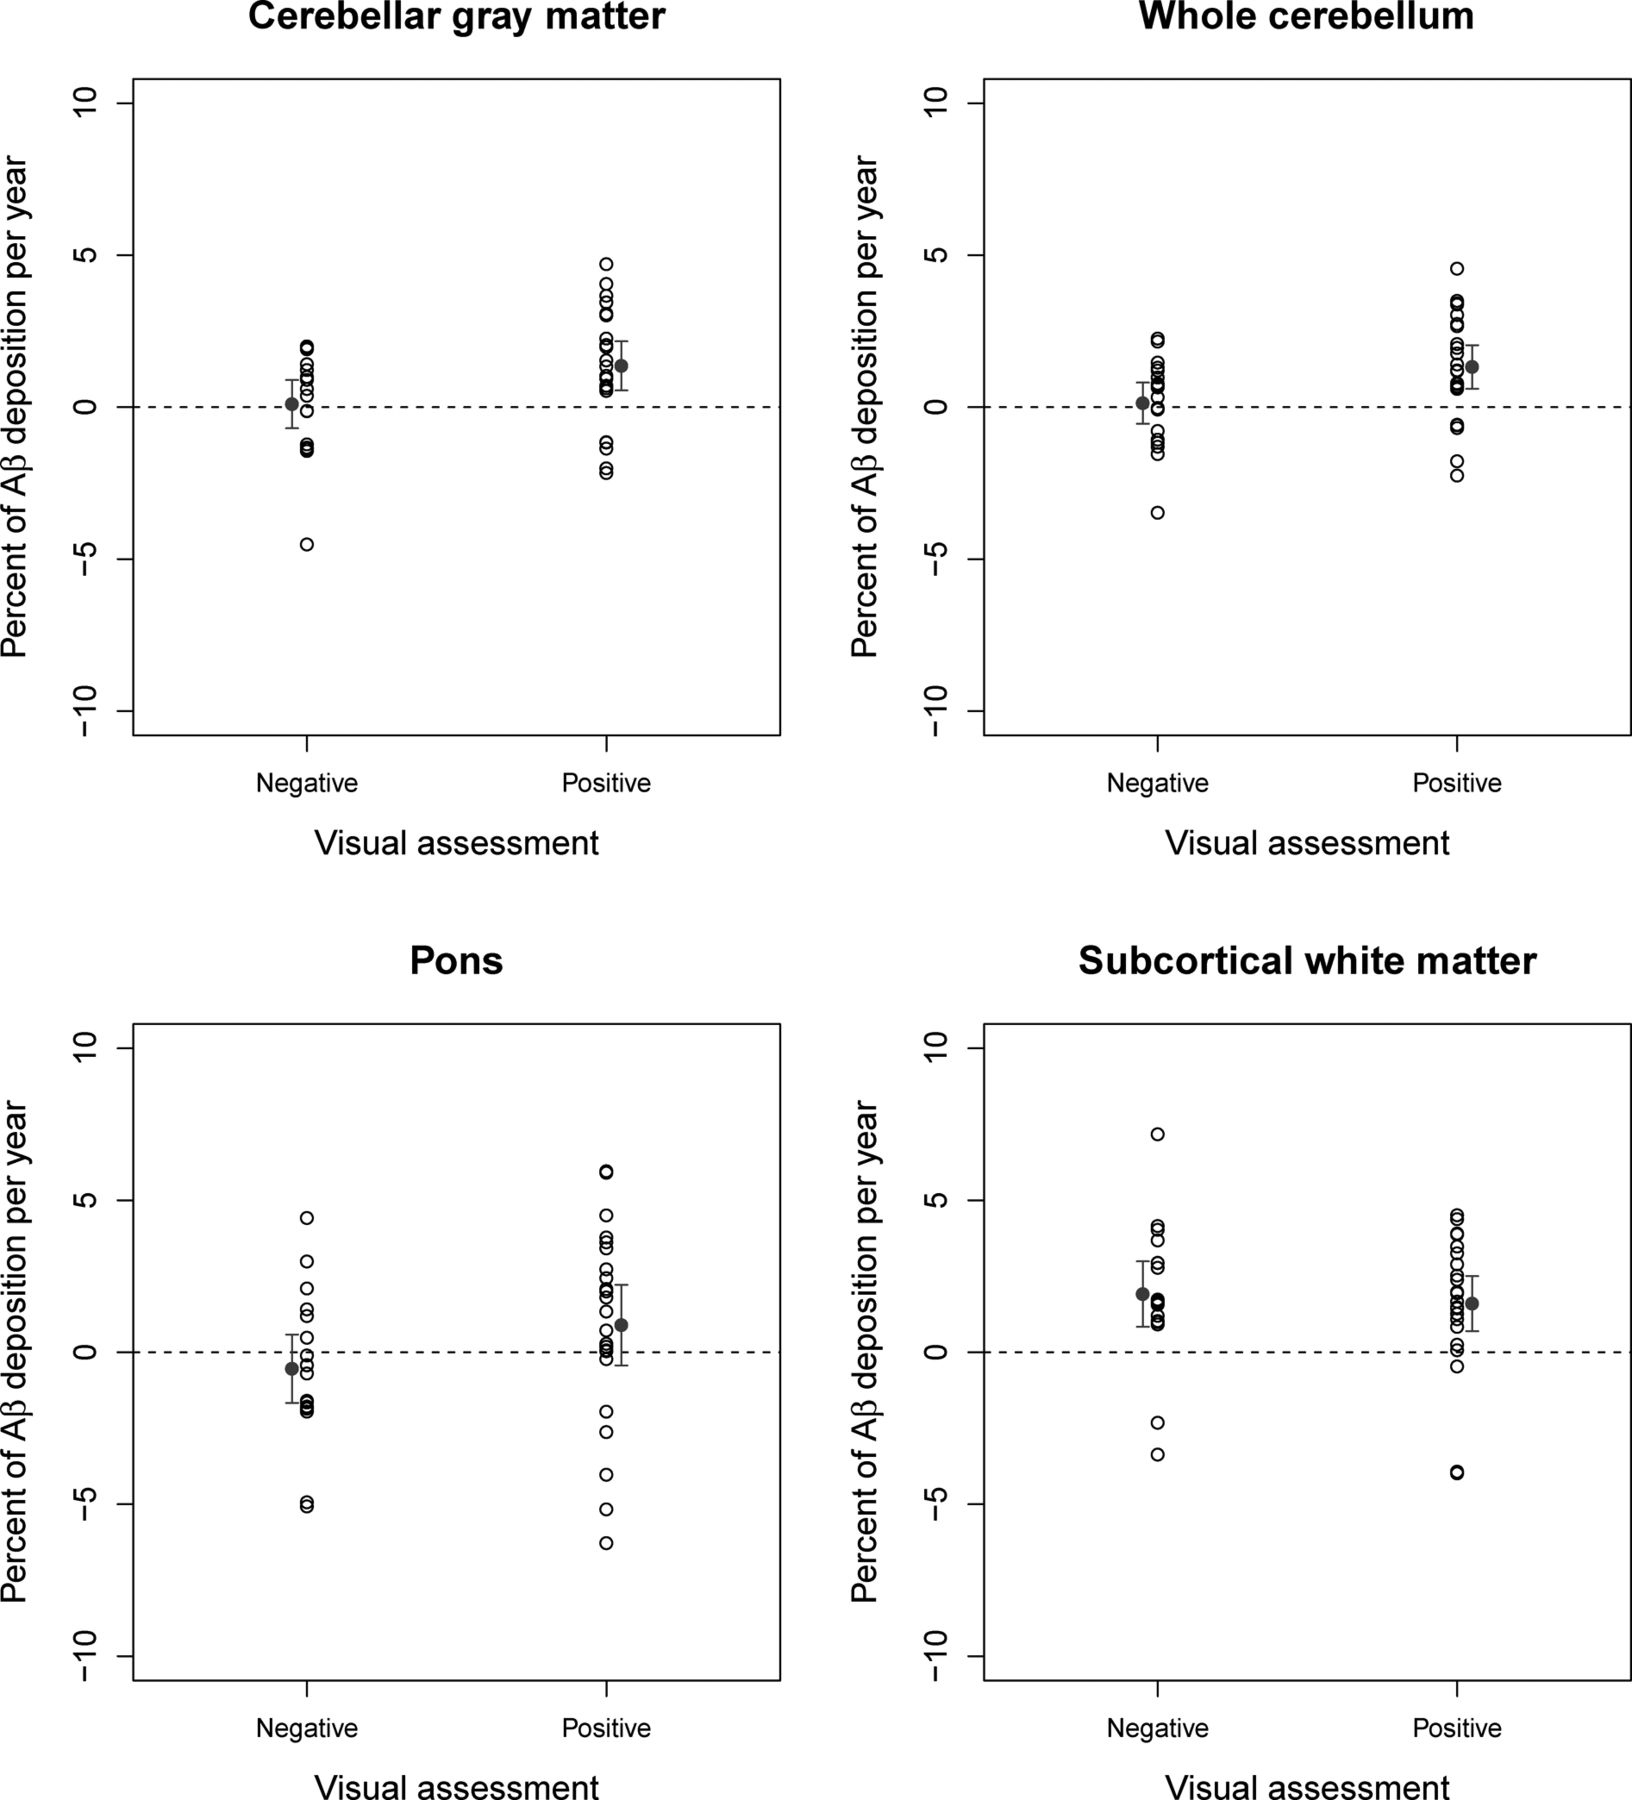
Using CGM and WCER as RRs, composite SUVR increase in positive scans (n = 23) was significantly larger than those in negative scans (n = 18) between baseline and 1 y (P = 0.04 [CGM] and 0.03 [WCER]) and between baseline and 2 y (n = 17 [Aβ−], n = 19 [Aβ+]; P = 0.02 [CGM] and 0.01 [WCER]) (Table 1; Fig. 3). When the pons was used as an RR, significant changes between positive and negative scans were detected only at 2 y (P = 0.46 [1 y] and 0.001 [2 y]), whereas use of the white matter showed no significant differences at either follow-up scan (P = 0.15 [1 y] and 0.16 [2 y]). Both CGM and WCER RRs enabled early detection of cortical SUVR changes between positive and negative scans that were consistent with the hypothesized change for patients with MCI. Average Aβ (mean ± SD) derived from composite SUVR in negative and positive scans was 0.10 ± 1.72 and 1.36 ± 1.98, respectively, using CGM as RR, and 0.13 ± 1.47 and 1.32 ± 1.75, respectively, using WCER. The effect size (Cohen’s d) of the percentage Aβ accumulation per year was higher for WCER (0.73) and CGM (0.67) than for pons (0.48) and SWM (−0.04). All RRs showed significant Aβdep in the group of subjects visually assessed as positive (Table 1; Fig. 3). The Aβdep in the subjects visually assessed as negative was not significantly different from zero for CGM, WCER, and pons but reached statistical significance for SWM (Table 1; Fig. 3).
Detection of Amyloid-β Changes (Composite SUVR)

Percentage amyloid-β deposition (and mean ± 95% confidence interval of the mean) per year for participants visually assessed as negative or positive measured with composite SUVRs using 4 different RRs.
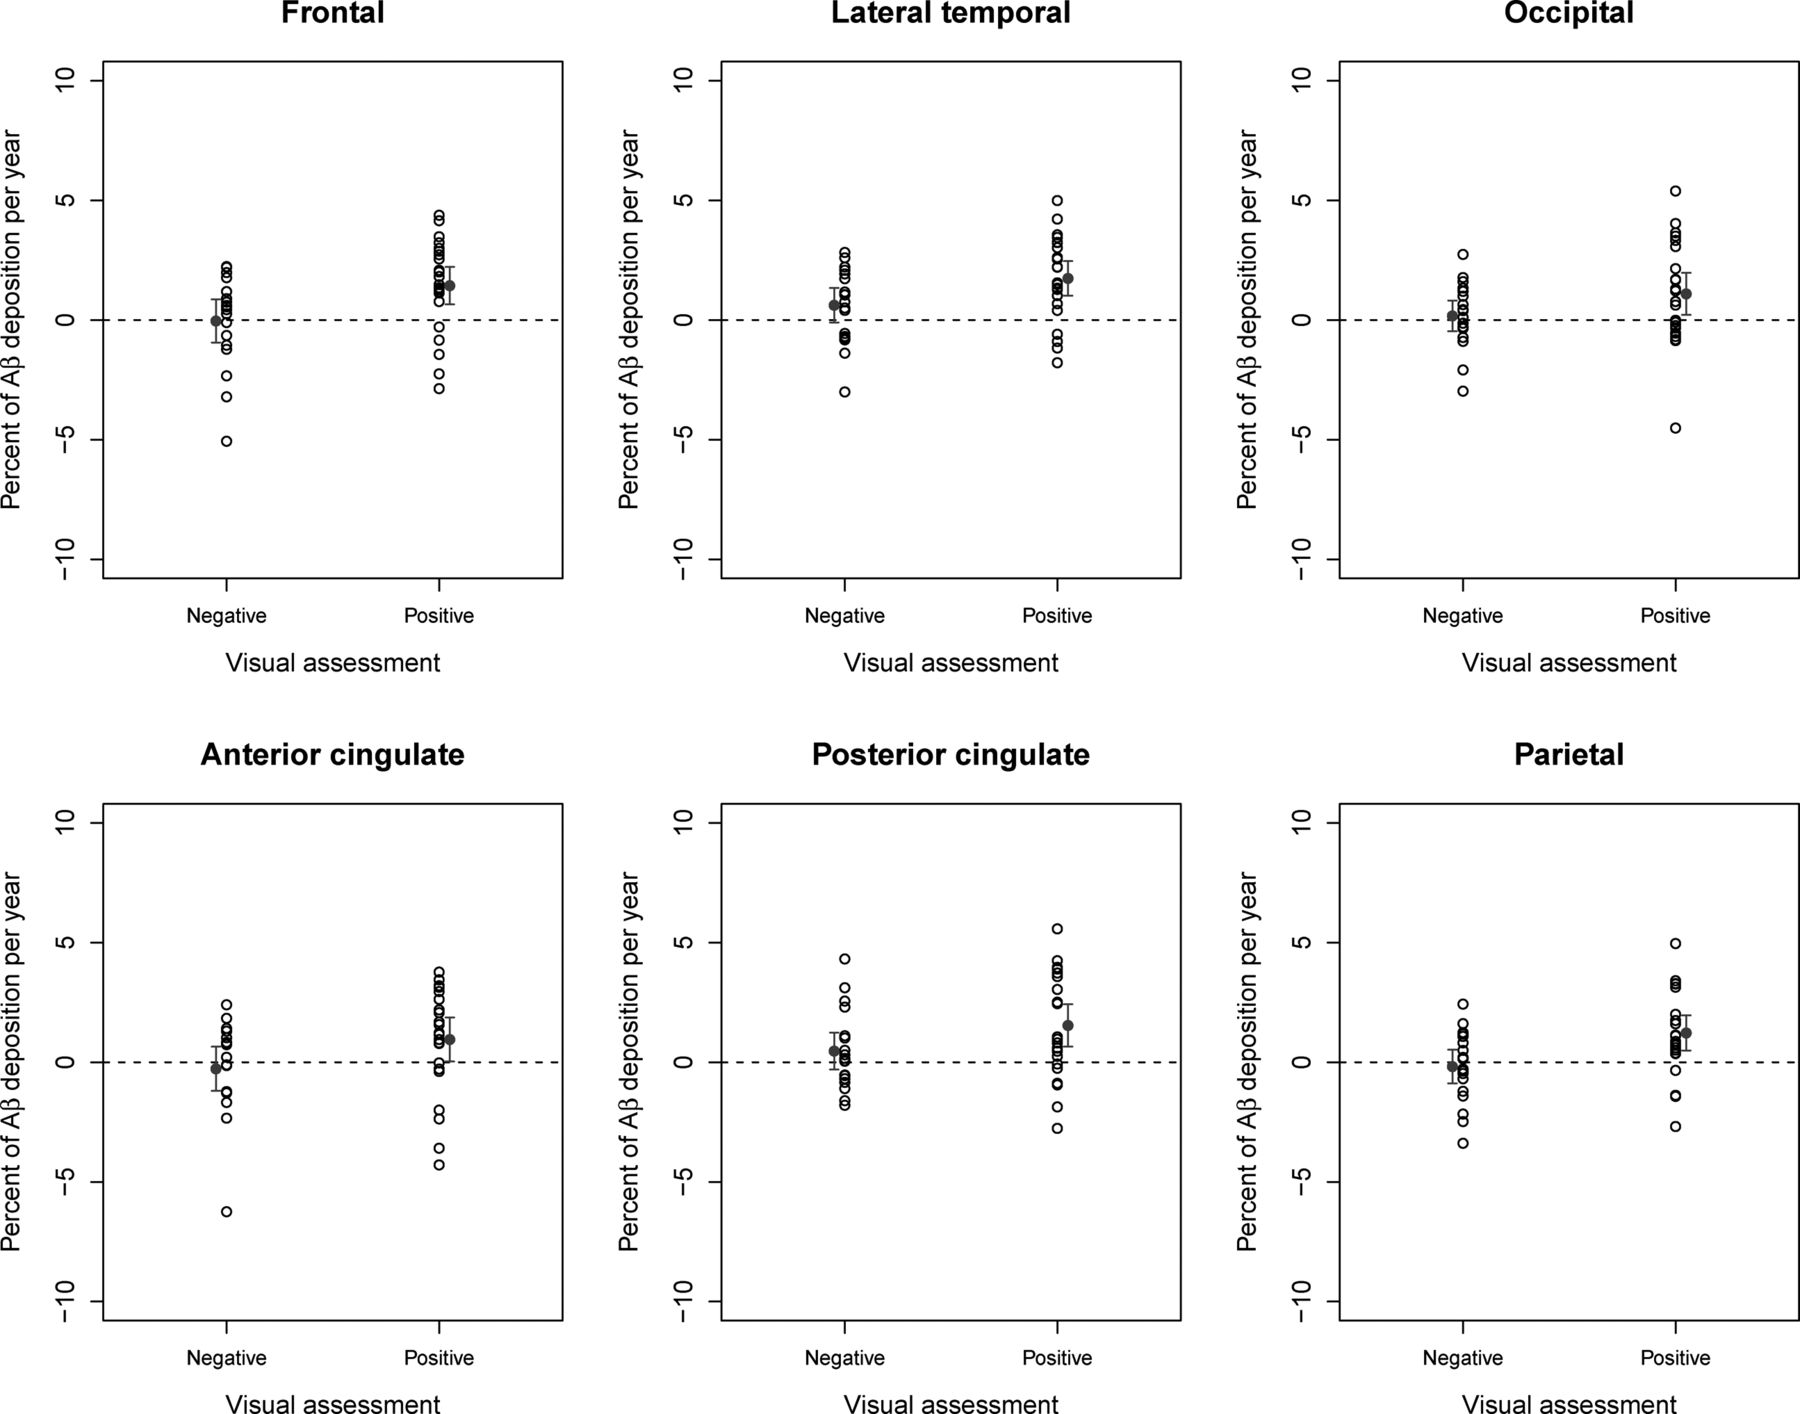
Regional SUVR
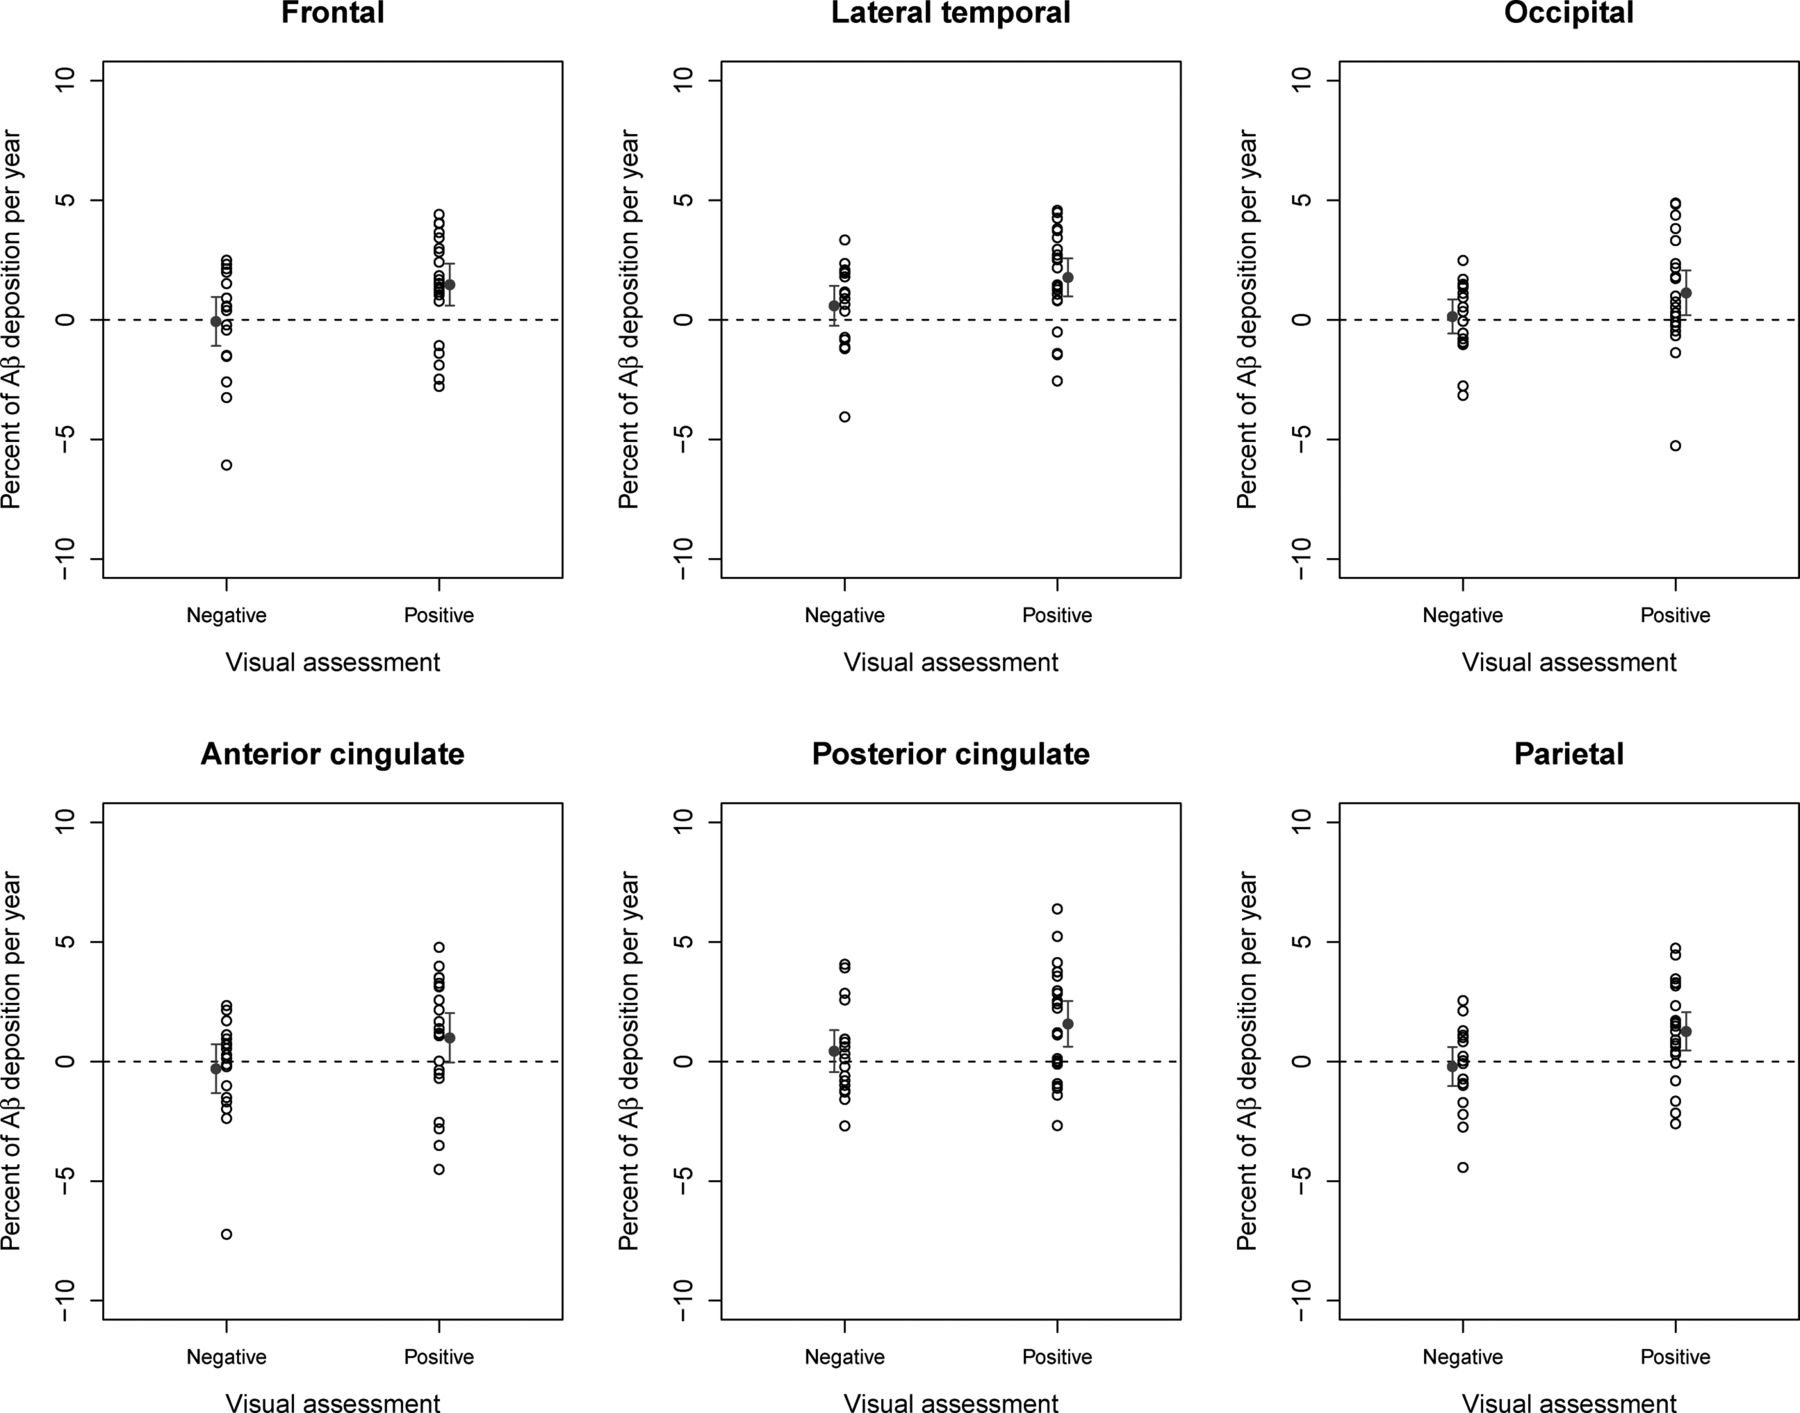
Regional Aβ in positive scans was significantly larger than that in negative scans in the frontal cortex, lateral temporal cortex, anterior cingulate, posterior cingulate, and parietal cortex (all P < 0.05) when WCER or CGM was used as the RR (Table 2, Fig. 4 for CGM; Table 3, Fig. 5 for WCER). Regional SUVR using WCER or CGM as the RR increased significantly (P < 0.05) between baseline and 1 y for the frontal cortex (P = 0.043 [WCER]; P = 0.049 [CGM]), anterior cingulate (P = 0.043 [WCER]; P = 0.048 [CGM]), and posterior cingulate (P = 0.003 [WCER]; P = 0.004 [CGM]) (Table 2, Fig. 4 for CGM; Table 3, Fig. 5 for WCER).
Regional Amyloid-β Change Detection Using CGM as RR

Percentage of amyloid-β deposition per year (and mean ± 95% confidence interval of the mean) for subjects visually assessed as negative and positive (RR: CGM).
Regional Amyloid-β Change Detection Using WCER as RR
Percentage of amyloid-β deposition per year (and mean ± 95% confidence interval of the mean) for subjects visually assessed as negative and positive (RR: WCER).
DISCUSSION
The results of this study suggest that the accurate selection of an appropriate RR is crucial for detection of subtle changes in longitudinal 18F-florbetaben PET analysis. The study also confirms the robustness of 18F-florbetaben quantification using CGM and WCER as RRs, because they allow earlier detection of Aβ change. These results are consistent with a previous study reporting that the highest SUV stability for 18F-florbetaben is achieved in the CGM (16), in contrast with other Aβ radioligands, for which SWM and pons have been reported as the most accurate RRs (11–15). This emphasizes the probable ligand-specific nature of the optimal RR.
Although the rate of Aβ deposition depends on the disease stage (26), the accumulation of Aβ per year measured in the present study using 18F-florbetaben (CGM, 1.36% ± 1.98%; WCER, 1.32% ± 1.75%) is similar to previously reported results for other Aβ radioligands. In a study with 18F-florbetapir, reported deposition was 1.1% ± 4.9% for CGM and 1.1 ± 4.0 for WCER in a sample of early MCI (13), with an overall range for 18F-florbetapir of 1%–2% reported in a second study (10). Deposition in a study with MCI subjects with 18F-flutemetamol was found to be 1.6% ± 3.3% (12).
Each of the RRs identified in our analysis has several advantages and disadvantages. CGM fulfils all the requirements for an RR in that it is free of Aβ and has nondisplaceable activity (free + nonspecific binding) and blood flow similar to the target region (6). CGM can, however, be affected by amyloid accumulation in late disease stages, but this effect is unlikely to happen in patients with MCI, such as those enrolled in the present study, or the clinically intended population for brain Aβ imaging. Indeed, the effect of cerebellar plaques in cortical 18F-florbetaben SUVRs appears to be negligible, even in advanced stages of AD with high cortical Aβ load (9). Another potential limitation of CGM, which is shared by the pons, is that it seems to be vulnerable to scatter and truncation as a result of its position close to the edge of the scanner field of view. CGM and pons are also small regions that tend to have a low number of counts and higher variability. Unlike CGM, the pons, together with WCER and SWM, are mainly white matter regions that do not fulfill the conditions for an RR. In the WCER, however, this seems to have limited impact, and WCER is a sensitive region for detection of Aβ changes. Although the use of SWM as the RR showed significant Aβ accumulation in the positive group, it did not allow detection of differences between negative and positive subjects because of the SUVR increase over time in the negative group. The reason for this low sensitivity is likely to be the different time course of the SUV in SWM with respect to the SUV in CGM, WCER, and pons, possibly caused by the different pathologies involved in the positive group (i.e., MCI subjects who converted to AD) and negative group (i.e., MCI subjects who progressed to progressive supranuclear palsy, temporal lobar degeneration, amyotrophic lateral sclerosis, or dementia with Lewy bodies). These results are in concordance with those of Villemagne et al. showing that the SWM region is not stable across diagnoses and Aβ status (16). Additionally, the SWM may be affected by white matter atrophy and vascular lesions, which are less likely to be found in the cerebellum and pons. SWM is also likely to be affected by spillover in regards to cortical activity (13).
One general limitation of all longitudinal measurements of Aβ accumulation over time is the lack of a standard of truth, such as postmortem histopathologic data, which is used in cross-sectional studies. In the present study, Aβ accumulation measured with 18F-florbetaben PET was compared between patients with MCI expected to remain stable over time (18F-florbetaben–negative at baseline) and those expected to increase Aβ accumulation (18F-florbetaben–positive at baseline). Although some 18F-florbetaben–negative patients may also accumulate Aβ and some positive patients may have reached a plateau and may not increase Aβ deposition further, it is unlikely that this biases our results in favor of a particular RR (27). Another potential issue is that ROIs were based on each participant’s baseline structural MRI scan. This may introduce the possibility that atrophy may have occurred, which could in turn result in over- or underestimation of change. The analysis described in this article was replicated in a subsample (n = 36) in which at least 1 follow-up MRI was available. The SUVR obtained using follow-up MR images showed an excellent correlation with SUVRs using only the baseline MR image (R2 > 0.988; composite region across RRs) and the conclusions did not differ, indicating the small impact of atrophy in this sample. Impact of atrophy and partial-volume correction is an important area of future investigation that may be important in some populations but may increase measurement variability (13,28).
As noted above, the findings of this analysis are specific to 18F-florbetaben SUVR and should therefore not be generalized to other amyloid PET tracers, or to other analysis methods (e.g., dynamic acquisitions and tracer kinetics). Dynamic acquisition may further reduce the variability, as shown for 11C-Pittsburgh compound B (29), but it is difficult to apply in routine clinical practice and beyond the scope of this study. Other sources of variability such as physiologic changes (e.g., blood flow), consistency of acquisition conditions (e.g., scan start time), reconstruction, and tracer quantification methods (e.g., distribution volume ratio, SUVR) that are also beyond the scope of this work warrant further investigation.
CONCLUSION
RR selection influences the reliable and early measurement of Aβ changes over time. Compared with SWM or pons, which do not fulfill the RR requirements and have limited sensitivity to detect Aβ changes, cerebellar RRs (CGM and WCER) are recommended for 18F-florbetaben PET because they are more sensitive to detect subtle Aβ accumulation.
DISCLOSURE
The trial was funded by Bayer Pharma AG, Berlin (Germany), and Piramal Imaging S.A., Matran (Switzerland). Santiago Bullich, Aleksandar Jovalekic, and Norman Koglin are employees of Piramal Imaging GmbH. Ana M. Catafau was an employee of Piramal Imaging GmbH until January 2016; she currently works as a freelance consultant on Clinical Molecular Imaging. Victor L. Villemagne is supported in part by NHMRC Research Fellowship 1046471 and has received speaker’s honoraria from Piramal Imaging, GE Healthcare, Avid Pharmaceuticals, AstraZeneca, and Hoffmann-La Roche and consulting fees for Novartis, Lundbeck, Abbvie, and Hoffmann-La Roche. Christopher C. Rowe has received research grants from Bayer Schering Pharma, Piramal Imaging, Avid Radiopharmaceuticals, Navidea, GE Healthcare, Astra Zeneca, and Biogen. Susan de Santi is an employee of Piramal Pharma Inc. No other potential conflict of interest relevant to this article was reported.
Acknowledgments
Medical writing support was provided by Dan Booth (Bioscript Medical, London, U.K.) and funded by Piramal Imaging S.A.
Footnotes
Published online Feb. 9, 2017.
- © 2017 by the Society of Nuclear Medicine and Molecular Imaging.
REFERENCES
- Received for publication November 17, 2016.
- Accepted for publication January 5, 2017.


Jump to section
Related Articles
Cited By...
- Examining real-world Alzheimers disease heterogeneity using neuroanatomical normative modelling
- Distinct and joint effects of low and high levels of A{beta} and tau deposition on cortical thickness
- Olfactory impairment is related to tau pathology and neuroinflammation in Alzheimers disease
- Validation of Noninvasive Tracer Kinetic Analysis of 18F-Florbetaben PET Using a Dual-Time-Window Acquisition Protocol