


Abstract
Hybrid PET myocardial perfusion imaging (MPI) with CT allows the incorporation of coronary artery calcium (CAC) into the clinical protocol. We aimed to determine whether the combined analysis of MPI and CAC could improve the diagnostic accuracy of PET MPI in detection of obstructive coronary artery disease (CAD). Methods: Consecutive patients (n = 152; mean age ± SD, 69 ± 12 y) without prior CAD, referred to 82Rb PET MPI followed by invasive coronary angiography performed within 14 days, were studied. Myocardial perfusion was quantified automatically for left anterior descending, left circumflex, and right coronary artery territories as an ischemic total perfusion deficit (ITPD) for 456 vessels. Global and per-vessel CAC Agatston scores were calculated. Obstructive CAD was defined as 50% or greater stenosis of the left main and 70% or greater stenosis in the left anterior descending, left circumflex, and right coronary arteries. Logistic regression and 10-fold cross validation were used to derive and validate the combined ITPD/logCAC (logarithm of coronary calcium) scores. Results: In the prediction of per-vessel obstructive CAD, the receiver-operating-characteristic area under the curve for combined per-vessel ITPD/logCAC score was higher, 0.85 (95% confidence interval [CI], 0.81–0.89), than standalone ITPD area under the curve, 0.81 (95% CI: 0.76–0.85), and logCAC score, 0.73 (95% CI, 0.68–0.78; P < 0.05). The integrated discrimination improvement of combined per-vessel ITPD/logCAC analysis was 0.07 (95% CI, 0.04–0.09; P < 0.0001), as compared with ITPD alone. Conclusion: Combined automatically derived per-vessel ITPD and logCAC score improves accuracy of 82Rb PET MPI for detection of obstructive CAD.
- hybrid cardiac positron emission tomography
- coronary calcium score
- detection of obstructive coronary artery disease
PET myocardial perfusion imaging (MPI) is a well-established noninvasive procedure for the evaluation and risk stratification of patients with coronary artery disease (CAD) (1–8). A principal advantage of hybrid PET combined with CT, compared with SPECT, is its potential ability to evaluate the coronary atherosclerotic burden as assessed by the coronary artery calcium (CAC) score during the PET scan. It is well known that many of the patients undergoing MPI have subclinical atherosclerosis, whereas at the same time a substantial proportion of patients may have a CAC score of 0 (9). Although the patients with abnormal MPI results can be defined as having CAD without CAC scan, the knowledge of the presence and extent of underlying coronary atherosclerosis could be useful in guiding therapeutic decisions especially in those with equivocal or mildly abnormal MPI studies. Moreover, CAC score is usually considered a global marker of atherosclerosis (10), and the regional CAC scores have been shown to improve the accuracy in detection of CAD (11). Ischemic total perfusion deficit (ITPD), which is a measure of hypoperfusion change between stress and rest in the whole ventricle (12), and CAC may be evaluated regionally, whereas the absolute quantitative measurements for both could be obtained readily by image analysis software for different vascular territories. In this work, we sought to test the hypothesis that the combination of regional ITPD (quantitative measure of the relative decrease in counts by vascular territory as compared with a normal database) along with regional and global CAC scores could enhance the overall diagnostic value of PET/CT in the detection of obstructive CAD.
MATERIALS AND METHODS
Patients
From consecutive patients undergoing 82Rb PET/CT MPI at Cedars Sinai Medical Center between January 2008 and September 2012 (n = 3,515), we excluded those with known CAD (myocardial infarction, percutaneous coronary intervention, or coronary bypass surgery [n = 1,416]), those with invasive coronary angiography greater than 6 mo of indexed PET MPI (n = 1,884), and those who had no CAC scan at the time of PET/CT imaging (n = 63). All selected patients (n = 152) had no cardiac events in the interval between MPI and invasive coronary angiography. Clinical and demographic data were collected during patient interviews before the scanning. All patients provided written informed consent for the use of their clinical and imaging data for research purposes. Pretest likelihood for having CAD was calculated as previously described (13).
Imaging and Analysis Protocols
A detailed description of PET MPI/CAC imaging protocols and perfusion deficit quantitation is provided in the supplemental materials (available at http://jnm.snmjournals.org). Briefly, the patients underwent same-day rest–stress gated 82Rb PET MPI and CAC imaging on a hybrid Biograph 64 PET/CT scanner (Siemens) (14). A 6-min rest electrocardiogram-gated acquisition was started immediately before the injection of 925–1,850 MBq (25–50 mCi) of 82Rb. Pharmacologic stress was performed using intravenous adenosine infusion (15) or regadenoson bolus (16) in 99 and 53 patients, respectively. No adjunctive exercise was performed. A 6-min stress electrocardiogram-gated acquisition was started immediately with the 82Rb injection of 925–1,850 MBq (25–50 mCi). CT attenuation-correction scans were acquired for both stress and rest studies. After completion of PET MPI, without moving patients from the scan table, CAC scanning was performed. CAC scanning consisted of 30–40 slices encompassing the heart from the carina to the apex, with a 30- to 35-cm field of view sufficient to include the entire heart as well as the ascending and descending thoracic aorta. Radiation doses from 82Rb PET and CAC ranged between 1.8 and 3.8 mSv and 0.7 and 1.2 mSv, respectively.
Left-ventricular segmentation for PET images was performed as recently described (17). For regional analysis, the myocardial wall division into vascular territories was performed according to the 17-segment model of the American Heart Association (18). An abnormality threshold of 3.0 mean absolute deviations (∼2.5 SDs) below the normalized counts of subjects in the normal reference database was applied to estimate the local extent of hypoperfusion in polar map coordinates. The perfusion defect extent was calculated as the percentage of the total surface area of the left ventricle for which test data were below the abnormality threshold. The quantitative perfusion variable used was total perfusion deficit (TPD), which reflects a combination of both defect severity and the extent of the defect as recently validated for 82Rb PET perfusion analysis (17). Per-vessel and global (per-patient) ITPD was defined as stress TPD − rest TPD, computed separately for each vascular territory—left anterior descending (LAD), left circumflex (LCX), and right coronary artery (RCA)—and for the entire left ventricle. Standard per-vessel Agatston CAC scores and global (per-patient) CAC scores were calculated (19). The CAC score for LAD was calculated as the sum of CAC score of the left main (LM) and LAD. The CAC score for LCX was the sum of CAC scores of LM and LCX. The same CAC categories of 0, 1–99, 100–399, and 400 or greater were used for per-patient and per-vessel measures of the severity of coronary calcifications.
Invasive Coronary Angiography
Clinically indicated invasive coronary angiography was performed according to standard clinical protocols (mean time difference, 14 ± 27 days; range, 0–170 days) after the PET/CT MPI. Coronary angiograms were visually analyzed and reported by 2 experienced interventional cardiologists. A stenosis of 50% or greater of luminal diameter of the LM or 70% or greater in the LAD, LCX, and RCA was considered to signify obstructive CAD. Diagonal lesions were considered as LAD, obtuse marginal and ramus arteries were considered as LCX, and posterior descending and posterolateral branches were considered as RCA.
Statistical Analysis
All continuous variables were described as mean ± SD. A student 2-sample t test and χ2 test were used to compare the differences in continuous and categoric variables, respectively. All tests of hypothesis were 2-sided, with a critical significance level of 5%. The natural logarithm of CAC score (logCAC) was used because of a wide range of the CAC scores. Multivariable logistic regression was used to develop an integrated (ITPD/logCAC) quantitative score predicting obstructive CAD. The first combined model used per-vessel ITPD/per-vessel logCAC, and the second model used per-vessel ITPD/per-patient logCAC. The prediction of obstructive CAD by the models was compared with the prediction by ITPD alone, as previously reported (17). A 10-fold cross-validation (CV) technique (20) that ensured that none of the image data creating the logistic regression model were used in the subsequent evaluation of the diagnostic performance of the same model was applied. To further clarify, in 10-fold CV each of the 10 models was built from approximately 90% of the 456 vessels—that is, from 410 vessels—and was then tested in the remaining 46 vessels. This procedure was repeated 10 times, each time leaving out a different 10% of the vessels for testing. Thus, for each procedure the specific model was tested only in unseen vessels, but there were 10 separate models. In our implementation of the 10-fold CV, the patients’ arteries were always clustered at the patient level; thus, in each-fold of the CV, there were no patient data for which one artery belonged to the training set and the other artery of the same patient to the validation set. The procedure was performed in this manner to ensure the real-life test of the application, in which the method is tested always in new patients and no single patient is used in the training and validation at the same time. 10-fold CV has been definitively shown to have the smaller bias for discriminant analysis than other methods, such as split-sample, as traditionally used (20), in which just 1 arbitrary division into test and validation groups is performed. Receiver-operating-characteristic area-under-the-curve (AUC) analysis (21) and integrated discrimination improvement (IDI) (22) were applied to evaluate the discrimination ability of relevant predictors. IDI was defined as the difference between the integral of test sensitivity (IS) over all possible cutoff values from the (0, 1) interval and the corresponding integral of 1 minus specificity (IP). Thus, the IDI is defined as follows: The subscript new in the above expression refers to the model with the new marker, and subscript old refers to the model without it. Because the integrals of sensitivity and 1 minus specificity over the (0, 1) interval can be seen as average sensitivity and 1 minus specificity, the IDI can be viewed as a difference between improvement in average sensitivity and any increase in average 1 minus specificity. Statistical analyses were performed with STATA software (version 12; Stata Corp LP) and SAS software (version 9.2; SAS Institute Inc.).
RESULTS
Overall Characteristics
Baseline clinical features of the studied population are presented in Table 1. Angiographically normal/nonsignificant CAD and significant single-, double-, and triple-vessel CAD were present in 41%, 32%, 14%, and 13% of patients, respectively. Ten patients (6.6%) had significant LM disease: 2 patients had a combination of LM with triple-vessel disease, 5 had LM with double-vessel disease, and 3-had LM with single vessel disease. None had isolated significant LM disease. Chronic total occlusion of LAD, LCX, and RCA or their branches in 8, 5, and 17 patients, respectively, was seen. The therapeutic decisions were based on primarily visual assessment of coronary lumen in 437 vessels, but in 19 visually borderline vessels, fractional flow reserve analysis was used. Among 89 patients with a 70% or greater stenosis, immediate revascularization was recommended in 76 (85%). In another 13 patients (15%) with total chronic occlusions and good collateral flow to the territories supplied by occluded vessels, conservative management was considered.
Patient Demographics and Clinical Characteristics
A normal MPI result was observed in 24 (16%) patients. Mild-moderate reversible defects (ITPD 1%–9%) and significant reversible defects (ITPD ≥ 10%) were seen in 69 (45%) and 49 (32%) patients, respectively. Fixed perfusion defects—mild-moderate (stress TPD = rest TPD < 10%) and significant (stress TPD = rest TPD ≥ 10%)—were seen only in 7 (5%) and 3 patients (2%), respectively. CAC scores of 0, 1–99, 100–399, and 400 or greater in 14 (9%), 19 (13%), 40 (26%), and 79 (52%) patients, respectively, were seen. Scintigraphic and CAC findings are summarized in Table 2. Distributions of per-vessel ITPD categories across different per-vessel CAC score categories are shown in Figure 1. Per-vessel analysis (n = 456) showed that the higher ITPD values were associated with the higher CAC (Fig. 1). Figure 2 illustrates the prevalence of obstructive CAD across different categories of ITPD and CAC. CAC, ITPD, and hypercholesterolemia were found to be independent predictors of obstructive CAD in multivariable analysis (Table 3).
Myocardial Perfusion Imaging and CAC Scan Findings
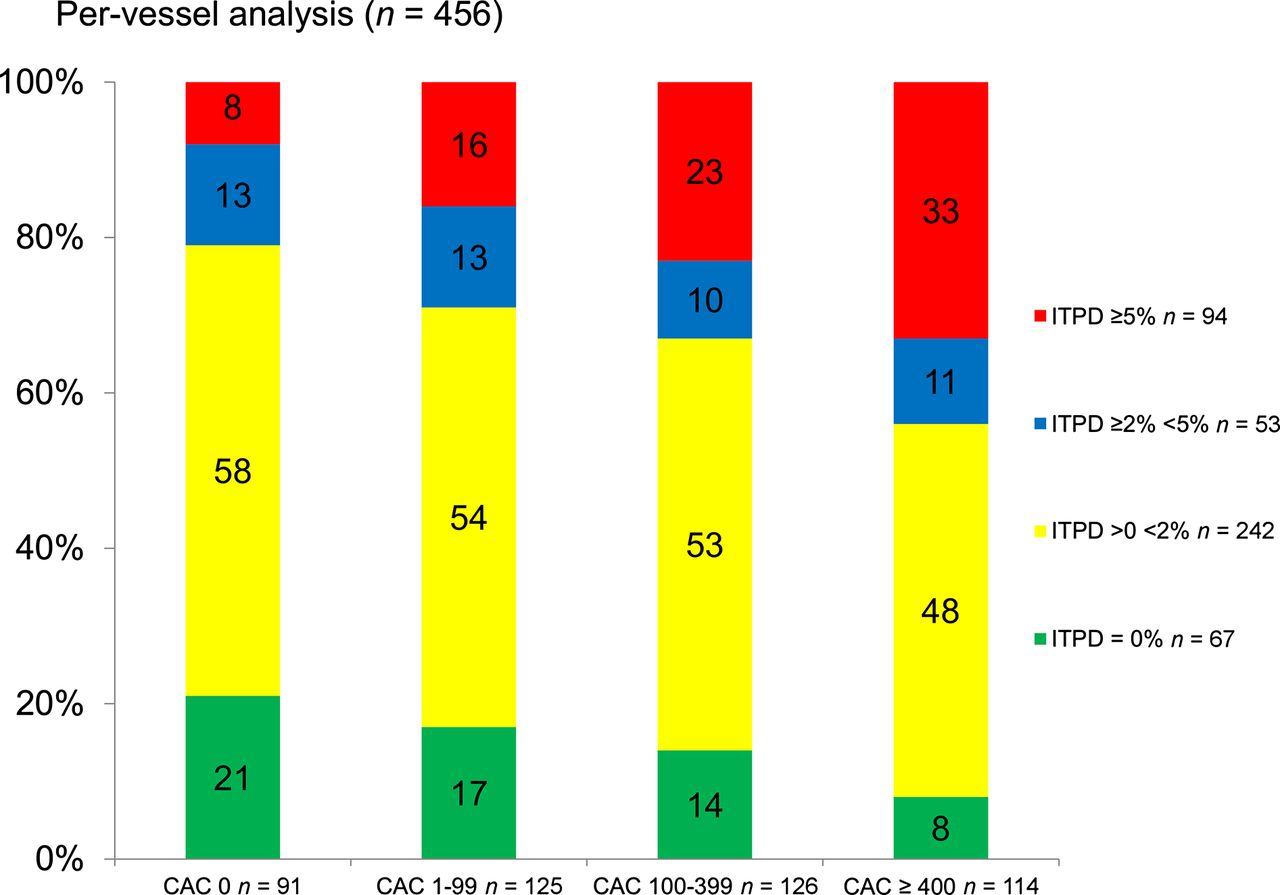
Distribution of ITPD categories according to CAC scores (per-vessel analysis, n = 456). Frequency of ITPD ≥ 5% (red bars) was significantly higher in vessels with CAC score > 400 than in others, P < 0.001. In contrast, frequency of ITPD = 0 (green bars) was significantly higher in vessels with CAC=0 scores than in others, P = 0.007.

Prevalence of obstructive CAD across ITPD and CAC categories (per-vessel analysis, n = 456). Among CAC = 0 vessels, risk of obstructive CAD was higher among ITPD ≥ 5% vessels (red bars) than others, P for trend = 0.0006. Moreover, among ITPD = 0 vessels (green bars), risk of obstructive CAD was still significantly higher in CAC ≥ 400 vessels than in others, P for trend 0.006.
Univariate and Multivariable Imaging and Clinical Predictors of Obstructive CAD (n = 152)
Diagnostic Performance of Combined Models
The logistic regression coefficients for combined models can be calculated using the following equations:
 Eq. 1
Eq. 1
 Eq. 2
Eq. 2
The logistic regression coefficients for both combined models are shown in Table 4. The Wald test was significant (P < 0.001) for both models. In the prediction of obstructive CAD, the AUC for per-vessel ITPD/logCAC combined scores (0.85; 95% confidence interval [CI], 0.81–0.89) was significantly higher than AUCs for per-vessel ITPD (0.81; 95% CI, 0.76–0.85) or per-vessel logCAC (0.73; 95% CI, 0.68–0.78; P = 0.02 and <0.0001, respectively) (Figs. 3A and 3B, respectively). Table 5 shows IDI analysis for the prediction of obstructive CAD using both combined models. The lower 95% CIs of IDI are greater than 0 for individual-vessel analysis (n = 152) and per-patient analysis (n = 152). The cutoff threshold for the combined score 0.312 has been determined to match the sensitivity of the previously established MPI diagnostic threshold for per-vessel ITPD (2%) (17). On the basis of the receiver-operating-characteristic curve in Figure 3A, such a threshold results in the overall specificity increase from 72% to 80%, P = 0.0009, maintaining the same sensitivity of 72% as achieved by ITPD alone. The clinical usefulness of combined analysis is shown in Supplemental Figures 4–6.
Odds Ratios and Coefficients for Logistic Regression Models from 10-Fold Cross Validation
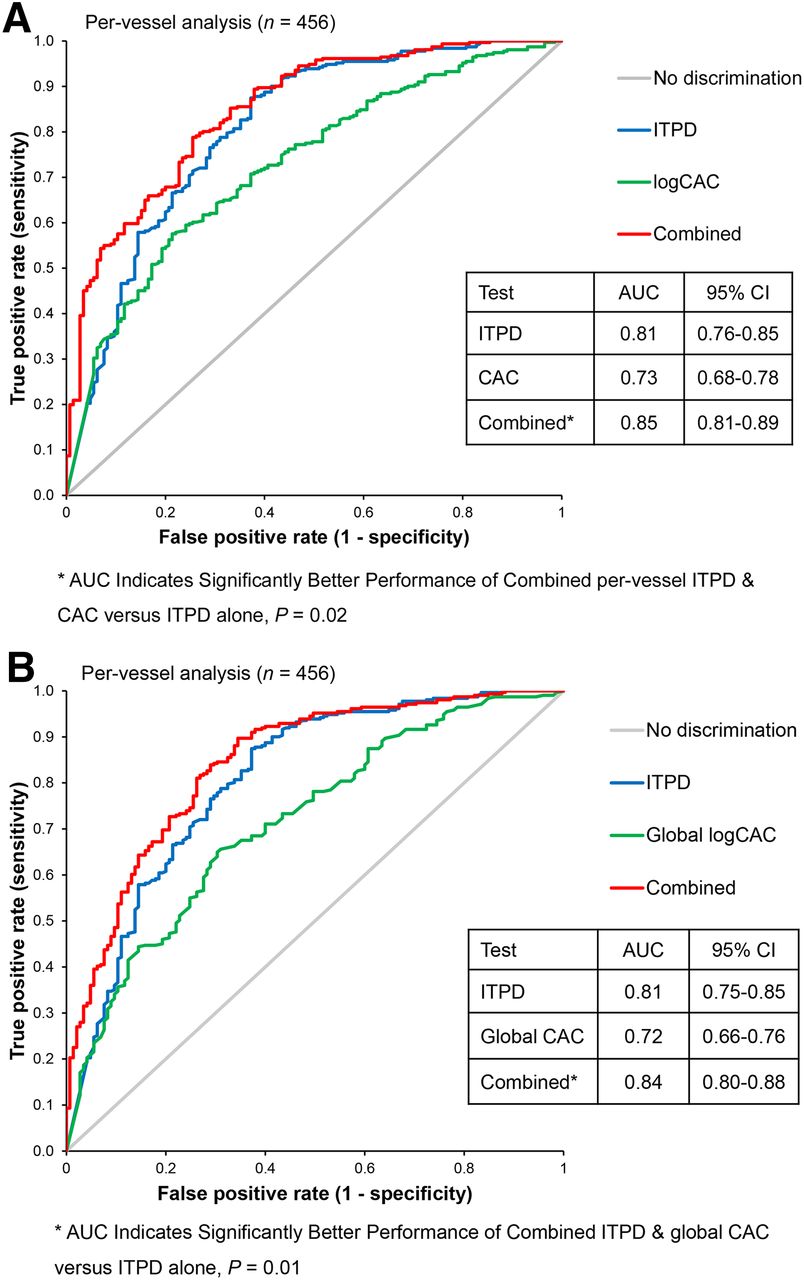
10-fold cross-validated receiver-operating-characteristic analysis comparing combined performance of ITPD/logCAC vs. ITPD in predicting of obstructive CAD. *AUC of combined analysis ITPD with per-vessel (A) and global (B) CAC.
IDI Analysis
DISCUSSION
We have shown that the computational integration of automatically derived perfusion parameters with a logCAC score obtained by hybrid 82Rb PET/CT MPI allows a more accurate per-vessel prediction of obstructive CAD than perfusion parameters alone. Prediction of obstructive CAD improved similarly when per-vessel and global logCAC scores were added to per-vessel ITPD. The similar additive value of per-vessel and per-patient logCAC scores demonstrates the nature of CAC findings, which likely reflect global risk for CAD rather than a presence of CAD in a given vessel, unlike MPI findings.
Several studies evaluated the additional value of CAC to MPI in the diagnosis of CAD. Schepis et al. (23) found that a CAC score of 709 or greater as a cutoff for detection of significant CAD was missed by MPI. Bybee et al. (6) studied patients without CAD and normal PET perfusion scans and found a high prevalence of significant subclinical atherosclerosis in 22% and 30% of patients who had CAC scores 100 or greater and 400 or greater, respectively. Thompson et al. (24) found 17% of normal perfusion studies were reclassified to have significant coronary atherosclerosis with a CAC score of 100 or greater. Ghadri et al. (25) demonstrated a high diagnostic value of CAC scores of 1,000 or greater for detecting CAD despite normal MPI. The additional prognostic value of CAC in adjunct to PET and SPECT MPI was also studied by Schenker et al. (9) and Chang et al. (26), demonstrating a stepwise increase in risk of adverse events with increasing CAC in patients with and without ischemia.
Although our study is in general agreement with the aforementioned studies, we derive a novel quantitative hybrid score. This score applies to any combination of ITPD and CAC values, in contrast to previously proposed CAC thresholds (6,25). Consequently, the developed technique allows us to demonstrate the increase in the overall diagnostic performance of hybrid PET/CAC in consecutive patients referred to clinically indicated MPI for suspected CAD. We analyzed perfusion abnormalities and CAC separately for every major artery, relating perfusion territory for calcium score in the artery supplying corresponding territory. In a related study, Schuijf et al. found a moderate correlation between regional CAC scores and regional ischemia (27).
Our work has important clinical implications. In patients with suspected CAD, the combined perfusion and CAC analysis improves the detection of obstructive CAD, supporting the routine application of such an approach. Because most current PET scanners have at least 16-slice CT, which is sufficient for CAC scoring, an additional CAC scan is easily accommodated by the hybrid 82Rb PET/CT MPI protocol (28). In addition, software techniques have been proposed for PET/CT, which can register a single CAC scan to PET for attenuation correction of stress and rest PET (29). Our study establishes the quantitative model for the optimal prediction of obstructive CAD, combining both PET and CAC scans. To facilitate a practical clinical deployment, this model (as given in Eqs. 1 and 2) could be integrated with the results obtained by the existing quantitative MPI software. Our study could not find a difference between the global and per-vessel CAC for this purpose. Larger studies may be needed to confirm the superiority of either approach. Incorporation of these hybrid scores to routine clinical reporting would allow objective improvement in the diagnoses provided by PET MPI.
The limitations of this study include that a small patient cohort from a single medical center was retrospectively analyzed, reflecting difficulties in obtaining correlating PET MPI, CAC, and invasive angiography data. Nevertheless, the use of 10-fold CV allowed for the construction of unbiased (20) logistic regression models trained on 90% fractions of the population. In addition, 10-fold CV allowed us to evaluate the model variability. As in many prior MPI studies with correlating invasive angiography, there is a referral bias (30). However, the goal of this study was to evaluate a relative improvement in the prediction of obstructive CAD with the combined approach, rather than to establish an absolute level of diagnostic accuracy of PET MPI. Quantitative coronary assessment was not performed in this study because angiography was visually estimated by 2 experienced interventional cardiologists. However, by our previous experience, these results are not significantly different from quantitatively established obstructive (≥70%) stenosis. In this study, we used ischemic measure (ITPD) and therefore did not consider the fixed defects; however, significant (>10%) fixed defects with unknown CAD were seen in only 3 patients (2%). Coronary flow reserve analysis was not used in our study, and it could potentially improve diagnostic accuracy; however, reduced flow reserve may be unrelated to obstructive CAD. This work did not study patients with known CAD and therefore we cannot conclude if such combined analysis would have additional clinical value in this group. We did not consider the use of effect of statins on the results, and in our population 50% of the patients had been taking statins. Larger studies may be needed in the future to consider the effect of statins on CAC findings (31).
CONCLUSION
Quantitative analysis integrating per-vessel ischemic TPD with logCAC scores synergistically improves the quantitative accuracy of 82Rb PET MPI for regional prediction of obstructive CAD.
DISCLOSURE
The costs of publication of this article were defrayed in part by the payment of page charges. Therefore, and solely to indicate this fact, this article is hereby marked “advertisement” in accordance with 18 USC section 1734. Cedars-Sinai Medical Center receives royalties for the quantitative assessment of function, perfusion, and viability, a portion of which is distributed to some of the authors of this manuscript. Yafim Brodov, MD, PhD, is a Michael Kogan Save a Heart Foundation fellow in nuclear cardiology and cardiac imaging, Cedars Sinai Medical Center, Los Angeles, California. No other potential conflict of interest relevant to this article was reported.
Acknowledgments
We thank Dr. Michael Pencina from Duke University for discussions regarding the AUC comparisons, for use of IDI, and for providing SAC macros for the IDI analysis.
Footnotes
Published online Jul. 9, 2015.
- © 2015 by the Society of Nuclear Medicine and Molecular Imaging, Inc.
REFERENCES
- Received for publication December 22, 2014.
- Accepted for publication June 2, 2015.


Jump to section
Related Articles
Cited By...
- Future of Radionuclide Myocardial Perfusion Imaging: Transitioning from SPECT to PET
- Deep Learning Coronary Artery Calcium Scores from SPECT/CT Attenuation Maps Improve Prediction of Major Adverse Cardiac Events
- Controversies in Diagnostic Imaging of Patients With Suspected Stable and Acute Chest Pain Syndromes
- Extending the Use of Coronary Calcium Scanning to Clinical Rather Than Just Screening Populations: Ready for Prime Time?