


Visual Abstract

Abstract
Low-dose ungated CT attenuation correction (CTAC) scans are commonly obtained with SPECT/CT myocardial perfusion imaging. Despite the characteristically low image quality of CTAC, deep learning (DL) can potentially quantify coronary artery calcium (CAC) from these scans in an automatic manner. We evaluated CAC quantification derived with a DL model, including correlation with expert annotations and associations with major adverse cardiovascular events (MACE). Methods: We trained a convolutional long short-term memory DL model to automatically quantify CAC on CTAC scans using 6,608 studies (2 centers) and evaluated the model in an external cohort of patients without known coronary artery disease (n = 2,271) obtained in a separate center. We assessed agreement between DL and expert annotated CAC scores. We also assessed associations between MACE (death, revascularization, myocardial infarction, or unstable angina) and CAC categories (0, 1–100, 101–400, or >400) for scores manually derived by experienced readers and scores obtained fully automatically by DL using multivariable Cox models (adjusted for age, sex, past medical history, perfusion, and ejection fraction) and net reclassification index. Results: In the external testing population, DL CAC was 0 in 908 patients (40.0%), 1–100 in 596 (26.2%), 100–400 in 354 (15.6%), and >400 in 413 (18.2%). Agreement in CAC category by DL CAC and expert annotation was excellent (linear weighted κ, 0.80), but DL CAC was obtained automatically in less than 2 s compared with about 2.5 min for expert CAC. DL CAC category was an independent risk factor for MACE with hazard ratios in comparison to a CAC of zero: CAC of 1–100 (2.20; 95% CI, 1.54–3.14; P < 0.001), CAC of 101–400 (4.58; 95% CI, 3.23–6.48; P < 0.001), and CAC of more than 400 (5.92; 95% CI, 4.27–8.22; P < 0.001). Overall, the net reclassification index was 0.494 for DL CAC, which was similar to expert annotated CAC (0.503). Conclusion: DL CAC from SPECT/CT attenuation maps agrees well with expert CAC annotations and provides a similar risk stratification but can be obtained automatically. DL CAC scores improved classification of a significant proportion of patients as compared with SPECT myocardial perfusion alone.
- cardiology
- artificial intelligence
- coronary artery calcification
- deep learning
- myocardial perfusion imaging
- risk stratification
SPECT myocardial perfusion imaging (MPI) is a well-established and widely used noninvasive imaging modality for the diagnosis and prognostication of coronary artery disease (1,2). SPECT MPI is frequently obtained with ungated, unenhanced CT attenuation correction (CTAC) scans. SPECT/CT scanners use a common bed to move the patient sequentially through both scanners (3), with some models incorporating solid-state detector arrays. CTAC allows correction for soft-tissue attenuation artifacts, leading to improved diagnostic accuracy of SPECT MPI (4).
However, CTAC scans can also potentially be used to provide an anatomic assessment that includes evaluation of coronary artery calcium (CAC) (5). CAC scores are a well-established marker of the extent of coronary atherosclerosis (6–8). Integrating CAC scores from dedicated, gated CT scans with assessments of myocardial perfusion can improve the diagnostic accuracy of SPECT (7) and PET MPI (9). Additionally, CAC from dedicated electrocardiography-gated scans can provide incremental risk stratification when combined with SPECT MPI perfusion (10,11). However, CTAC scans are typically acquired with lower radiation doses and without cardiac gating, leading to worse image quality and often thicker slices than for dedicated CAC scans, which may influence CAC scores (12). Although it is possible to quantify CAC manually from CTAC scans, this can be time-consuming and is not common. It is also possible to visually estimate CAC (13,14), but visual estimation is inherently subjective and requires experience to be performed accurately. Deep learning (DL) has been applied to image segmentation, including models for automated measures of CAC primarily from dedicated CAC scans. We developed a novel convolutional long short-term model (convLSTM) that integrates adjacent image slices, mimicking the clinical approach of scrolling between slices, to quantify CAC more efficiently. We evaluated the correlation between DL and expert annotated CAC scores in patients undergoing SPECT/CT MPI. We then evaluated the prognostic significance of DL and expert annotated CAC scores for major adverse cardiovascular events (MACE), including incremental risk stratification over traditional SPECT MPI parameters, in an external population imaged with solid-state SPECT/CT MPI.
MATERIALS AND METHODS
Study Population
Patients who underwent SPECT/CT MPI with CTAC at 1 of 2 centers (Yale and Cardiovascular Imaging Technologies) were used to train the convLSTM. Patients who underwent SPECT/CT MPI from a third center (University of Calgary) were used as an external testing cohort. Patients without CTAC were excluded. For external testing, patients with a history of coronary artery disease (n = 673), defined as previous myocardial infarction or revascularization with either percutaneous coronary intervention or coronary artery bypass grafting (15), were excluded. Details of the clinical data acquisition are provided in the supplemental materials (available at http://jnm.snmjournals.org). The study protocol complied with the Declaration of Helsinki. The study was approved by the institutional review board at all sites. To the extent allowed by data sharing agreements and institutional review board protocols, data and codes used in this article will be shared on written request.
Image Acquisition and Interpretation
Details of MPI and CTAC image acquisition and interpretation are available in the supplemental materials (16). Additional details on the training population are in Supplemental Table 1.
Two separate cohorts (each comprising 10% of the total number of available scans, n = 661) of the initial training cohort were sampled, with an equal number of cases in each CAC score category. One of those cohorts was held out as a validation set during training, and the model parameters were tuned to this set, whereas the second was held out for internal testing.
All the training, internal validation, internal testing, and external testing cases were annotated on-site by 2 expert readers with at least 5 years of experience in CAC scoring using dedicated quantitative software (Cardiac Suite; Cedars Sinai Medical Center). DL annotations were processed using a custom-developed pipeline, and both expert and DL annotated CAC scores were calculated according to the standard clinical algorithm (6), with additional details in the supplemental materials.
The DL and expert annotated cases were categorized on the basis of the CAC score (category 1, CAC score = 0; category 2, CAC score = 1–100; category 3, CAC score = 101–400; category 4, CAC score > 400).
Model Architecture
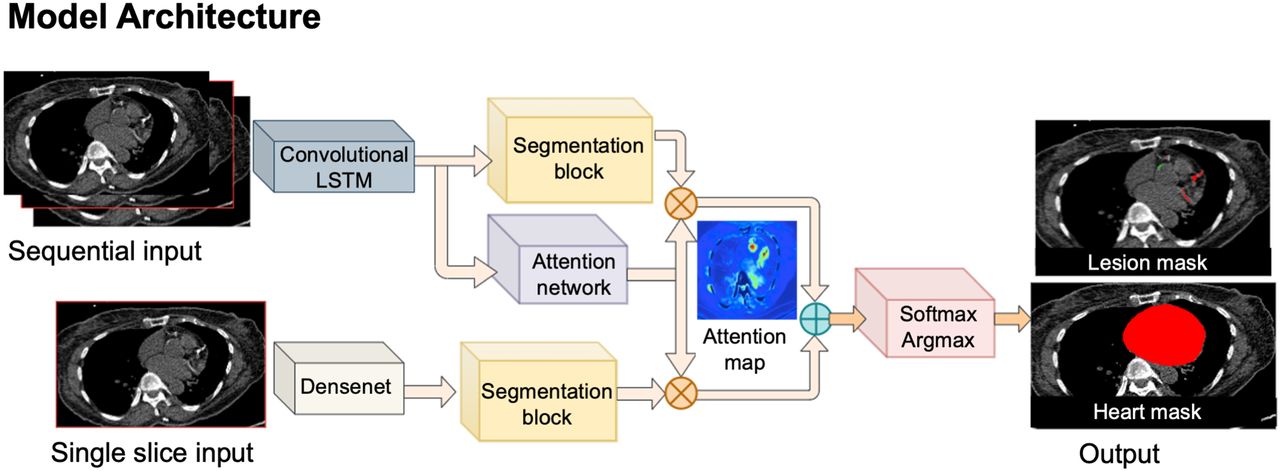
The model architecture is outlined in Figure 1. The model was built using PyTorch, version 3.7.4. We automatically segmented CAC from CTAC using a cascaded convLSTM system (17). This system consists of 2 networks, the first of which was trained for segmentation of the heart silhouette and the second of which was trained to segment the CAC. The heart convLSTM was trained on a subset of training data with expert reader annotations from QFAT software (18). A supervised learning regime was used for both segmentation networks. The heart mask was applied to the final CAC prediction to reduce any spurious bone overcalling or calcification in noncardiac regions. To imitate the physician approach of aggregating information from adjacent slices, 3 slices were provided to both networks as input (19). This network architecture was shown previously to have significantly reduced memory consumption and to have inference times almost 2 times faster, with similar accuracy to U-Net on a typical central processing unit (17). Case examples with expert and DL annotations are shown in Figure 2.

Outline of model architecture. ConvLSTM includes network trained to segment CAC, as well as second network for segmentation of heart, which limits CAC scoring. Softmax argmax function normalizes output of network to expected probabilities. Model identifies coronary calcium (red) and noncoronary calcium (green) within heart mask.

Examples of expert scores compared with DL CAC scores. Model identifies coronary calcium (red) and noncoronary calcium (green). In case 1, expert and DL annotations identified similar left circumflex CAC as well as ascending aorta calcium. No CAC was identified by either expert or DL scoring in case 2. In case 3, expert and DL annotations identified similar right coronary artery CAC as well as mitral annular calcification. BMI = body mass index.
Statistical Analysis
Details of the statistical analysis are provided in the supplemental materials (20,21). The Proposed Requirements for Cardiovascular Imaging–Related Machine Learning Evaluation (22) checklist is shown in Supplemental Table 2. Improvements in likelihood ratio χ2 and area under the receiver-operating-characteristic curve were also assessed.
RESULTS
Population Characteristics
In total, 6,608 patients were included in the training population. The external testing population included 2,271 patients, with population characteristics by DL CAC category shown in Table 1. On the basis of the DL model results, CAC was 0 in 908 (40.0%) patients, 1–100 in 596 (26.2%) patients, 100–400 in 354 (15.6%) patients, and more than 400 in 413 (18.2%) patients.
External Testing: Patient Characteristics According to CAC Category Determined by Deep-Learning Model
DL Versus Expert Annotated CAC
DL CAC was obtained fully automatically in less than 2 s per scan (time required to load the study, select slices, and annotate lesions for the entire CTAC volume). This compares with approximately 2.5 min for expert annotations, including the time required to load the study, review all slices, and annotate lesions on selected slices. Figure 3 outlines concordance between DL CAC and expert annotation CAC categories. The categorywise agreement (Fig. 3) between DL CAC and expert CAC was excellent (linear weighted κ, 0.80). There was also good pairwise correlation between DL CAC and expert annotated CAC as continuous measures (r2 = 0.693, P < 0.001; Supplemental Fig. 1). Summary of categorization by visual CAC estimation compared with DL and expert annotated CAC is shown in Supplemental Table 3. Review of discrepant cases is shown in the Supplemental Results and Supplemental Figure 2.

Concordance matrix between DL and expert CAC categories in external testing population.
Associations with MACE
During a median follow-up of 2.8 years (interquartile range, 1.7–4.1 years), 320 patients experienced at least 1 MACE. Supplemental Table 4 outlines the characteristics of patients who experienced MACE compared with those who did not. Patients who experienced MACE had a higher median CAC (178 vs. 11, P < 0.001) and were more likely to have a CAC of more than 400 (35.9% vs. 15.3%, P < 0.001). Patients who experienced MACE were also older (median, 70.7 vs. 66.1; P < 0.001) and more likely to have a history of diabetes (31.6% vs. 22.1%, P < 0.001) in addition to higher rates of other cardiovascular risk factors.
Increasing DL CAC and expert CAC category were associated with an increased risk of MACE (Fig. 4). Compared with patients with a DL CAC of 0, patients with scores of 1–100 (unadjusted hazard ratio [HR], 2.20; 95% CI, 1.54–3.14), 101–400 (unadjusted HR, 4.58; 95% CI, 3.23–6.48), and more than 400 (unadjusted HR, 5.92; 95% CI, 4.27–8.22) were at significantly increased risk of MACE. The risk was similar across categories of expert annotated CAC categories. Kaplan–Meier survival curves stratified by visually estimated CAC are shown in Supplemental Figure 3.

Kaplan–Meier survival curves for MACE. Increasing CAC category was associated with increasing risk of MACE for DL and expert annotated CAC scores on SPECT/CT attenuation maps.
Associations with MACE in the multivariable model are outlined in Table 2. DL CAC category continued to be associated with an increased risk of MACE in adjusted analyses for patients with a CAC of 1–100 (adjusted HR, 1.90; 95% CI, 1.32–2.73; P < 0.001), 101–400 (adjusted HR, 3.32; 95% CI, 2.29–4.81; P < 0.001), and more than 400 (adjusted HR, 3.58; 95% CI, 2.47–5.19; P < 0.001) compared with a CAC of 0. This risk stratification was similar to the risk associated with mild stress perfusion abnormalities (stress total perfusion deficit, 5%–10%; adjusted HR, 1.70; 95% CI, 1.19–2.44; P = 0.004) and moderate to severe stress perfusion abnormalities (stress total perfusion deficit, >10%; adjusted HR, 4.73; 95% CI, 3.02–7.46; P < 0.001). The risk associated with expert annotated CAC categories was similar to DL categories (CAC of 1–100: adjusted HR, 2.20; 95% CI, 1.52–3.19; P < 0.001; CAC of 101–400: adjusted HR, 3.57; 95% CI, 2.45–5.20; P < 0.001; CAC > 400: adjusted HR, 4.05; 95% CI, 2.78–5.90; P < 0.001).
Associations with MACE
Associations with primary outcome were similar if patients who underwent early revascularization were excluded (DL CAC of 1–100: adjusted HR, 2.00; 95% CI, 1.34–2.94; P = 0.001; DL CAC of 101–400: adjusted HR, 2.98; 95% CI, 1.97–4.49; P < 0.001; DL CAC > 400: adjusted HR, 3.07; 95% CI, 2.03–4.66; P < 0.001). Results were also similar for associations with death or myocardial infarction as well as associations with death (Supplemental Table 5).
Net Reclassification
We assessed patient reclassification with the addition of CAC categories to all other components of the multivariable model outlined in Table 2. The results of the net reclassification index (NRI) analysis are shown in Figure 5. Both DL CAC and expert annotated CAC significantly improved model fit and AUC (all P < 0.01) (Supplemental Table 6). DL CAC categories improved the risk classification of patients with events (event NRI, 0.230; 95% CI, 0.142–0.314), patients without events (nonevent NRI, 0.264; 95% CI, 0.204–0.309), and overall patient classification (overall NRI, 0.494; 95% CI, 0.363–0.607). Event, nonevent, and overall NRI were similar for both measures, as shown in Supplemental Table 6. Additionally, overall NRI was lower for visually estimated CAC (overall NRI, 0.409; 95% CI, 0.278–0.537).

Results of net-reclassification analysis. We assessed addition of CAC categories to full multivariable model outlined in Table 2.
DISCUSSION
We demonstrated that DL-derived CAC scores from CTAC imaging could be used to stratify the risk of MACE, with scores derived rapidly (∼2 s) in a completely automated manner. There was good agreement between CAC score categorization by DL and expert annotations, as evaluated in a large external population with different characteristics. Lastly, we demonstrated that DL CAC categories provided prognostic information additional to clinical information and quantitative assessment of perfusion and ventricular function, with improved classification of a quarter of patients who experienced MACE and a quarter of patients who did not experience MACE. DL CAC scores from CTAC could be used clinically to significantly improve risk stratification in patients undergoing SPECT/CT MPI, without the need for physician or technician time for manual annotation.
We demonstrated that the convLSTM network was able to quantify CAC from CTAC imaging, with excellent agreement with and risk stratification similar to expert annotated CAC. Importantly, the model was trained with data from 2 sites that have CTAC imaging protocols different from that of the external testing site. This training has not been commonly done in other studies reported in the existing literature, providing evidence that the convLSTM and associated DL CAC scores should be generalizable to a variety of acquisition protocols. We also previously demonstrated that this approach has faster inference times than a U-net model and therefore should not negatively impact clinical workflow. Another major strength of the current study is the large number of expert annotations performed on CTAC scans, which are not typically performed clinically. This strength allowed us to evaluate agreement with expert CAC scores more precisely and to robustly compare the risk stratification provided by the 2 measures, including their improvements for risk prediction of traditional SPECT/CT variables.
Several other approaches to CAC scoring with artificial intelligence have been applied previously (23–27). The agreement between CAC categories in our study (Cohen κ, 0.80) is similar to agreement demonstrated using dedicated electrocardiography-gated scans with other DL approaches (25). Isgum et al. developed a convolutional neural network that quantified CAC from low-dose CT scans obtained for lung cancer screening (26). When the same model was applied to patients undergoing PET MPI, the agreement between manual and automated scoring in CTAC was lower than in the present study (linear weighted κ, 0.70–0.74), and the testing was on a much smaller patient population (n = 133) (28). Sartoretti et al. also demonstrated good agreement between expert annotated and DL CAC scores in a cohort of 56 patients undergoing SPECT/CT MPI (29). Importantly, these methods demonstrate rates of agreement similar to what would be expected between 2 expert readers scoring CAC from low-dose CT scans (30). High noise levels and partial-volume effects impact the appearance of CAC lesions (12), leading to frequent false-negative physician interpretations, as evidenced by our finding that physician interpretation of the presence or absence of calcium was discrepant in about 10% of patients. Additionally, we identified cases in which DL annotations differed from expert annotations for calcium in coronary ostia versus adjacent aorta and for valvular calcification versus adjacent coronary arteries.
Although agreement between DL and expert CAC categories is important in itself, we demonstrated that significant improvements in risk stratification are possible with DL annotated CAC scores. We demonstrated that increasing DL CAC category was associated with an increased risk of MACE, similar to recent findings from Zeleznik et al. in both symptomatic and asymptomatic populations (27). However, in the present study we demonstrated that the risk associated with each category was similar to the corresponding category of expert annotated CAC. Additionally, both DL and expert reader CAC categories were significantly associated with MACE after correcting for relevant confounders, including age, sex, medical history, and SPECT MPI results. Lastly, we demonstrated that improvement in patient risk classification with DL CAC was similar to that achieved by expert annotated categories of CAC, with both being higher than is possible with subjective expert visual estimates. Importantly, visually estimated CAC was performed at the time of clinical reporting and was informed by clinical history and perfusion findings. Improved classification compared with expert visual estimate is particularly relevant since nuclear cardiology laboratories more frequently rely on this method for CAC classification given the time required for expert annotation. Although Dekker et al. found that DL CAC scores had an NRI of 0.13 in patients undergoing PET MPI (31), in our study about 1 in 4 patients who experienced MACE would have their risk correctly reclassified, with a similar proportion of patients who did not experience MACE correctly reclassified. Therefore, this approach could be applied to automatically improve risk classification in a substantial proportion of patients.
Our work adds to a growing body of literature supporting integration of CAC scores when interpreting MPI. Chang et al. demonstrated that quantitative CAC combined with SPECT MPI findings provided independent and complementary prognostic information among a cohort of 1,126 patients without prior coronary artery disease (11). Engbers et al. evaluated a combination of the Agatston CAC score and SPECT MPI in 4,897 symptomatic patients without prior coronary artery disease (10), demonstrating a stepwise increase in MACE with increasing CAC score among patients with both normal and abnormal perfusion. Visually estimated CAC (13) can also provide risk stratification in patients undergoing SPECT/CT MPI (14). However, in the present work we demonstrate that the improvement in risk classification is higher with DL CAC, which is rapidly and automatically derived from SPECT/CT attenuation maps.
Our study had a few important limitations. CT attenuation imaging was used clinically to visually assess coronary calcification, and knowledge of CAC can influence patient management (32). However, results were similar for associations with hard outcomes, and this bias would be expected to—if anything—decrease the associations between CAC and hard outcomes. Additionally, it is unknown whether associations with outcomes would differ significantly between CAC from dedicated gated studies and CAC from CT attenuation imaging; however, previous studies have demonstrated close agreement between the measures (33). We trained the convLSTM model using scans with acquisition parameters different from those for the external testing population. More precise quantification of CAC may be possible if the model is trained with similar data, but this also suggests that the model should be broadly generalizable. The model was trained to differentiate coronary from noncoronary calcifications using expert annotations. However, some lesions are challenging for expert readers to annotate (such as ostial calcium compared with adjacent aortic calcifications), and the DL model would also be expected to have difficulties with these areas. Although the DL method provides fully automated results, they will still need to be verified by a physician. The training population included patients with previous revascularization; however, we excluded patients with known coronary artery disease from the external testing population, and dedicated studies are needed to evaluate the model’s ability to differentiate CAC from coronary stents. Lastly, we were not able to ascertain cardiovascular mortality in this large, retrospective population.
CONCLUSION
DL CAC derived from SPECT/CT attenuation maps agrees well with expert CAC annotations. DL and expert annotated CAC are associated with MACE, but DL scores can be obtained automatically in a few seconds. DL CAC scores can be quantified automatically after SPECT/CT MPI, without impeding clinical workflow, to improve classification of a significant proportion of patients.
DISCLOSURE
This research was supported in part by grants R01HL089765 and R35HL161195 from the National Heart, Lung, and Blood Institute/National Institutes of Health (NHLBI/NIH) (principal investigator, Piotr Slomka). The content is solely the responsibility of the authors and does not necessarily represent the official views of the National Institutes of Health. Robert Miller has received consulting fees and research support from Pfizer. Daniel Berman, Piotr Slomka, and Paul Kavanagh participate in software royalties for QPS software at Cedars-Sinai Medical Center. Piotr Slomka has received research grant support from Siemens Medical Systems. Daniel Berman and Edward Miller have served as consultants for GE Healthcare. No other potential conflict of interest relevant to this article was reported.
KEY POINTS
QUESTION: Do CAC scores quantified automatically with a DL model provide risk stratification similar to that of expert annotated scores?
PERTINENT FINDINGS: In this retrospective multicenter study with dedicated training and external testing populations, DL CAC scores agreed well with expert annotated scores. DL and expert annotated CAC are associated with MACE, but DL scores can be obtained automatically in a few seconds.
IMPLICATIONS FOR PATIENT CARE: DL CAC scores could be used to improve risk prediction of a significant proportion of patients, without impeding clinical workflow.
Footnotes
Published online Oct. 7, 2022.
- © 2023 by the Society of Nuclear Medicine and Molecular Imaging.
REFERENCES
- Received for publication May 20, 2022.
- Revision received October 4, 2022.


