


Abstract
We aimed to prospectively observe cellular metabolism and proliferation in patients with non–small-cell lung cancer (NSCLC) during radical chemoradiation therapy using serial PET/CT with 18F-FDG and 3′-deoxy-3′-18F-fluorothymidine (18F-FLT). Methods: Twenty patients with stage I–III NSCLC and candidates for radical chemoradiation therapy (60 Gy in 30 fractions over 6 wk) were recruited. 18F-FDG and 18F-FLT PET/CT were performed at baseline and during therapy (weeks 2 and 4). Tumor response was assessed semiquantitatively and using visual response criteria. Results: The median and range for primary tumor volume (cm3) at baseline on 18F-FDG were 28 and 2–241, respectively, and on 18F-FLT 31 and 2–184, respectively. At week 2, 18F-FDG was 26 (range, 2–164), and 18F-FLT was 11 (range, 0–111). At week 4, 18F-FDG was 19 (1–147), and 18F-FLT was 7 (0–48). The median and range of maximum standardized uptake value (SUVmax) at baseline on 18F-FDG were 14 and 4–31, respectively, and on 18F-FLT 6 and 2–12, respectively. Week 2 18F-FDG median SUVmax was 10 (2–31), and 18F-FLT median SUVmax was 3 (1–15); week 4 18F-FDG median SUVmax was 10 (2–15), and 18F-FLT median SUVmax was 2 (2–9). There was fair agreement between visual tumor response on 18F-FDG and 18F-FLT during therapy (Cohen's unweighted κ statistic, 0.27 at week 2 and 0.355 at week 4). Cerebral metastases were detected on 1 baseline 18F-FLT scan, resulting in palliative management. Progressive disease was detected on week 2 scans in 3 patients, resulting in changes to radiation therapy (2 patients) and treatment intent (1 patient). Conclusion: This study demonstrates that 18F-FLT PET/CT is a more sensitive tracer of early treatment response than 18F-FDG PET/CT. The ability of these tracers to detect distinct biologic processes may lead to their use as biomarkers for personalized radiation therapy and prognosis in the future.
- FDG: 18F-fluorodeoxyglucose
- FLT: 18F-fluorodeoxythymidine
- non-small cell lung cancer
- positron emission tomography
- radiation therapy
Hybrid PET/CT represents a major advance in imaging non–small cell lung cancer (NSCLC). 18F-FDG PET/CT fulfills key roles in disease diagnosis and staging, patient selection, and target delineation for radiation therapy (RT) (1,2). RT is a major treatment modality for NSCLC in patients with early-stage disease who are unsuitable surgical candidates and in patients presenting with locoregionally advanced disease. Radical RT schedules typically involve the delivery of 60–70 Gy in 6–7 wk. After the completion of radical treatment, powerful prognostic information has been reported when 18F-FDG PET/CT is used for tumor response assessment (3,4).
Although PET/CT is routinely used for pre- and posttreatment imaging, it is not routinely undertaken during the course of therapy. Because molecular changes usually precede the anatomic changes visualized on CT, 18F-FDG PET/CT is a promising modality for interim response assessment during therapy. Changes in 18F-FDG uptake may reflect alterations in the tumor microenvironment (5,6) and could facilitate individualized biologically adapted therapy (5,7–9). However, the specificity of 18F-FDG PET may reduce in the presence of 18F-FDG–avid radiation-induced inflammation in tumor and adjacent organs (4). Information additional and complementary to 18F-FDG may be obtained using the thymidine analog 3′-deoxy-3′-18F-fluorothymidine (18F-FLT) to study tumor cell proliferation. Thymidine incorporation into DNA is considered a gold standard measure of proliferation, and 18F-FLT uptake closely reflects tumor cell proliferation (10). 18F-FLT PET/CT could therefore be a valuable marker of tumor response to antiproliferative treatments including RT.
It was initially unknown whether 18F-FLT tumor uptake could be visualized during chemo-RT. We tested this hypothesis in a pilot study using serial 18F-FLT PET/CT scans in 5 patients with NSCLC. The study demonstrated that 18F-FLT uptake could be visualized during chemo-RT and that the intensity of tracer uptake reduced with increasing radiation dose (11). These findings informed the design of the phase-2 study presented here.
The primary objective of the current study was to observe the metabolic and proliferative response of NSCLC during definitive chemo-RT using sequential multimodality imaging with 18F-FDG and 18F-FLT. We hypothesized that 18F-FLT uptake is a more sensitive tracer of treatment effect than 18F-FDG. The sample size was chosen to allow us to detect clinically relevant differences in response rates between the 2 modalities but was not intended to definitively evaluate potential differences in outcomes between different response categories. Although preliminary survival results are given here, the prognostic significance of interim imaging with 18F-FDG and 18F-FLT PET will be definitively investigated in a larger study with longer follow-up.
MATERIALS AND METHODS
The Institutional Review Board approved the study, and eligible patients provided written informed consent, had stage I–IIIB (without malignant pleural effusion), histologically or cytologically proven NSCLC, and an Eastern Cooperative Oncology Group performance status of 0–1. Standard staging investigations included a baseline 18F-FDG PET/CT scan, which excluded the cranium because the high-glucose utilization by the normal cerebral cortex can mask brain tumors. After staging, all patients were discussed by a multidisciplinary tumor board and considered suitable candidates for radical chemo-RT. Patients with previous thoracic RT or a complete macroscopic tumor excision were excluded. Approval was granted by the Australian Therapeutic Goods Administration for 18F-FLT use.
Patients received our current clinical protocol including 3-dimensional conformal RT (60 Gy in 30 fractions over 6 wk) with concomitant chemotherapy (either weekly carboplatin [area under curve, 2 intravenously] and paclitaxel [45 mg/m2 intravenously] or cisplatin [50 mg/m2 intravenously] on days 1, 8, 29, and 36 and etoposide [50 mg/m2 intravenously] during weeks 1 and 5). The baseline 18F-FDG PET/CT was exported to Focal (CMS Inc.) for RT target delineation and planning. A radiation oncologist contoured all gross disease using the combined 18F-FDG PET/CT data (12). A 15-mm expansion was applied to the gross tumor volumes (GTVs) to generate the planning target volume. 18F-FLT PET/CT data did not influence RT volumes. Investigational scans were not intended to influence therapy unless a clinically significant change was observed that required further investigation.
At baseline, patients underwent a routine 18F-FDG PET/CT scan (18F-FDG0: disease staging and RT planning) and an 18F-FLT PET/CT scan (18F-FLT0). Week 2 scans (18F-FDGwk2 and 18F-FLTwk2: 14 Gy ± 2 Gy) and week 4 scans (18F-FDGwk4 and 18F-FLTwk4: 38 Gy ± 4 Gy) were intended to explore initial and ongoing tumor response, respectively. We hypothesized that week 2 scans could reflect early tumor response and that week 4 18F-FLT uptake could reflect accelerated repopulation.
Images were acquired on an integrated PET/CT scanner (STE [GE Healthcare] or Biograph [Siemens Medical Solutions]). Patients fasted for 6 h or longer before 18F-FDG. Patients were weighed, intravenously injected with either 4.2 MBq/kg for 18F-FDG or 3.7 MBq/kg for 18F-FLT, and rested before scanning. Patient positioning followed our previously reported method (11). Baseline emission scans were initiated 60 min after injection, and all subsequent scans were scheduled according to the baseline uptake time for each tracer (±5 min).
A cancer imaging specialist reported all scans using Xeleris (GE Healthcare). Scans were discussed weekly at a multidisciplinary meeting. Therapeutic tumor response was assessed locally (within RT fields) and globally (whole patient). Metabolic response was scored using the following 18F-FDG visual response criteria: complete metabolic response (CMR), partial metabolic response (PMR), stable metabolic disease (SMD), and progressive metabolic disease (PMD) (4). These criteria were used to score the proliferative tumor response on 18F-FLT: complete proliferative response (CPR), partial proliferative response (PPR), stable proliferative disease (SPD), and progressive proliferative disease (PPD).
Physiologic tumor characteristics were determined by a single observer using TrueD (Siemens Medical Solutions). A visually adapted threshold-based contour was used to delineate the 18F-FDG– and 18F-FLT–avid tumor uptake. An initial search volume with a starting and standardized uptake value (SUV) threshold of 2.5 for 18F-FDG and 1.5 for 18F-FLT was applied. These approximate the mean SUV (SUVmean) of the liver and spleen, respectively, in healthy individuals and represent the reference tissues for qualitative reporting. The cancer imaging specialist then adapted the resultant isocontour to ensure that the 18F-FDG– and 18F-FLT–avid tumor uptake was contoured on the basis of his best clinical judgment. Manual corrections were made to exclude any autocontoured adjacent normal tissues with physiologic tracer uptake, for example, myocardium with 18F-FDG and bone marrow with 18F-FLT. When this method was used, at baseline, week 2, and week 4 the mean 18F-FDG threshold ± SD was 2.7 ± 0.4, 2.7 ± 0.5, and 2.6 ± 0.7, respectively, and the18F-FLT threshold was 1.9 ± 0.5, 1.6 ± 0.6, and 1.4 ± 0.61, respectively. All scans were analyzed at the completion of therapy in an unmasked manner, by specialists with access to all clinical and imaging information.
GTV classified the primary tumor. GTV1 and GTV2 classified the closest and second closest regional lymph node stations to the primary tumor, respectively. Treatment response was semiquantitatively assessed using maximum SUV (SUVmax) and SUVmean, percentage injected dose (%ID), and the volume of tracer-avid disease or molecular tumor volume.
Patient baseline and disease stage characteristics as well as primary tumor and nodal characteristics at all time points were summarized descriptively: median and range for continuous variables and frequencies and percentages for categoric variables. Differences between the 2 tracers in terms of GTV, SUVmax, and SUVmean at each time point were assessed using the nonparametric Wilcoxon signed-rank test. The proportion of patients with uptake detected in the primary tumor and each node was estimated for each tracer at each of the 3 time points, with associated exact 95% confidence intervals (CIs). Cohen’s unweighted κ statistic was used to investigate agreement between metabolic and proliferative tumor response at weeks 2 and 4. R software (version 2.11; R Foundation for Statistical Computing) was used for all statistical analyses.
A preliminary analysis of overall survival and time to distant progression were recorded to compare overall survival and time to distant progression in patients achieving a CMR, CPR, PMR, or PPR at the second and fourth week interim time points and those not achieving these responses at the same time points. Progression within the treatment volume was not evaluated in this analysis.
RESULTS
Twenty-two patients were enrolled between March 2009 and April 2010. The tenth and twentieth patients withdrew from the study for personal reasons. Characteristics of the remaining 20 patients are summarized in Table 1. For the 18 patients who underwent both baseline scans (2 patients did not attend 18F-FLT0), the median and range time between 18F-FDG0 and 18F-FLT0 were 12 d and 3–34, respectively, and between 18F-FLT0 and RT commencement they were 5 d and 1–15, respectively. All of the 19 (95%) patients eligible to proceed with radical chemo-RT underwent week 2 18F-FDGwk2 and 18F-FLTwk2 scans. One patient did not undergo week 4 scans because of a transient ischemic attack that required admission and management at an external hospital. A further patient did not attend the 18F-FLTwk4 scan. Therefore, 18 (90%) patients underwent 18F-FDGwk4, and 17 (85%) patients underwent 18F-FLTwk4. Mean tracer uptake times ± SD (min) were 83 ± 16, 87 ± 17, and 83 ± 14 for the 18F-FDG series and 71 ± 7, 70 ± 6, and 69 ± 9 for the 18F-FLT series. All scans for a given patient and tracer were obtained on the same scanner, except for 3 patients for whom the baseline 18F-FDG0 scan was obtained on the Siemens Biograph, and all subsequent scans were acquired on the STE.
Patient Characteristics
Disease Stage at Baseline
There was complete agreement between 18F-FDG0 and 18F-FLT0 for all disease stage assessments in 17 (94%) of the 18 patients who underwent both scans. The other patient was assigned T2N2M0 on the 18F-FDG0 and upstaged to T2N2M1 by the 18F-FLT0 because of the detection of cerebral metastases (Supplemental Fig. 3; supplemental materials are available at http://jnm.snmjournals.org). Locoregional progression was also evident on 18F-FLT0; however, this did not affect the T or N categories. The baseline TNM disease stages for all patients are shown in Table 1.
Primary Tumor (GTV) Characteristics
At baseline, all PET-positive primary lesions were detected by both tracers, and these volumes were comparable (Fig. 1). The molecular tumor volume (cm3) of tracer uptake on 18F-FDG0 and on 18F-FLT0 was similar; the median difference (18F-FDG0 – 18F-FLT0) was 2.3 cm3 (range, −7.7 to 57 [n = 17], P = 0.08). The 18F-FDGwk2 GTV was larger than the corresponding 18F-FLTwk2 GTV for all patients (median difference, 9.0 cm3; range, 0.5–76 [n = 18], P < 0.001). This discrepancy was maintained at week 4 in most patients with detectable tracer uptake (median difference, 8.7 cm3; range, −7.5 to 99 [n = 16], P = 0.005). The intensity of tracer uptake was consistently higher for 18F-FDG than 18F-FLT at every time point. The median difference in SUVmax (18F-FDG – 18F-FLT) at baseline, week 2, and week 4 was 9.3 (range, 3.6–19), 7.4 (1.5–27), and 6.7 (1.0–13), respectively; these differences were all highly statistically significant (P < 0.001). The SUVmean and percentage injected dose measures were consistent with those of SUVmax (results not shown).
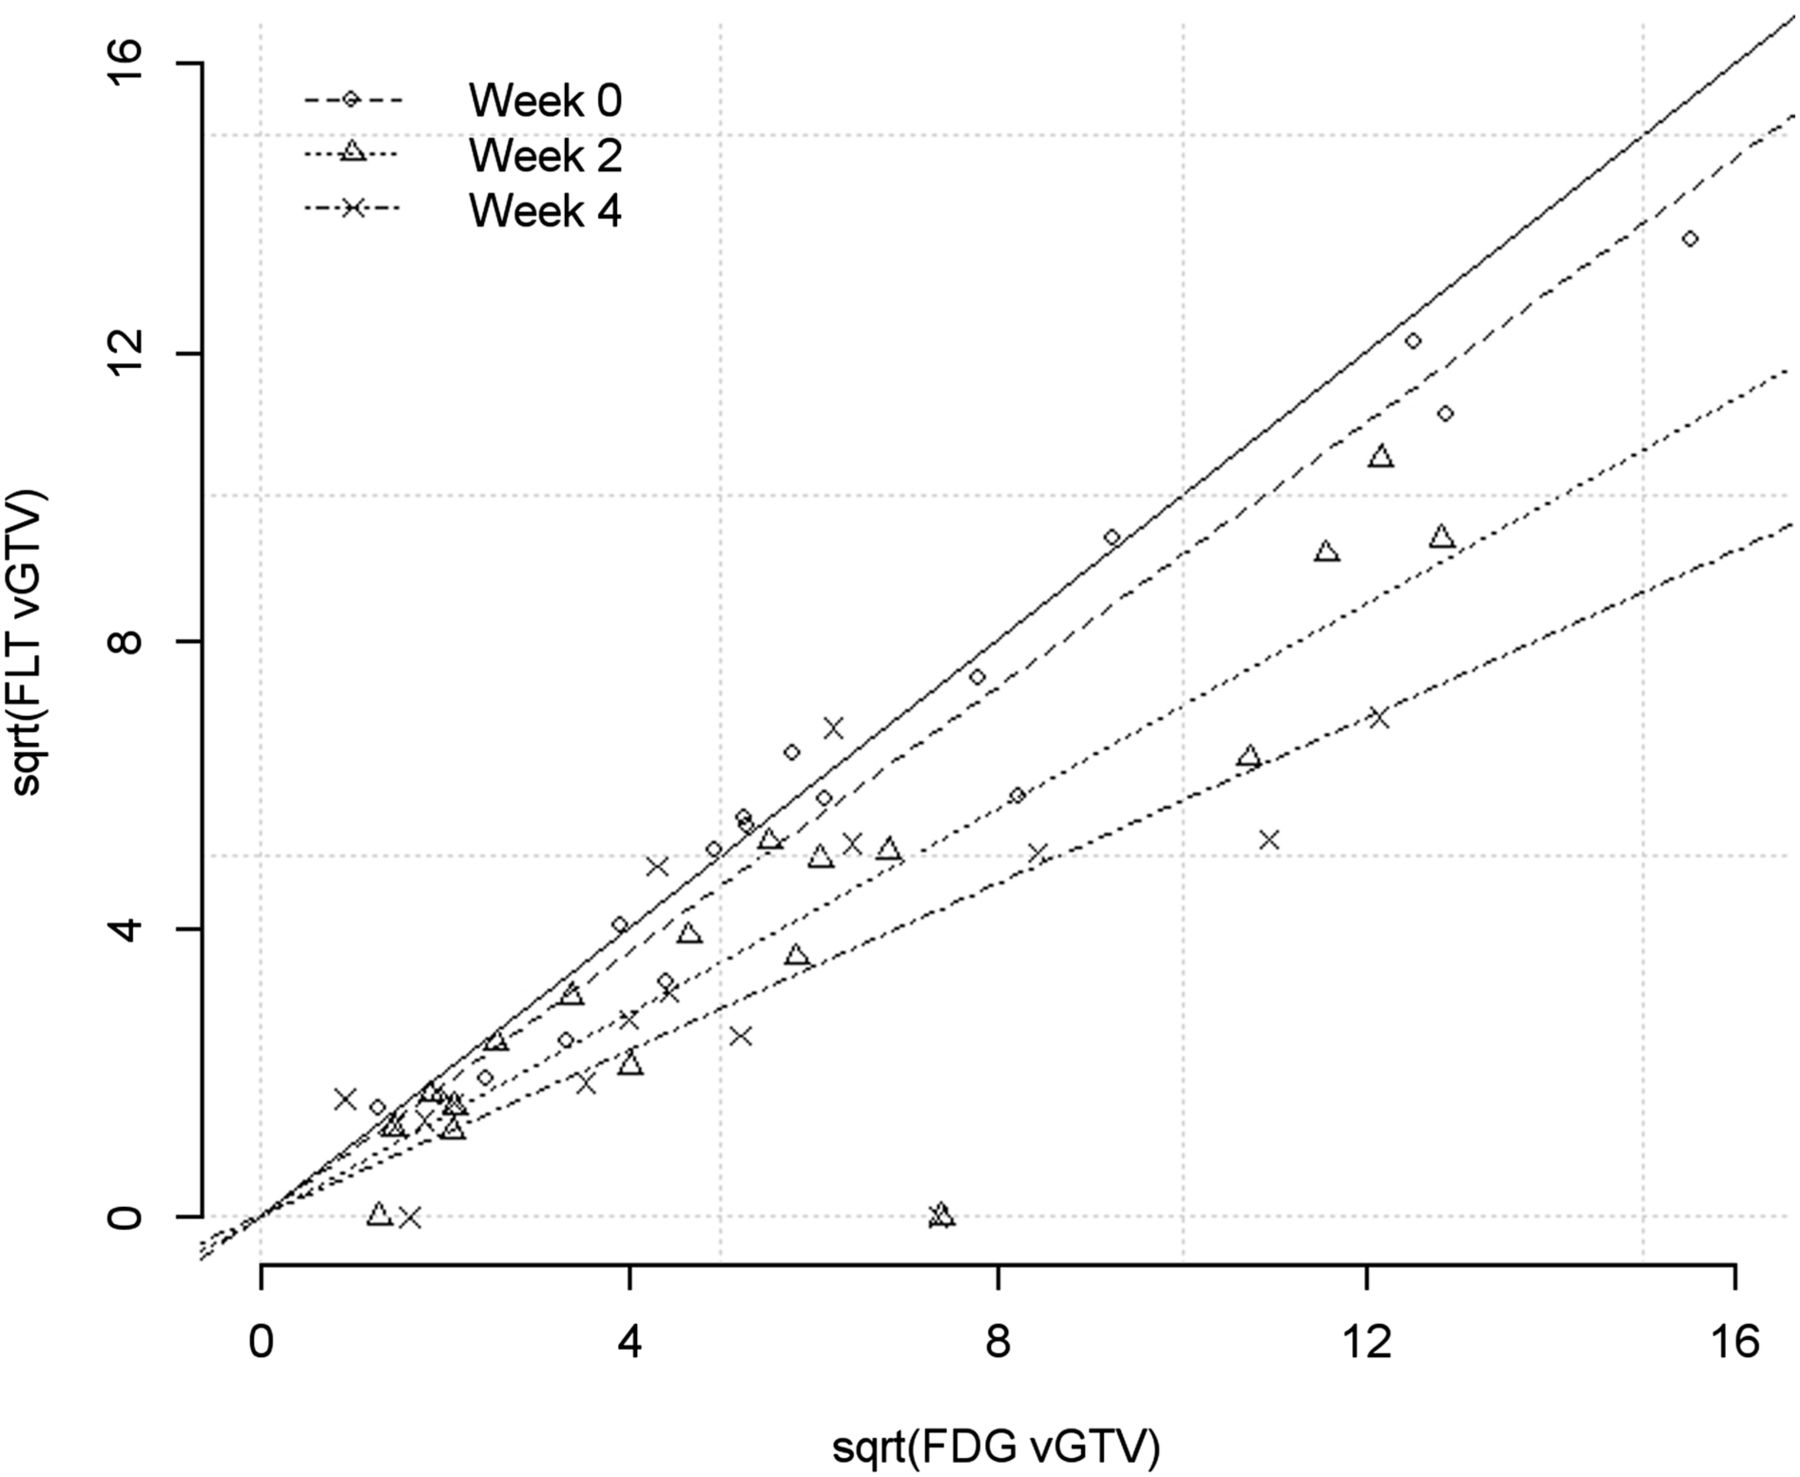
Scatter plot, using square-root (sqrt) transformation, of primary tumor volumes (GTV, cm3) as measured by 18F-FDG and 18F-FLT at baseline (week 0), week 2, and week 4.
Nodal Volume (GTV1 and GTV2) Characteristics
For 15 (83%) of the 18 patients who underwent both baseline scans, there was complete agreement regarding the detection of metastatic lymph nodes. Of those remaining, 1 (6%) patient had 1 additional 18F-FDG–avid node identified and 2 (11%) patients had 2 additional 18F-FDG–avid nodes identified. For both 18F-FDG0 and 18F-FLT0, the median number of nodes was 2 (range, 0–17). The estimated proportion of patients with uptake detected in GTV1 and GTV2 at baseline was 100% for both tracers. The estimated proportion of patients with detectable tracer in GTV1 was 100% (exact 95% CI, 77%–100%) on 18F-FDGwk2 and 64% (exact 95% CI, 35%–87%) on 18F-FLTwk2. This proportion reduced to 86% (exact 95% CI, 57%–98%) on 18F-FDGwk4 and 43% (exact 95% CI, 18%–71%) on 18F-FLTwk4. Observations for GTV2 were consistent with these. As observed in the primary GTV, the intensity (SUVmax and SUVmean) of 18F-FDG uptake in the nodal volumes was consistently higher than 18F-FLT uptake (results not shown).
Metabolic and Proliferative Disease Response: Visual Assessment
For patients assessable by both tracers at a given time point, there was fair agreement in tumor response between tracers (Table 2). At week 2, the Cohen’s unweighted κ statistic was 0.274 (95% CI, −0.05 to 0.60). At week 4, the κ statistic was 0.355 (95% CI, −0.01 to 0.72). Of the 19 patients scanned with 18F-FDGwk2, 10 (52%) patients had a PMR (appreciable reduction of tracer uptake) and 8 (42%) had SMD. In contrast, 13 (76%) patients had a PPR on 18F-FLT and only 1 (6%) had SPD.
Local Therapeutic Visual Response for Those Patients Who Underwent Both Scans at Given Time Point
18F-FDGwk2 and 18F-FLTwk2 confirmed evidence of local disease progression in 1 patient (Fig. 2). The time frame between 18F-FDG0 to 18F-FLT0 and RT start were 6 and 18 d, respectively. Scan findings coincided with a deteriorating clinical condition, including new superior vena cava obstruction. After insertion of a superior vena cava stent, RT was administered using accelerated bidaily RT in 1.5-Gy fractions, 6 h apart, in an effort to overcome interfraction repopulation. Week 4 scans revealed a PMR and PPR, coinciding with an improvement in the patient’s clinical status. Unfortunately this response was transient, and the patient died 2 wk after treatment completion.
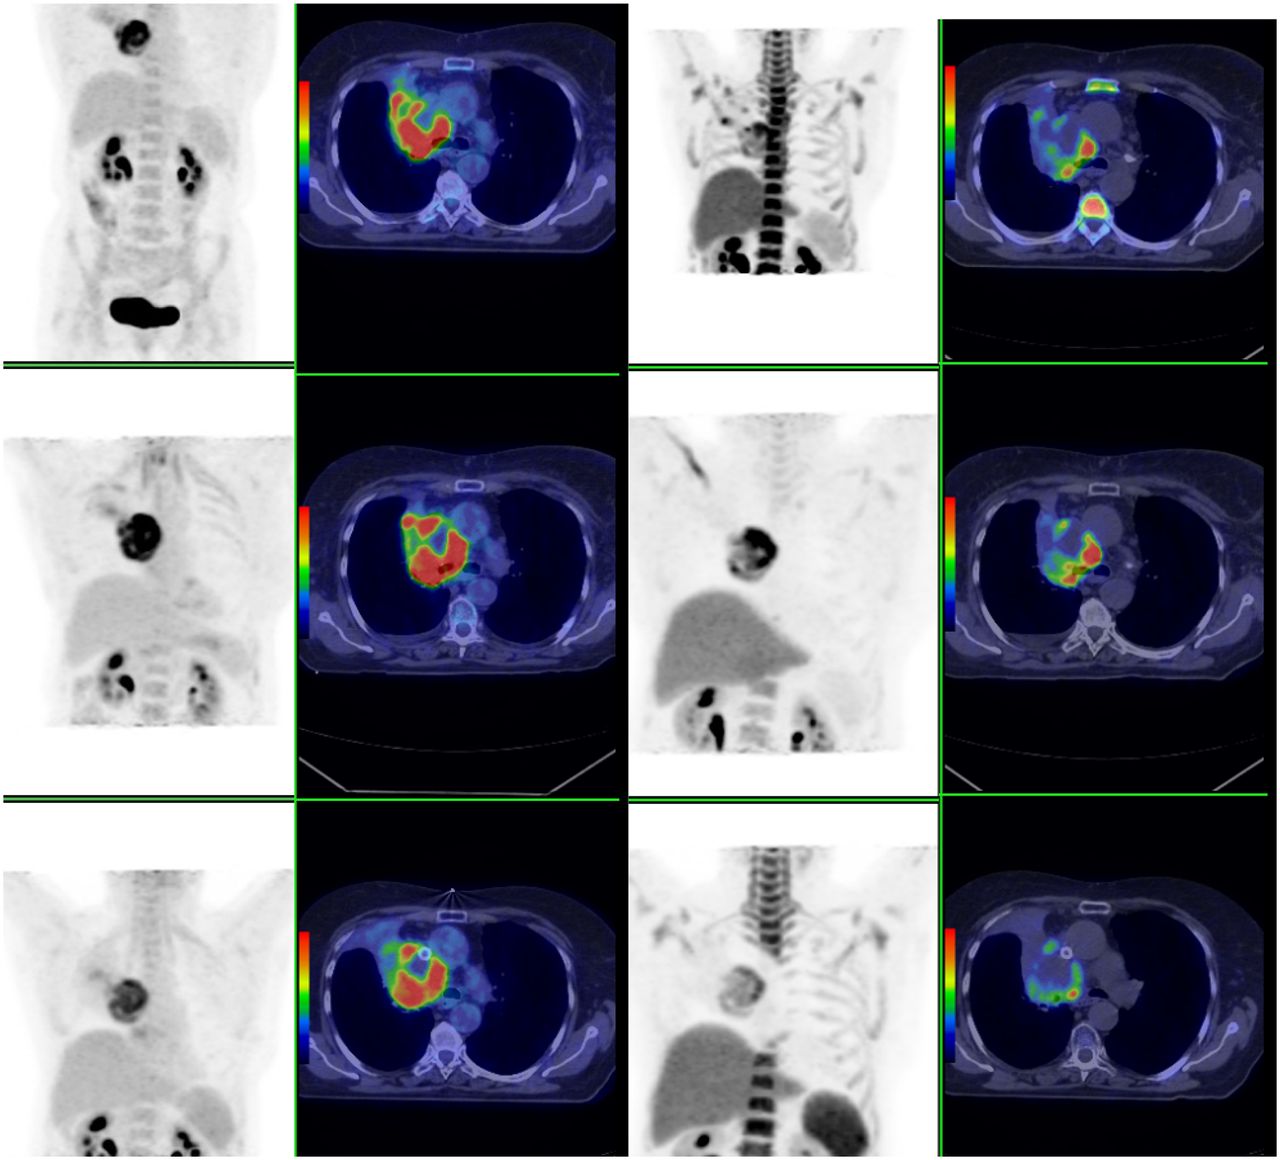
Patient with T3N0M0 large cell carcinoma. Progressive disease (increasing tracer volume and avidity) evident on 18F-FDGwk2 and 18F-FLTwk2. After superior vena cava stent and bidaily RT, PMR and PPR were evident at week 4. (From left) Coronal 18F-FDG PET, transverse 18F-FDG PET/CT, coronal 18F-FLT PET, transverse 18F-FLT PET/CT. Top row shows baseline, middle row week 2, and bottom row week 4 images.
The analysis of global therapeutic response revealed that 2 (10%) patients had evidence of distant progressive disease during RT. In 1 patient, a lytic lesion in the left scapula was evident on both 18F-FDGwk2 and 18F-FLTwk2. This was nondiagnostic at baseline but increased in avidity during therapy. After 40 Gy of thoracic RT, this patient received palliative systemic chemotherapy. A PET-apparent supraclavicular lymph node was identified on the 18F-FDGwk2 scan of another patient, which was subdiagnostic at baseline, representing progressive disease outside the radiation field. RT portals were increased to encompass this node. A PMR and PPR were confirmed on the 18F-FDGwk4 and 18F-FLTwk4 scans, respectively.
Survival and Time to Distant Progression
Overall survival was 84% at 1 y and 47%, 26%, and 26% at 2, 3, and 4 y, respectively. Because of the small sample size, patients with complete and partial responses were categorized together as responders and patients with stable disease or progressive disease were categorized together as nonresponders. All but 2 patients had responses on their 18F-FLT PET imaging at 2 and 4 wk (CPR or PPR). With such small numbers, no meaningful survival comparisons could be made between responders and nonresponders based on 18F-FLT PET. With respect to 18F-FDG PET, overall survival measured from the first day of treatment was 2.05 y for 10 patients who had a response (CMR or PMR) on their week 2 scan, compared with 1.74 y for 9 patients who did not have a response (SMD or PMD) (P = 0.623). Median survival for responding patients on the 4-wk 18F-FDG PET scan was 1.71 y for 14 patients who had a response, compared with 2.73 y for 4 patients who did not have a response (P = 0.112). The 4-wk analysis excluded patients who had progressed on their 2-wk scan.
Median time to distant failure for 10 patients who had a response on their 2-wk 18F-FDG PET scan (1.27 y) was similar to that for the 9 patients who did not (1 y). Median time to distant failure was 1.09 y for 14 patients who had a response on their 4-wk 18F-FDG PET scan, compared with 2.2 y for those who did not (P = 0.733).
DISCUSSION
In this prospective study, sequential 18F-FDG and 18F-FLT PET/CT demonstrated profound changes in tracer uptake during definitive chemoradiation, consistent with major alterations in cellular metabolism and proliferation. Furthermore, appreciable differences were observed in tumoral uptake between 18F-FLT and 18F-FDG at weeks 2 and 4, suggesting that chemo-RT affects tumor cell proliferation more rapidly than cellular metabolism. The additional information provided by 18F-FLT may be more reflective of clonogen response. 18F-FLTwk2 showed a marked PPR in almost all tumors, whereas the metabolic tumor volume on 18F-FDGwk2 was stable or moderately responding in most patients. In contrast, a partial therapeutic response was evident with both tracers at week 4. Similar high response rates were reported by Vera et al. (6) who performed single 18F-FDG, 18F-FLT, and 18F-fluoromisonidazole PET/CT scans on 5 NSCLC patients after 46 Gy (6).
From our data, it appears that tumor cell proliferation reacts more rapidly to therapy than tumor metabolism, and the magnitude of this difference between rate of change in proliferation and metabolism is large. Furthermore, a higher net uptake of 18F-FDG than 18F-FLT might be expected because a larger fraction of tumor cells are metabolically active cells than are proliferating (13). An inability to differentiate between uptake of tracer in tumor or inflammation is a recognized limitation of 18F-FDG (4,9). In many cancers, more 18F-FDG is located in nonneoplastic inflammatory or stromal cells (14) than in the tumor cells themselves. Nonspecific accumulation of 18F-FDG may have overestimated the proportion of viable tumor cells and reduced the probability of observing an early metabolic response as compared with an early proliferative response. In contrast to no metabolic activity, which indicates cell death, a cell that is not undergoing DNA synthesis may yet be viable, presenting a converse limitation of 18F-FLT whereby cell death can be overestimated if a transient decrease in proliferation occurs.
Baseline tracer uptake was 2.3 times higher for 18F-FDG0 than 18F-FLT0, consistent with the known superior sensitivity of 18F-FDG, compared with 18F-FLT, for NSCLC detection (15,16). During therapy, we observed an increase in this disparity, with an average 18F-FDG SUVmax of 3.1 and 3.5 times higher than 18F-FLT SUVmax at weeks 2 and 4, respectively. The higher 18F-FDG avidity could partially be attributed to an influx of macrophages, which also exhibit increased 18F-FDG uptake (17). Reduced specificity of 18F-FLT has also been reported due to nonspecific uptake in the germinal center of activated lymph nodes (18,19). Dynamic scanning with kinetic analysis or dual-time-point imaging may have more accurately differentiated between these factors.
Because all patients were candidates for radical treatment based on a contemporaneous 18F-FDG PET/CT scan, the significant impact of study scan findings on patient management was unexpected. Although intended as an observational study, the management of 4 (20%) patients was changed because of the study scans. This change in management plan is especially significant because all patients would have continued with definitive chemo-RT without the new information provided by the study scans. The first instance of 18F-FLT–detected repopulation during chemo-RT for NSCLC, which was correlated with clinical deterioration, is presented in Figure 2. In another patient, brain metastases were observed on 18F-FLT PET that were previously undetected. In our clinic, a staging CT brain scan is indicated for those patients with extensive locoregional disease or symptoms suggestive of cranial metastases. On this basis, this patient was not scheduled for brain imaging, other than the study 18F-FLT0 scan. The low uptake of 18F-FLT in normal brain makes 18F-FLT more sensitive than 18F-FDG for the detection of brain metastasis, and in this case it is unknown whether the lesions would have been detected on the 18F-FDG PET image but is unlikely given the small size of the lesion and high normal cortical uptake of 18F-FDG.
Interim PET/CT imaging—when treatment volumes, dose, and fractionation can still be adapted—offers scope to individualize response-adapted therapy. Biologically adapted therapy could use altered fractionation, boosting persistent tumor subvolumes or giving targeted pharmaceuticals (8). Progressive disease on interim scans may even prompt an early change to less toxic palliative therapy, avoiding toxicity from futile chemo-RT. Biologically guided RT-based changes remains investigational and demands careful consideration of tumor biology. The distribution of tumor cells—including hypoxia and rapidly proliferating and inflammatory cells—is heterogeneous, and the proportions and properties of tumor cells may change rapidly during RT. The administration of cytotoxic drugs may also affect the interpretation of scan findings.
Only long-term patient follow-up can provide definitive information on the prognostic significance of these interim PET/CT scans. The overall survival for patients in our study was comparable to that in modern series. However, this relatively small cohort was insufficient to make any meaningful outcome comparisons between patients with good or poor responses on their 2- and 4-wk 18F-FDG and 18F-FLT PET scans. With this caveat, we detected no statistically significant differences between groups. However, larger series suggest that molecular imaging response during treatment may have prognostic implications. For example, in the setting of definitive RT, Kong et al. found a correlation between metabolic tumor response on 18F-FDGwk4 PET/CT and overall survival (P = 0.03) in 40 NSCLC patients (20). Van Baardwijk et al. (5) demonstrated heterogeneity in the metabolic response of 23 patients early during radical RT, particularly between responders and nonresponders (5). Other studies of advanced NSCLC and molecularly targeted anticancer agents (erlotinib) have also shown that early PET response with 18F-FDG and 18F-FLT are associated with improved progression-free survival (21,22). However, as a targeted therapy, this response may reflect a pharmacodynamic read-out of reducing signaling through the oncogenic pathway rather than a direct measure of cell death. In the current study, our limited sample size is not powered to confidently interpret the meaning of interim scan observations in the context of patient outcomes. We are currently recruiting additional patients to this trial to more confidently determine whether interim scan response is correlated with patient survival. On the basis of these findings, we hope to continue this work and identify subsets of patients who may be candidates for biologically individualized therapies.
CONCLUSION
This study demonstrates that 18F-FLT PET/CT appears to be a more sensitive tracer of early treatment response than 18F-FDG PET/CT, although it is currently unclear whether these changes predict eventual clinical outcome. The serial PET/CT scans undertaken for this study show different metabolic and proliferative responses of NSCLC during chemo-RT, the prognostic significance of which warrants further investigation.
DISCLOSURE
The costs of publication of this article were defrayed in part by the payment of page charges. Therefore, and solely to indicate this fact, this article is hereby marked “advertisement” in accordance with 18 USC section 1734. This work is supported by a National Health and Medical Research Council project grant (APP1003895) and Victorian Cancer Agency Tumor Stream Research grant. No other potential conflict of interest relevant to this article was reported.
Footnotes
Published online May 15, 2014.
- © 2014 by the Society of Nuclear Medicine and Molecular Imaging, Inc.
REFERENCES
- Received for publication September 2, 2013.
- Accepted for publication March 10, 2014.


Jump to section
Related Articles
Cited By...
- Predictive value of 3'-deoxy-3'-18F-fluorothymidine PET in the early response to anti-programmed death-1 therapy in patients with advanced non-small cell lung cancer
- 18F-FLT PET/CT Adds Value to 18F-FDG PET/CT for Diagnosing Relapse After Definitive Radiotherapy in Patients with Lung Cancer: Results of a Prospective Clinical Trial
- Predictive Value of Early-Stage Uptake of 3'-Deoxy-3'-18F-Fluorothymidine in Cancer Cells Treated with Charged Particle Irradiation