


Abstract
The aim of this prospective investigation was to assess the association of parameters derived from baseline 18F-FDG PET/CT with overall survival (OS) in men with castrate-resistant metastatic prostate cancer. Methods: Eighty-seven men with castrate-resistant metastatic prostate cancer underwent 18F-FDG PET/CT and were followed prospectively for OS. Median follow-up in patients who were alive was 22.2 mo (range, 1.6–62.5 mo). OS was defined as the time between the PET/CT imaging or the start of chemotherapy, whichever was later, and death, with patients who were alive censored at the last follow-up date. PET parameters included maximum standardized uptake value (SUVmax) of the most active lesion, sum of SUVmax, and average SUVmax of all metabolically active lesions, after subtraction of patient-specific background-liver average SUV. Comparison of OS was based on univariate and multivariable Cox regression analyses of continuous PET parameters adjusted for standard clinical parameters (age, serum prostate-specific antigen level, alkaline phosphatase, use of pain medication, prior chemotherapy, and Gleason score at initial diagnosis). Survival curves based on Kaplan–Meier estimates are presented. Results: Among the 87 patients, 61 were dead at the time of last follow-up. Median OS was 16.5 mo (95% confidence interval [CI], 12.1–23.4 mo), and the OS probability at 24 mo was 39% ± 6%. For the univariate analysis, the hazard ratios associated with each unit increase were 1.01 (95% CI, 1.006–1.02) for sum of SUVmax (P = 0.002), 1.11 (95% CI, 1.03–1.18) for maximum SUVmax (P = 0.010), and 1.13 (95% CI, 0.99–1.30) for average SUVmax (P = 0.095). For the multivariable analysis adjusting for relevant clinical parameters, the continuous parameter sum of SUVmax remained significant (P = 0.053), with a hazard ratio of 1.01 (95% CI, 1.001–1.02). When sum of SUVmax was grouped into quartile ranges, there was poorer survival probability for the patients in the fourth-quartile range than for those in the first-quartile range, with a univariate hazard ratio of 3.8 (95% CI, 1.8–7.9). Conclusion: Sum of SUVmax derived from 18F-FDG PET/CT contributes independent prognostic information on OS in men with castrate-resistant metastatic prostate cancer, and this information may be useful in assessing the comparative effectiveness of various conventional and emerging treatment strategies.
The lifetime risk of prostate cancer in developed countries is about 1 in 6 men (1). In the post–prostate-specific antigen (PSA) screening era, most patients (about 93%) present with locoregional disease, whereas metastatic disease is the initial presentation in about 4% of patients, with the remaining 3% categorized as of unknown stage (1). Although men with localized prostate cancer are treated with curative intent, many will eventually develop biochemical recurrence and metastatic disease (2). Most men with metastatic prostate cancer develop a castrate-resistant state having a hallmark of tumor growth despite castrate levels of serum androgens (3). Castrate-resistant metastatic prostate cancer is incurable and is the main cause of disease-related morbidity and mortality.
An important unmet need in this clinical context is the optimal selection and sequencing of various drug options guided by the most informative outcome measures to provide maximum benefit to individual patients (4). Given the proclivity of prostate cancer to metastasize to bone, and the limitations of existing imaging tools for assessment of bone metastases, evaluating response quantitatively has been difficult. These difficulties include the inability to use response criteria such as Response Evaluation Criteria in Solid Tumors for assessment of bone metastases on CT, the confounding effect of the flare phenomenon on standard bone scintigraphy, and the ambiguity associated with the clinical significance of changes in serum PSA level (5,6). This notion is also coupled with the current evolution in the treatment paradigm to control, relieve, or eliminate disease manifestations (e.g., PSA, imaging findings, or symptoms) and to delay or prevent future disease manifestations (7). A recognized and relevant outcome measure in castrate-resistant metastatic prostate cancer is overall survival (OS), which may be useful for guiding and optimizing treatment decisions. OS may be predicted by several clinical, laboratory, and imaging parameters. However, given the remarkable heterogeneity of disease in terms of prognosis, a quantitative patient-specific imaging-based predictive model of OS will be of significant clinical value.
PET is an ideal imaging tool for noninvasive interrogation of the underlying tumor biology. Several promising radiotracers are being investigated in the imaging evaluation of prostate cancer, including 18F- or 11C-choline, 18F- or 11C-acetate, 16β-18F-fluoro-5α-dihydrotestosterone targeted to the androgen receptor, the synthetic l-leucine analog anti-1-amino-3-18F-fluorocyclobutane-1-carboxylic acid, and PSMA-based PET radiotracers (8,9). However, the exact diagnostic and prognostic roles of these radiotracers in prostate cancer are undefined and will require continued investigation. 18F-FDG is the most common PET radiotracer used for oncologic applications and is based on elevated glucose metabolism in malignant tissue in comparison to normal tissue. 18F-FDG uptake in prostate cancer depends on tumor differentiation, with low uptake in well-differentiated tumors and high uptake in aggressive poorly differentiated tumors (10). Cumulative current evidence strongly suggests that 18F-FDG PET/CT may be useful in the imaging evaluation of men with metastatic prostate cancer (10).
The aim of this prospective investigation was to determine whether parameters derived from 18F-FDG PET/CT bear independent prognostic information on OS in patients with castrate-resistant prostate cancer.
MATERIALS AND METHODS
Patients
Patients were recruited prospectively from 2005 to 2009 after approval of the research protocol by our Institutional Review Board and the Radiation Safety Committee. All patients signed a written informed consent form in adherence with regulations of the Health Insurance Portability and Accountability Act.
The study was designed to enroll 100 patients with known castrate-resistant metastatic prostate cancer. Patients were eligible if they were beginning a chemotherapeutic regimen after failing hormonal therapy or if they were beginning a second chemotherapy regimen after progressing on a first-line chemotherapy regimen. No restrictions were placed on the type of chemotherapy; patient management was left to the treating physician—but patients were selected after the decision to begin chemotherapy had been made. Confirmation of metastatic disease was based on standard imaging studies that included planar 99mTc bone scintigraphy and CT scans of the chest, abdomen, and pelvis. Castrate resistance was based on established criteria by the European Association of Urology that call for a castrate serum testosterone level of less than 50 ng/dL or 3 consecutive rises of serum PSA level despite hormonal manipulation, measured 1 wk apart, resulting in a 50% increase over nadir or disease progression by CT or bone scintigraphy (11). Exclusion criteria included a history of cancer other than prostate cancer, active infection, poorly controlled diabetes mellitus, active inflammatory conditions, a recent or complicated nonhealing fracture, and hip or knee arthroplasty. All patients were followed prospectively for OS.
PET/CT Imaging
All patients underwent PET/CT imaging (Biograph Duo LSO; Siemens) 1 h after intravenous administration of 370–550 MBq (10–15 mCi) of 18F-FDG. PET/CT was performed only after completion of customary quality control procedures (68Ge normalization daily, Society of Nuclear Medicine and Molecular Imaging PET/CT chest phantom every 3 mo) in our laboratory. All patients fasted for 4–6 h before 18F-FDG PET/CT imaging, and water intake was encouraged before and after each scan. The blood glucose level was determined for all patients before 18F-FDG administration and in all cases was less than 200 mg/dL.
Helical CT (pitch, 1.0; 90–130 mAs; 130 kVp) was performed first for each scan. Only oral contrast material was used. PET was then performed for 4 min per bed position at a sufficient number of bed positions to cover the top of the head to the feet. Raw CT data were reconstructed into transverse images 5 mm thick, and reformatted sagittal and coronal CT images were generated. CT-based attenuation-corrected PET images were reconstructed and viewed on a color high-resolution monitor. PET and CT images could be viewed on a continuous fusion scale from PET-only to CT-only images using E-soft image fusion software (Siemens).
Image Interpretation and Data Collection
PET/CT images for each scan were interpreted in consensus by 2 board-certified nuclear radiologists with more than 11 y of experience in interpreting PET/CT studies. Because our PET Imaging Center is a large tertiary referral site, a uniform approach was used to avail any results of conventional planar 99mTc-based bone scintigraphy or contrast-enhanced or unenhanced chest, abdomen, and pelvis CT to the readers for correlation to the PET/CT studies.
For each patient, the number of lesions with visually discernible uptake was recorded. Only lesions with adequately defined borders on CT were selected for further evaluation, up to an arbitrary maximum of 25 lesions per scan for the various disease sites (e.g., bone, lymph node, and soft tissue). The maximum standardized uptake value (SUVmax) of each lesion (as defined on standard imaging) was obtained using 3-dimensional regions of interest with vendor-provided software (Siemens). The SUVmax for each lesion, after subtraction of patient-specific average hepatic background (reference) activity, was used for analysis. The average hepatic background SUV was obtained by a 3-cm-diameter region of interest over an area of normal liver (12).
The PET variables included the maximum SUVmax of the most active lesion, the sum of SUVmax, and the average SUVmax of all lesions. These 3 values were considered to be 0 if the SUVmax of all lesions was lower than the average hepatic-background SUV.
Statistical Methods
The primary clinical endpoint of the analyses was OS, which was defined as the time between PET/CT imaging or the start of chemotherapy, whichever was later, and death; patients who were alive at their last follow-up were censored at that time. The association of the continuous PET variables with OS was evaluated using the Cox proportional hazards regression model. In the univariate analyses, each PET variable was included in a Cox regression model alone. In the multivariable analyses, each continuous PET variable was added to a Cox regression model that adjusted for standard clinical parameters (age, PSA, alkaline phosphatase, use of pain medication, prior chemotherapy, and Gleason score at initial diagnosis). To adjust for these clinical variables, all six were included in an initial multivariable Cox regression model and the linear prediction scores calculated from that Cox model were then used to adjust for clinical variables in the multivariable Cox regression model that also included the PET variables. P values, all 2-sided, were based on the likelihood ratio test associated with the Cox model regression analysis.
The above analyses were undertaken to establish whether there was an association between PET metabolic measures and OS; to begin to characterize the associations, 3 graphical methods were used to illustrate patterns. First, survival probabilities were calculated using the Kaplan–Meier method with the variable grouped into quartiles; quartiles, rather than splitting at the median, were used to display a dose–response effect in the plots, should it exist. Second, to illustrate the association of a PET parameter with OS after adjusting for clinical variables, the effect of the parameter on OS was examined separately for patients with low risk and those with high risk. Low risk and high risk were based on the linear prediction scores from the Cox regression model that included all the standard clinical variables considered in this article. Patients with prediction scores below the median prediction score were considered at low risk, and those with prediction scores above the median were considered at high risk. Within the low-risk group and the high-risk group, patients were further grouped into those with the PET parameter above the median value and those below the median value. Lastly, to further illustrate the change in hazard of dying as a function of the PET parameter, a plot of “moving averages” was constructed. To calculate these moving averages, the observed values were ordered from minimum to maximum. The ordered values were used on successive groups of 5 patients to calculate a mean PET parameter value and the observed hazard (number of observed deaths divided by the sum of the observed times at risk). The calculated hazards were plotted against the mean values for each subset of 5 patients. A smoothed version of the moving averages based on cubic splines was superimposed on the plot to visualize the overall pattern.
RESULTS
In this paper, we report on 87 patients. On review of the 100 patients enrolled, 13 either never began a chemotherapy regimen, did not begin treatment within 1 mo of enrollment, or failed to undergo the baseline PET/CT scan. The included 87 men had a median age of 68 y (range, 49–90 y). Table 1 summarizes the patient and disease characteristics. The median serum PSA level at the time of enrollment was 66.9 ng/mL (range, 0.09–4,530 ng/mL). Twenty-nine of the 87 patients had progressed on first-line chemotherapy at the time of enrollment, whereas the remaining 58 patients were started on some form of chemotherapy after failing hormonal therapy. The median follow-up time in patients who were alive was 22.2 mo (range, 1.6–62.5 mo).
Patient and Disease Characteristics
Distribution of Sites of Metastatic Disease
The distribution of sites of disease is summarized in Table 2. As expected, bone involvement was present in most patients (73/87 [83.9%]). Bone was the only site of metastatic disease in 36 patients (41.4%). Disease of the lymph nodes or non–lymph node soft-tissue (e.g., brain, lung, or liver) was present as the only site in 9 patients and 2 patients, respectively. The remainder of the patients had a combination of sites: lymph nodes and soft-tissue sites in 3 patients, bone and lymph nodes in 21 patients, bone and soft-tissue sites in 5 patients, and extensive bone, lymph node, and soft-tissue disease sites in 11 patients.
Distribution of Sites of Disease and Summary of PET/CT Imaging Results
PET/CT Imaging
Table 2 also summarizes the PET/CT imaging results for all patients. There were 76 patients with 25 or fewer measured lesions, with the remaining 11 patients demonstrating extensive disease (>25 lesions). Among the 76 patients with 25 or fewer measured lesions, 72 had at least 1 lesion with an SUVmax greater than 0 (after subtraction of the average liver SUV); 4 patients had lesions that were mildly active but with an SUVmax lower than the patient-specific average-liver SUV. Among the patients with 25 or fewer lesions, the median number of metabolically active lesions was 7 (range, 0–23). Median and ranges for the other PET parameters were 14 and 0–217.5 for sum of SUVmax, 3.9 and 0–22.9 for maximum SUVmax, and 2.1 and 0–11.4 for average SUVmax.
Relationship of PET Parameters to OS
Of the 87 patients, 61 were dead at the time of this analysis. The median OS was 16.5 mo (95% confidence interval [CI], 12.1–23.4 mo), and the 24-mo OS probability was 39% ± 6% (Fig. 1). Table 3 summarizes the results of the Cox regression models of OS, with or without adjusting for the standard clinical parameters. As shown in the table, in univariate Cox regression analysis the hazard ratios associated with each unit increase in a corresponding PET parameter were 1.01 (95% CI, 1.006–1.02) for sum of SUVmax (P = 0.002), 1.11 (95% CI, 1.03–1.18) for maximum SUVmax (P = 0.010), and 1.13 (95% CI, 0.99–1.30) for average SUVmax (P = 0.095). In particular, when sum of SUVmax was grouped into quartile ranges, there was significantly poorer survival probability for the patients in the fourth-quartile range than for those in the reference first-quartile range, with a univariate hazard ratio of 3.8 (95% CI, 1.8–7.9) (Fig. 2). In the multivariable Cox regression analysis that adjusted for the standard clinical parameters, the continuous parameter sum of SUVmax remained significant (P = 0.053), with a hazard ratio of 1.01 (95% CI, 1.001–1.02) (Table 3 and Supplemental Table 1; supplemental materials are available online at http://jnm.snmjournals.org). To further illustrate the impact of sum of SUVmax on patients’ OS after adjusting for standard clinical variables, the effect of sum of SUVmax on OS was examined separately for low-risk patients and high-risk patients. As described in the “Materials and Methods” section, patients were dichotomized into low- and high-risk groups on the basis of their linear prediction scores from the Cox regression model that included the 6 clinical variables. For the low-risk group, patients with a higher sum of SUVmax had a significantly worse outcome than patients with a lower sum of SUVmax (P = 0.006), based on the Cox model with sum of SUVmax as a continuous variable, and including only the subset of patients with low risk (Fig. 3). For the high-risk group, by contrast, the association between sum of SUVmax and OS was not significant (P = 0.21).

OS probability for all patients.

Kaplan–Meier plot of OS probability against sum of SUVmax grouped into quartiles. Patients in fourth-quartile group (blue line) have significantly poorer survival probability than reference first-quartile group (green line). First-quartile range = 0–4.6, second-quartile range = 4.7–13.9; third-quartile range = 14–28.6; fourth-quartile range = 28.7–217.5.
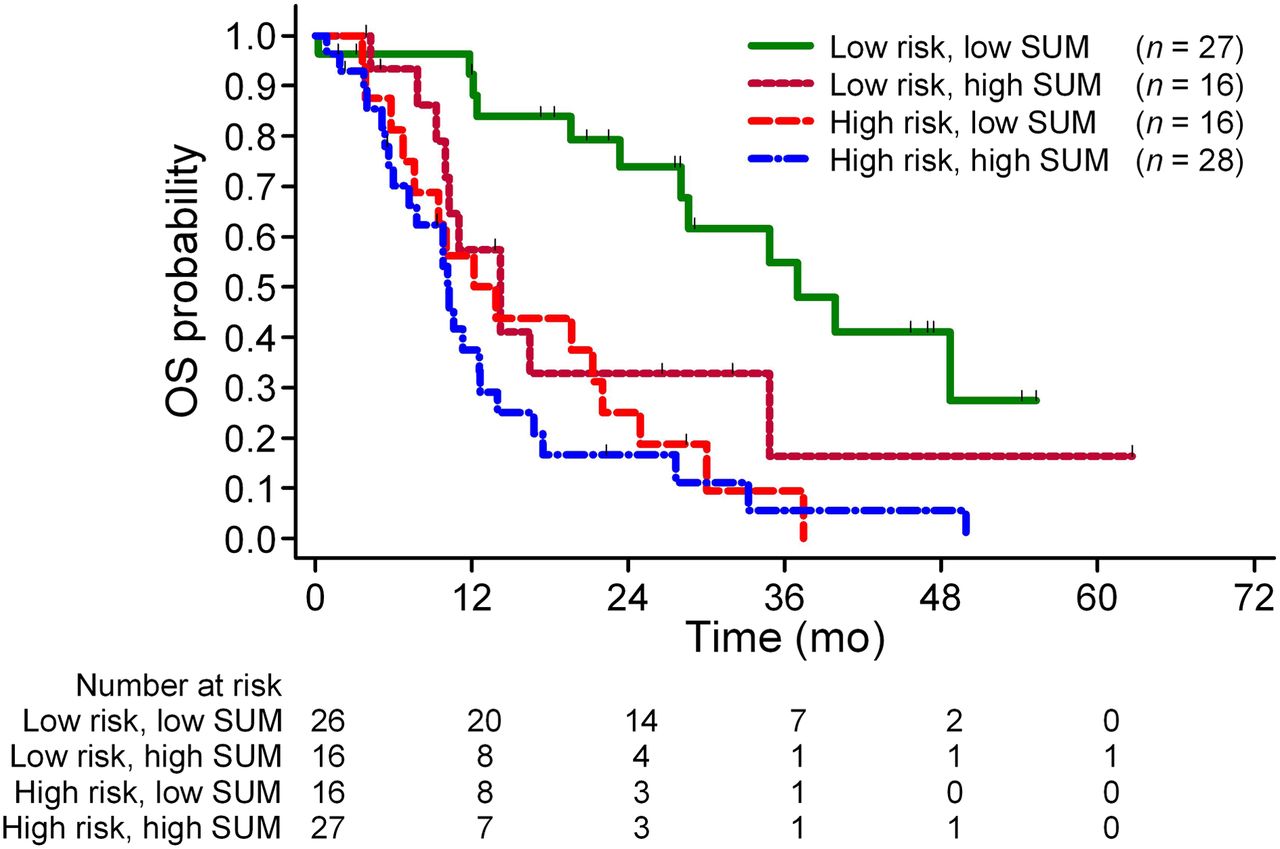
OS of low- and high-risk patients further grouped by sum of SUVmax. Low risk and high risk were based on linear prediction scores from Cox model that included all considered standard clinical variables with prediction scores dichotomized at median values (below median as low risk, above median as high risk). Within each risk group, patients were further dichotomized on basis of median sum of SUVmax. For low-risk group, patients with higher sum of SUVmax had significantly worse outcome than patients with lower sum of SUVmax (P = 0.006). By contrast, for high-risk group, association between sum of SUVmax and OS was not significant (P = 0.21).
Summary of Cox Regression Analysis on OS
Chance of Death per Person per Month by Sum of SUVmax
Figure 4 presents the plot of the moving hazard of dying versus sum of SUVmax with 95% CIs constructed at selected points. In this setting, the hazard can be interpreted as chance of death per person per month. Inspection of this plot suggests that patients with sum of SUVmax less than 15–20 have a lower hazard of dying than patients with a baseline sum of SUVmax greater than 20–25.
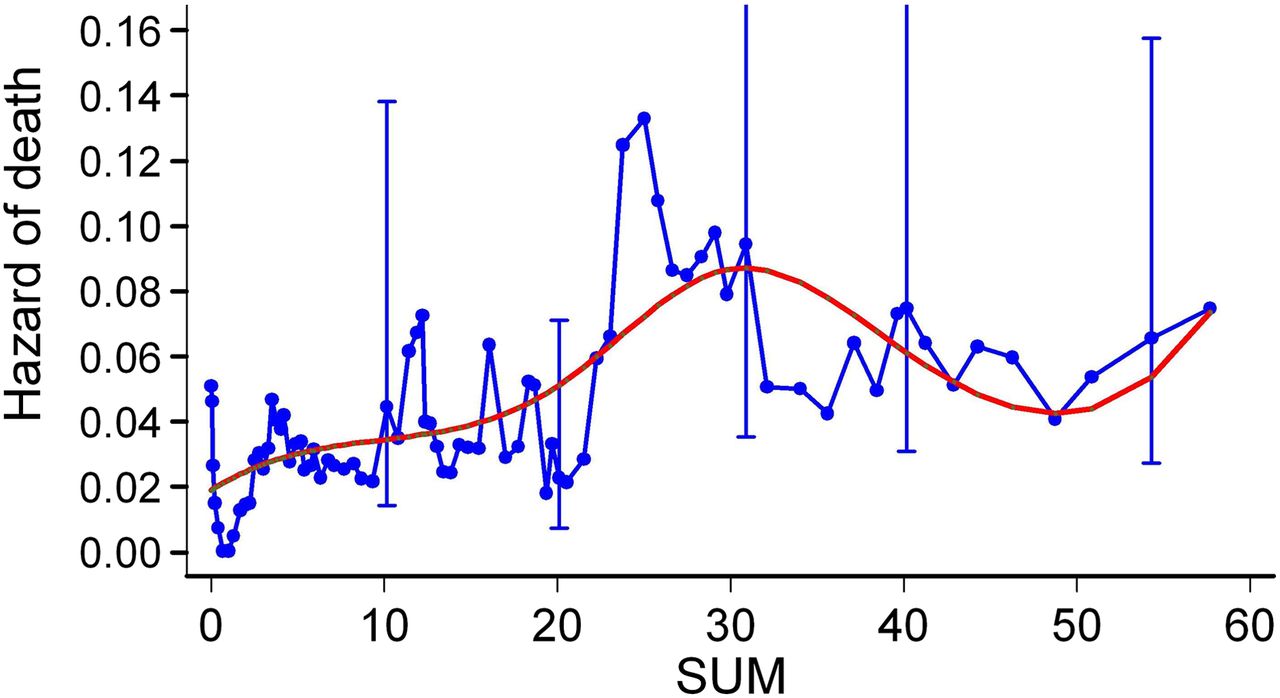
Moving hazards of death (blue line) in relation to sum of SUVmax interpreted as chance of death per person per month. Cubic spline smoothed line (in red) is superimposed. Marked upward shift of curve is seen for sum of SUVmax greater than 20.
Clinical Case Examples
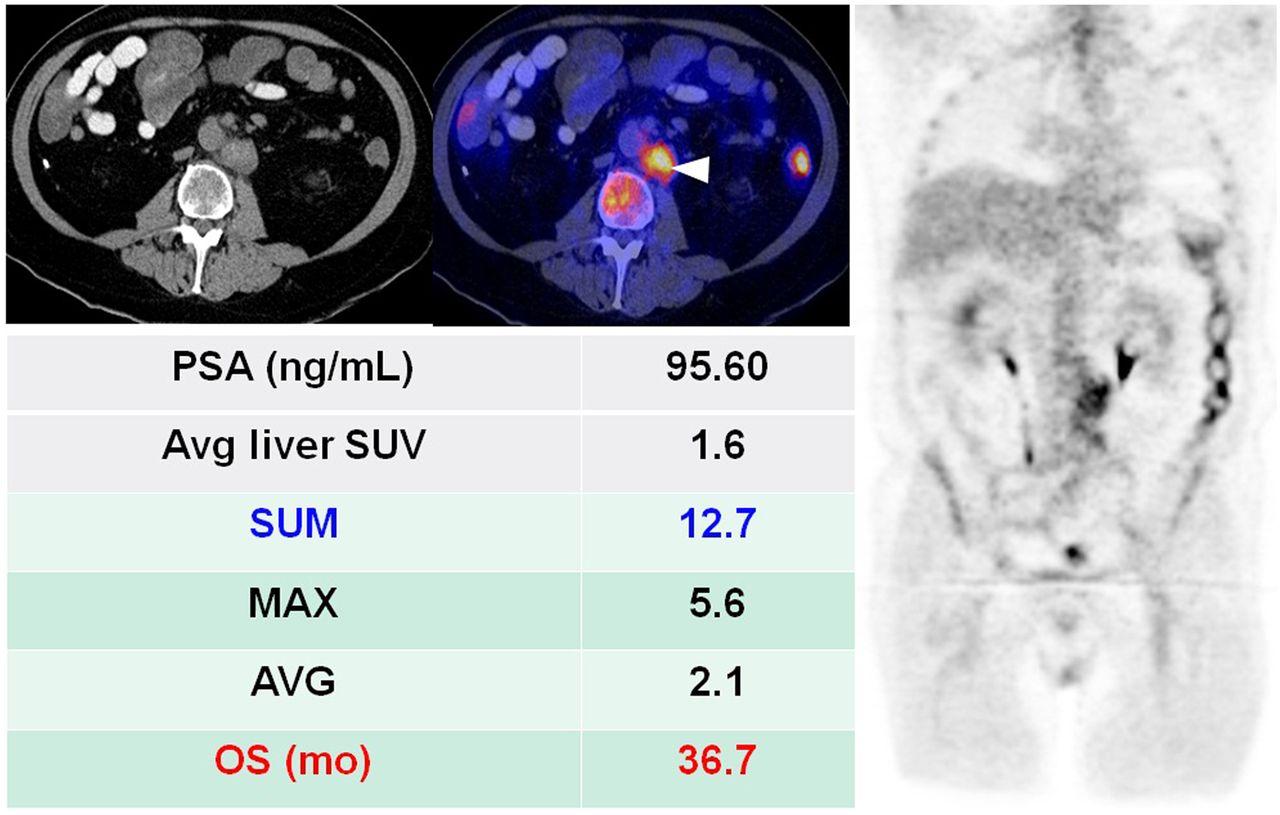
We present 2 illustrative cases with a summary of the corresponding clinical and imaging parameters to highlight the prognostic value of sum of SUVmax. Figure 5 illustrates the clinical case of a man with known castrate-resistant metastatic disease and an elevated serum PSA level of 95.6 ng/mL. In this case, the sum of SUVmax, 12.7, falls in the second-quartile range (3.8–14) and OS was 36.7 mo. In contrast, Figure 6 shows another patient with dedifferentiated castrate-resistant metastatic disease as demonstrated by a low serum PSA level of 0.09 ng/mL. In this case, the sum of SUVmax, 41.5, falls into the fourth-quartile range (28.5–64.8) associated with a short OS of only 9.9 mo.

A 61-y-old man with castrate-resistant metastatic prostate cancer that developed 8.2 y after primary treatment with radical prostatectomy (Gleason 5 + 4) followed by hormonal therapy. 18F-FDG PET/CT (left: abdominal CT only; middle: abdominal PET/CT, right: coronal PET) demonstrated only enlarged metabolically active retroperitoneal lymph nodes (arrowhead). Patient was started on docetaxel chemotherapy. AVG = average SUVmax; MAX = maximum SUVmax; SUM = sum of SUVmax.

A 67-y-old man with dedifferentiated castrate-resistant metastatic prostate cancer who was initially treated with radical prostatectomy followed by hormonal therapy 11.8 y before imaging study. 18F-FDG PET/CT (left: chest PET/CT; middle: brain PET/CT; right: maximum-intensity-projection PET) demonstrated widespread metastatic disease involving bone (lesions in rib and thoracic vertebra [short arrows]), lungs [arrowheads], and brain [long arrow]). AVG = average SUVmax; MAX = maximum SUVmax; SUM = sum of SUVmax.
DISCUSSION
There have been considerable recent strides in experimental drug development for treatment of castrate-resistant metastatic prostate cancer (3). These developments are mainly the result of an improved understanding of the complex biology of the metastatic cascade in prostate cancer (13). Castrate-resistant metastatic prostate cancer is the lethal phase of the disease and can have a greatly varying clinical course among patients, probably reflecting the marked biologic and clinical heterogeneity of the disease (7). In this evolving clinical setting, it is mandatory to know the objective comparative effectiveness of different conventional and novel therapies.
Despite the general prognostic utility of clinical (e.g., performance status) and laboratory (e.g., serum PSA level) parameters, their relative changes may not associate with extent of disease or patient outcome and are thus insufficient for guiding and selecting particular treatments (14). The recent paradigm shift redefining and aligning endpoints in both clinical trials and clinical practice emphasizes the need for a more holistic approach considering the entire relevant disease manifestation (7). Such an approach facilitates objective comparison of various treatment strategies in both clinical research and routine clinical practice. In the clinical context of metastatic prostate cancer, an important benefit to the patient from any intervention strategy is to prolong life (i.e., increase OS), delay time to skeleton-related events, or enhance quality-adjusted life years.
Imaging can be helpful by providing an objective assessment of the extent of disease, response to treatment, and prognosis. In particular, since bone is the major site of disease dissemination in prostate cancer, an imaging-based quantitative assessment of bone metastases in relation to a selected clinical endpoint is critically needed. Moreover, despite active development of new bone-targeted therapies, current standard diagnostic imaging techniques such as 99mTc-based bone scintigraphy and CT are inadequate for accurate measurement of tumor burden (15). An attempt at semiquantitative measurement of bone metastases on 99mTc-based bone scintigraphy (bone scan index) has been reported (16,17). However, the technique has not been widely used and is restricted by the fundamental limitations of bone scintigraphy: indirect imaging of tumor presence, low specificity (false-positives with benign conditions), and low sensitivity (gross underestimation of the true prevalence of bone metastases).
Current evidence demonstrates that PET/CT with 18F-FDG may be useful in direct imaging of metastatic prostate cancer (9). In particular, 18F-FDG PET/CT may be able to distinguish between metabolically active osseous lesions and metabolically dormant lesions and allow assessment of response to therapy, with favorable response depicted as a treatment-induced decline in 18F-FDG uptake by tumor sites in comparison with the pretreatment scan (14,18–20). Little information is available on the prognostic utility of 18F-FDG PET/CT in metastatic prostate cancer before treatment. Meirelles et al. evaluated the prognostic utility of bone scintigraphy and 18F-FDG PET in 39 patients with castrate-resistant disease and 12 patients with noncastrate disease who were followed for at least 5 y or until death (21). The bone scintigraphy studies were analyzed using the bone scan index (17). The SUVmax of the most active bone lesion was used as the outcome measure for the 18F-FDG PET studies. Survival was inversely associated with bone scan index and SUVmax. The median survival of 28.2 mo for patients with a bone scan index of less than 1.27 was significantly longer than the 14.7 mo for those patients with a bone scan index of greater than 1.27. Similarly, the median survival of 32.8 mo for an SUVmax of less than 6.10 was significantly longer than the 14.4 mo for an SUVmax of greater than 6.10. Moreover, in the multivariate analysis, SUVmax was determined to be an independent prognostic factor.
Our study differed from the above investigation in several notable ways. We focused exclusively on patients with castrate-resistant metastatic prostate cancer and as such involved a clinically more homogeneous cohort. Furthermore, rather than concentrating on bone lesions only, our study was more comprehensive and included all sites of metastatic disease (i.e., bone, lymph nodes, and organs) into the analysis. We also included a broad range of parameters derived from 18F-FDG PET/CT for up to 25 lesions. An additional important unique feature of our investigation was the adjustment for other potentially confounding prognostic factors to decipher the independent contribution by the imaging parameters.
Presumably, the parameter that was evaluated by Meirelles et al. (21) was similar to our parameter maximum SUVmax. We found that several of the parameters derived from 18F-FDG PET/CT were associated with OS in the univariate analysis; however, in the multivariable analysis, after adjustment for clinically relevant factors, only sum of SUVmax demonstrated significant independent prognostic value. Sum of SUVmax, by definition, incorporated only those selected disease sites that were metabolically active and as such represented a broad index of the metabolic burden of disease. It was beyond the scope of this study to assess whether sum of SUVmax provides additional unique prognostic information beyond the simple structural extent (volume) of disease (i.e., including metabolically inactive sites), although such an assessment would be interesting. The potential advantage of sum of SUVmax over the SUVmax of a single lesion, or the maximum over several lesions, is that sum of SUVmax is more stable than the maximum SUVmax and incorporates more comprehensively the various metabolically active sites of disease burden. Our observation that the fourth-quartile range of sum of SUVmax was associated with the shortest OS is rationally consistent with the information content that is embedded in sum of SUVmax. Moreover, the moving hazards of death in relation to sum of SUVmax, interpreted as chance of death per person per month, showed a marked upward shift of the curve for sum of SUVmax greater than 20.
Although the pattern is striking, the sizes of the CIs are relatively large compared with the magnitude of the differences between the hazards associated with the lower and higher sum of SUVmax.
A possible limitation of our study was the lack of histologic verification for the lesions in view of constraints imposed by practical, economic, and ethical issues. However, the inclusion criteria demanded that all selected lesions for analysis have correlations on standard imaging as “known” sites of metastatic disease. Although additional follow-up imaging was outside the scope of this analysis, all our patients underwent 3 additional follow-up 18F-FDG PET/CT and standard imaging studies over the course of 1 y for separate research inquiries on the potential role of PET/CT in assessing treatment response, as well as the utility of early and late interval changes on PET/CT in predicting patient outcome. These follow-up imaging studies were used post hoc for additional confirmation of proper initial selection of metastatic lesions. Finally, per the requirements of our Institutional Review Board, the oncologist was informed about the findings on PET/CT but any change in management strategy based solely on PET/CT was left to the discretion of the oncologist.
CONCLUSION
We have demonstrated that sum of SUVmax derived from 18F-FDG PET/CT is a useful imaging biomarker for predicting OS in men with castrate-resistant metastatic prostate cancer. The prognostic value of sum of SUVmax will need further validation prospectively in clinical trials to determine whether it may be useful for selecting patients and assessing the comparative effectiveness of various conventional and emerging treatment strategies in this important clinical setting.
DISCLOSURE
The costs of publication of this article were defrayed in part by the payment of page charges. Therefore, and solely to indicate this fact, this article is hereby marked “advertisement” in accordance with 18 USC section 1734.
Acknowledgments
This investigation was performed under clinical trial registration number NCT00282906 (www.clinicaltrials.gov) and was supported by grant R01-CA111613 from the National Institutes of Health, National Cancer Institute. Study data collection and management were developed using CAFE´ (Common Application Framework Extensible), which was developed at the Kenneth J. Norris Jr. Comprehensive Cancer Center of the University of Southern California, with support in part by award P30-CA014089 from the National Cancer Institute. No other potential conflict of interest relevant to this article was reported. The authors also thank Julia Quillen, Banafsheh Peyvandi, Diana Shycoff, Syed Rahmanuddin, and Jessica Gomez for their administrative help with patient accrual.
Footnotes
Published online Jun. 19, 2013.
- © 2013 by the Society of Nuclear Medicine and Molecular Imaging, Inc.
REFERENCES
- Received for publication September 14, 2012.
- Accepted for publication March 21, 2013.


Jump to section
Related Articles
Cited By...
- Intrapatient Intermetastatic Heterogeneity Determined by Triple-Tracer PET Imaging in mCRPC Patients and Correlation to Survival: The 3TMPO Cohort Study
- A Comparison of 18F-DCFPyL, 18F-NaF, and 18F-FDG PET/CT in a Prospective Cohort of Men with Metastatic Prostate Cancer
- Quantification of Metastatic Prostate Cancer Whole-Body Tumor Burden with 18F-FDG PET Parameters and Associations with Overall Survival After First-Line Abiraterone or Enzalutamide: A Single-Center Retrospective Cohort Study
- Appropriate Use Criteria for Imaging Evaluation of Biochemical Recurrence of Prostate Cancer After Definitive Primary Treatment
- Prediction of Time to Hormonal Treatment Failure in Metastatic Castration-Sensitive Prostate Cancer with 18F-FDG PET/CT
- PET of Glucose Metabolism and Cellular Proliferation in Prostate Cancer
- What Medical, Urologic, and Radiation Oncologists Want from Molecular Imaging of Prostate Cancer
- A Phase I/II Study for Analytic Validation of 89Zr-J591 ImmunoPET as a Molecular Imaging Agent for Metastatic Prostate Cancer
- PET/MR Imaging: A Critical Appraisal
- Stand Up to Cancer Phase Ib Study of Pan-Phosphoinositide-3-Kinase Inhibitor Buparlisib With Letrozole in Estrogen Receptor-Positive/Human Epidermal Growth Factor Receptor 2-Negative Metastatic Breast Cancer
- Molecular Imaging of Prostate Cancer with PET