


Abstract
Assessment of important clinical and economic outcomes has become central to the evaluation of patient care. Outcome research is deeply rooted in epidemiology, including the use of multivariable, risk-adjusted regression analysis. In our current health care environment, these methods are increasingly being used to assess the quality of care and to profile physicians and laboratories. Nuclear medicine physicians therefore need to better understand outcome methodologies in order to evaluate patient outcomes, develop guidelines, and decide on patient management. Methods: This review describes the methods of assessing the diagnostic and prognostic value of nuclear medicine techniques and, briefly, the methodologic limitations of sample size, frequency and type of events, and follow-up periods and the incremental value of imaging. Also described are logistic regression and Cox proportional hazards modeling. Models for risk assessment are designed to identify whether patients require conservative (i.e., low-risk) or aggressive (i.e., high-risk) treatment. Treatment selection is currently based on risk assessment and the formation of an integrated, empiric risk stratification algorithm of care. This review also includes the methods of assessing economic effectiveness and quality-of-life issues for patients examined with nuclear medicine techniques. Conclusion: In this era of constrained resources, low-cost outpatient-based care may be of increasing importance. High-quality evidence of the clinical and economic outcome of nuclear imaging is essential for helping health care providers and payers assess its value.
Since 1950, the death rate from coronary artery disease (CAD) for patients < 65 y old has steadily declined in the United States and other developed countries (1,2). A major contributor to the decline has been the availability of new technology and therapeutics, which have resulted in a 35%–50% proportional risk reduction and marked improvements in quality of life (QOL) (1–3). Dramatic advancements in life-saving treatment have also been associated with the reduction in mortality but have contributed to the high cost of care. In this cost-conscious era, the challenge is to define a balance between improved assessment of outcome and constrained expenditure of resources.
Outcome assessment originated in the work of Donabedian (4), whose definition of health care quality included the components of structure, process, and outcome. Early indicators of health care quality used structural components to judge the value of a health care system (e.g., the indicator used by the Joint Commission on Accreditation of Healthcare Organizations). Over the last 2 decades, a body of evidence has developed focusing on the use of process and outcome measures to assess the quality of health care. Several factors have forced a paradigm shift in medical care that uses such measures to judge the quality and appropriateness of patient care.
As health care spending has continued to increase at rates disproportionately higher than inflation, health care rationing increasingly has guided the use of many resources. To ensure a given level of quality health care within a resource-constrained environment, evidence-based medicine has become the new standard on which clinical appropriateness is judged. In this era, a threshold of evidence increasingly has guided justification for the use of any given procedure. Historically, randomized-trial data were the standard for patient management. With the introduction of patient care guidelines, randomized-trial evidence is not available for every clinical question, thus hindering the development of care pathways (5–9). Furthermore, patient selection in large randomized trials often represents at most 10% of similarly at-risk patients, thus restricting the ability to generalize among study findings. Accordingly, for much of guideline development, risk-assessment methodologies have focused on the use of registry and observational data to guide patient management strategies. With the increasing use of nonrandom patient selection, the use of rigorous statistical methods and risk-adjustment methods is gaining importance in outcome assessment.
When this paradigm of outcome assessment is used to guide patient management, the body of evidence on risk assessment and subsequent treatment selection is viewed within the construct of theoretic issues based in cardiovascular epidemiology. Throughout the remainder of this article, we describe appropriate methods as they relate to outcome assessment, especially screening strategies for heart disease. This article provides a methodologic perspective on risk assessment, with particular emphasis on statistical methods, endpoint analysis, and pitfalls for prognostic analyses.
THEORETIC CONSTRUCTS WITHIN RISK ASSESSMENT
Although risk stratification determines whether a given outcome of interest is an important estimator of outcome, the words predictive and explanatory often are overused or misplaced. Because of the limitations of current research techniques, one does not always predict a given outcome with an analysis (10–23). Probability values represent a level of certainty around the statistical result, such that a low probability value (P < 0.05) indicates a minimal likelihood that the results are caused by chance but reflect a real change in clinical values (11,12). In addition to the probability value, each variable in a multivariable model has an SE or SD around the parameter estimate or coefficient. This error may be wide in smaller populations or for those variables that occur infrequently, thus reflecting the instability of the estimate. All of these factors limit the use of the word predictive.
A similar set of explanations is used to clarify the word explanation. Because current databases were designed several years ago, they often do not mirror all of the complexities of current clinical decision making. Furthermore, because of the breadth of information called for, they often cannot answer all of the questions relevant to clinical practice. Thus, one is often unable to explain many of the differences accounted for in a predictive model.
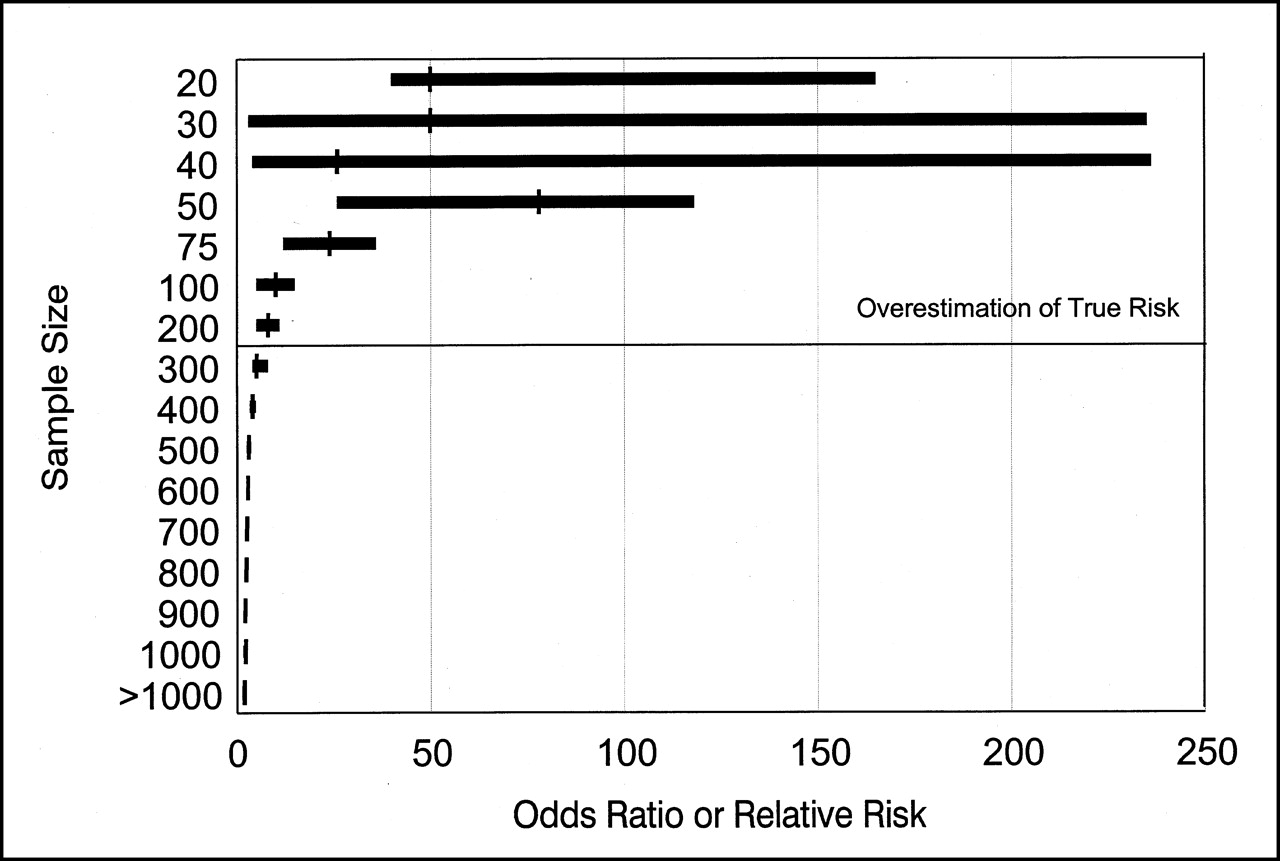
A second limitation to consider is the possibility of false-positive or false-negative results. A disadvantage to the use of smaller sample sizes is that a loss of statistical power occurs and increases the likelihood of false test results (23). Small samples lead to an overestimation as a result of publication bias (Figs. 1 and 2). For smaller sample sizes, the risk of an event is overestimated, with declines in the estimated risk of an event as the sample size increases. Further, if statistical analysis is performed as subgroup analysis, there is an additional likelihood of insufficient power to detect differences. To minimize the possibility of false-positive results, one needs to explain the majority of differences in a prognostic comparison. Because unaccounted-for variability is often present in a given multivariable model, the possibility of a false-positive result should always be considered. Errors often cannot be detected with mathematic reasoning but can be pursued only through clinical consideration of outcomes in relation to the remaining body of prognostic evidence. A false-negative result may be present when published strata are similarly distributed in the compared cohorts but are affected differently by the comparison of interest. When multivariable risk-adjusted techniques are not used, erroneous conclusions are frequently drawn about a given analysis. Another example may operate in which both comparative groups may be significantly different by outcome but not by a varying etiology or by varying prognostic subgroups (e.g., interaction term) (10–23).
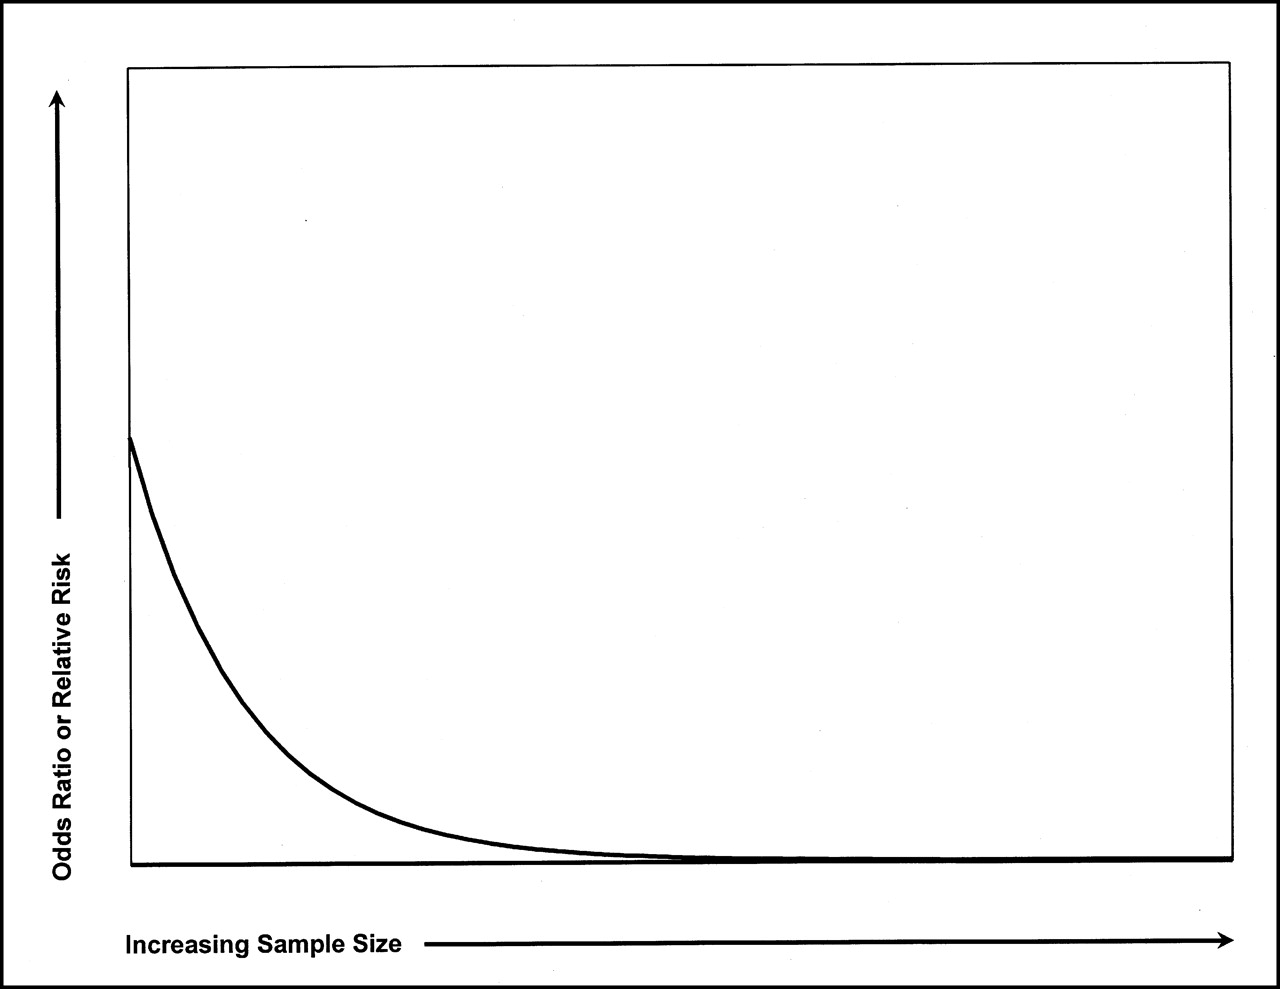
Relationship of sample size to odds ratio. Overall reduction in odds or relative risk of event accompanies increasing sample size.
A large body of evidence on risk stratification has been published to support, enhance, or mirror daily clinical decision making (23). The explanation of true differences by outcome often begins with an observed discrete comparison of 2 selected patient characteristics (e.g., high- and low-risk patients) (23). From a database, clinical researchers seek to identify polar strata of high- and low-risk patients whose outcomes of interest are markedly different. In daily clinical practice, physicians often operate using heuristics or general rules of thumb (23). For example, ST-segment depression occurring at >stage III is less predictive of worsening survival than that occurring at ≤stage I of the Bruce protocol. Risk stratification that focuses on dichotomizing or trichotomizing a population limits the value of a given clinical characteristic (11,12,23). Use of a continuous measure enhances statistical estimation over categoric variables (19–21). However, clinical practice mandates the development of easy-to-use clinical strata. Thus, although a variable may be less statistically significant in a model, it may be implemented more often because of its ease of use in daily clinical decision making.
When the focus is on identifying a high-risk cohort (researchers often attempt to be overly sensitive and inclusive), a higher than expected false-positive rate or a drop in specificity can occur; optimizing sensitivity results in a drop in specificity. An example of this reasoning can be observed in the existing data on the diagnostic accuracy of stress imaging. In the development of new imaging techniques over the last 20 y, the focus has been on the positive predictive value of abnormal test results. Thus, the focus on the event rate in abnormal test results leads to an enhanced sensitivity for disease detection but also, at some threshold, to loss in specificity. All clinical tests have limitations that rise above a given modality. All techniques misclassify or misrepresent the true state of the disease and abilities of a given test, particularly if referral patterns vary from accepted standards. The use of test accuracy statistics is problematic because of an overestimation resulting from verification bias, publication bias, and the use of univariable outcome estimation.
MAJOR FACTORS IN OUTCOME ASSESSMENT
Evidence from a prognostic analysis should be evaluated using several methodologic and clinically important guidelines (10–23). First, the analysis must be considered given the available scientific evidence. Second, the analysis should consider whether the alternative hypothesis (i.e., no difference in outcome) is possible in the identified population (10–23). For example, predictive diagnostic models in catheterized patients may vary considerably from models in a noncatheterized population. In this case, the validation of study results is an important part of model development (19–21). Model results should be validated in differing populations to determine the degree to which study findings can be generalized (19–21). Third, the analysis should consider all of the important covariates that determine outcome (Table 1) (19–21). Failure to consider important clinical covariates may produce misleading results (11,12,23). If true clinical presentation and baseline risk differ, clinicians may need to develop separate guidelines for testing and treatment (23). Fourth, the outcome of interest should be appropriate for the study question (11,12). There may be varying strategies for treatment aimed at risk reduction of any major outcome (i.e., myocardial infarction or cardiac death).
Important Historical Variables Used in Diagnostic and Prognostic Risk Assessments
In numerous prior outcome reports, combined endpoints have been used, despite the fact that individual endpoints may vary considerably in their risk markers (11). For example, a combined outcome cardiac death or myocardial infarction is a frequent outcome of interest, with evidence to support the fact that predictors of death vary considerably from predictors of myocardial infarction. Thus, the combination of these outcomes may result in a “mismatch” of outcome variables, making it difficult to discern which factor (i.e., myocardial infarction or death) is being estimated by which clinical covariates. Conversely, it is important to acknowledge that both outcomes are important events in the life of a patient with coronary disease. The development of predictive models estimating myocardial infarction and cardiac death separately is limited by statistical techniques. Commonly applied time series analyses censor or withdraw patients when they are lost to follow-up. One assumption of Cox proportional hazards models or Kaplan-Meier survival analyses is that censoring is unrelated to the endpoints. When myocardial infarction is estimated, patients with cardiac death must be censored at the time of any event, thus violating this assumption. The reason for patient withdrawal from a time-series analysis should be unrelated to the endpoint. In other words, these 2 events (death and myocardial infarction) are not unrelated and, given current statistical techniques, separating the 2 events to predict myocardial infarction alone is difficult. However, assessing models incrementally is important, and a cardiac death model may be developed. This is followed by the development of a cardiac death or myocardial infarction model. Differences in predictive estimates between these 2 models may be ascribed to the outcome myocardial infarction, which may be similarly applied to death, myocardial infarction, unstable angina, or the need for coronary revascularization, to name a few. Separating the outcomes death and myocardial infarction is important because coronary revascularization may reduce the risk of death but not the risk of myocardial infarction (24). Thus, if risk assessment can predict a low death rate in patients with manageable symptoms, medical management may be warranted.
ASCERTAINING CLINICAL ENDPOINTS
To understand outcome assessment, one must understand the factors related to cardiac events (25–33). Precipitating factors in coronary events include sudden changes in atherosclerotic plaques that accompany fissuring, platelet adhesions, aggregation, thrombus formation, and vasospasm. Plaques that rupture tend to have thin caps, are rich in lipids and macrophages, and do not necessarily occur at the site of a critical coronary stenosis (27). In fact, the results of a study (29) suggested that a large number of underlying lesions responsible for unstable angina or infarction were insignificant angiographically before the final event. Thus, the prediction of coronary events is imprecise if it relies solely on anatomic markers of coronary disease. Diagnostic, prognostic, and therapeutic strategies targeted only at anatomic disease endpoints would seem unlikely to predict and thereby prevent acute coronary syndromes and ensuing long-term prognosis.
An outcome is often expressed as a dichotomy. However, many outcomes are not interpreted similarly, despite their presence or absence. Myocardial infarction is an example of an outcome that varies considerably in its clinical interpretation (34) Patients with smaller creatine kinase leaks, non–Q-wave myocardial infarctions, or inferior myocardial infarctions are viewed by physicians differently (with varying treatments) from patients with larger rises in creatine kinase or anterior myocardial infarctions. Definitions for myocardial infarction also vary, depending on whether it occurs perioperatively or as a reinfarction (34,35). Thus, if myocardial infarction is one of the primary endpoints in a trial, the differences in size, type, and severity of myocardial infarctions need to be considered.
Varieties of clinical endpoints are in common use in prognostic analyses and include hard and soft endpoints (3,11,12,19–21). Although definitions of cardiac events are a major source of variation in clinical research, data dictionaries have been developed by medical societies to standardize variable definitions within and across databases. Accepted hard events include death and nonfatal myocardial infarction. Although nuclear cardiology risk measures may enhance estimation of cardiac mortality, total or all-cause mortality is an important issue for referring physicians. When all-cause mortality is estimated, measures of comorbidity (e.g., vascular disease history or diabetes), as well as disease extent, may increase outcome estimation. By comparison, specific historical measures related to coronary disease (e.g., prior myocardial infarction) may enhance detection of cardiac mortality. Soft events include worsening angina or other QOL measures, heart failure, and the need for hospitalizations or coronary revascularization. The inclusion of worsening angina or heart failure and the need for coronary revascularization as endpoints is subjective, with indications and definitions varying widely. Recently, standardized questionnaires have been developed for the assessment of patients’ symptoms to increase the reliability and validity of such measures (3).
EVALUATING PATIENT WELL-BEING AS AN OUTCOME
Despite significant improvements in life-prolonging treatment over the past few decades, the overall quality of a patient’s life may vary considerably depending on treatment (3,24,36–46). Assessment of QOL complements the more traditional sources of information for evaluating clinical care by providing a more comprehensive evaluation of the patient’s health state. Health-related QOL is defined by its application to well-being and satisfaction associated with how an individual’s life is affected by disease, accidents, and treatment. QOL assessment may aid in describing the overall health and well-being of a population or patient subset, tracking treatment efficacy, and estimating worsening clinical status and ensuing patient death (24,36). QOL has become an important and essential outcome variable in the evaluation of interventions and is considered a significant endpoint of medical care. The focus of caring for patients with coronary disease is not to cure but rather to manage chronic disease by alleviating symptoms, improving functional capabilities, and retarding disease progression.
To use QOL as an endpoint, the type of tool should relate to the outcome of interest. If the analysis focuses on general mortality (i.e., all-cause) models, then general QOL measures may be useful. In the area of coronary disease, the 2 most commonly explored components are physical functioning (or activities of daily living) and cardiac symptoms.
Overall, evaluation of global aspects of QOL may be described with 4 domains that are highly relevant for CAD patients: physical, functional, emotional, and social domains (3,36,40). The physical domain refers to perceived alterations in body function and includes both disease symptoms and side effects. The functional domain refers to the ability to perform activities of daily living and responsibilities at home and work. Measuring both physical and functional dimensions is important, because heart disease patients with more sedentary jobs may be able to continue performing adequately at work despite great discomfort from either symptoms or side effects of treatment (3,36,40). There are several standardized and validated instruments for symptom assessment, such as the Seattle Angina Questionnaire (for serial symptom evaluation), the Rose Questionnaire (for symptom diagnosis), and the commonly used Duke Activity Status Index (for physical functioning) (41–43). The Canadian Cardiovascular Society Functional Classification is another measure that focuses on the severity of angina. Nearly 3 decades ago, the New York Heart Association Functional Classification was introduced to assess the effects of cardiovascular symptoms on activities of daily living (44). In the Nottingham Health Profile (45), the presence of chest pain symptoms and anxiety had the greatest impact on a patient’s overall QOL scores. The ability to exercise (e.g., timed distance walk) has become a measure of a patient’s functional status, as have questionnaire responses detailing a variety of activities of daily living (24,37,38,40,42,47). Another domain of QOL is emotional functioning (e.g., depression). Finally, social functioning is the final QOL domain and refers to maintaining satisfying relationships with family and friends. In general, few QOL data are available on how nuclear medical testing may affect a patient’s QOL (47).
Tracking QOL may aid in clinical decision making on the timing of testing and the initiation of therapies that can enhance activities of daily living for CAD patients. For example, therapies aimed at reducing angina may help improve angina-limiting activities. Tracking anginal thresholds for activity may be an important component within functional capacity. Recent evidence on the benefits of coronary revascularization therapies on QOL has been reported from the Bypass Angioplasty Revascularization Investigation (44). This report indicates that both coronary bypass surgery and percutaneous coronary intervention provide important improvements in functional status in patients who were previously limited by anginal symptoms. From the Emory Angioplasty Surgery Trial (43), 3-y outcomes revealed that patients undergoing percutaneous coronary intervention were more likely to take antianginal medications and to have worse functional status, less complete recovery, and more hospitalizations for chest pain than were patients undergoing coronary bypass surgery.
Generally, one must view QOL outcomes as they relate to processes of care (i.e., test use) and “hard” outcomes. The processes of care (e.g., completeness of revascularization, drug compliance, or nuclear imaging use) are significant determinants of patient well-being. In many cases, the quality of a patient’s life is considered within the quantity of available living years (i.e., quality-adjusted life-years). Quality-adjusted life-years are determined from the product of the quantity-adjusted life-years by some utility measure of the QOL. A utility score includes a range of quality estimates, commonly extending from 0.0 for death to 1.0 for perfect health (41)
METHODS OF OUTCOME ASSESSMENT
Over the past decade, the rigor with which statistical techniques are applied in clinical trials and observational databases has increased tremendously. Statistical power, model overfitting, regression diagnostics, and survival analysis are a few of the areas that have greatly improved (10). To illustrate the development of statistical techniques, for example, one need only examine the area of diagnostic testing.
In years past, published reports focused entirely on the sensitivity and specificity of testing, using small, single-site referral populations (11). Because the decision to perform cardiac catheterization is not based solely on the results of a stress test, the resulting calculations of test accuracy are severely biased. Subsequent biases in referral, publication, and lack of statistical power lead to significant heterogeneity in the study results (11–13). Acknowledgment of bias in these estimates has led some researchers to obtain a normalcy rate for patients not proceeding to cardiac catheterization; however, these estimates are still univariable, unadjusted calculations (11). In our experience, because of persistent symptoms or because physicians lack confidence in the test results, approximately 5% of patients with normal test results proceed to cardiac catheterization within 3–6 mo after the test. Unless the study protocol mandates cardiac catheterization (and most do not), the test accuracy values misrepresent the true value of the test. Formulas for adjustment of verification bias have been proposed (e.g., Beggs-Green) but are not uniformly applied (11). The bias in accuracy statistics resulting from patient work-up has prompted many to advocate the use of prognostic measures instead of test sensitivity and specificity (10–23).
In addition to the bias associated with patient work-up, small patient series may also overestimate test accuracy. Many recent reports have expanded databases from single-site, small series of patients to larger populations (i.e., >500 patients) so that differences across individual hospital populations can be examined and so that sophisticated regression methods can be used to identify key predictors of both combined cardiac endpoints and individual endpoints, such as cardiac death (48–60). The development of large, multicenter databases has produced predictive estimates that vary from those reported for smaller patient series of years past (48). In smaller series, for example, the presence of a fixed defect alone was not considered to be as prognostically important as was a reversible defect (11). However, in recent larger single-site and multicenter registries of stable angina patients, the extent of fixed defect involvement was the single greatest predictor of cardiac death and the extent of ischemia showed enhanced ability to predict myocardial infarction (48,51,53,56). This discordance may be explained by the predominant use of combined endpoints in earlier series and the more recent focus on predicting cardiac death alone. It is understandable that the extent of infarction, ventricular dysfunction, and fixed defects would be highly predictive of subsequent cardiac death. This has been repeatedly shown in several large multicenter trials noting the inverse relationship between mortality and left ventricular ejection fraction (53,59). This discordance also represents the way in which the use of combined endpoints may misrepresent the underlying differences and predictors within any of the individual outcomes.
Whether using a logistic model or the Cox proportional hazards model for risk assessment, one may decide to develop a model with a stepwise or individual variable-of-interest method. It is important that the selected variables be clinically applicable and based, in part, on prior research. Furthermore, the number of variables selected relates to the number of events that occur in the patient series.
Another salient step in model development is consideration of the sample size and the available power to detect true differences in risk in the patient cohort, provided such differences truly exist. Power is by definition the ability to detect true differences in a given cohort of patients if such differences exist. In the planning of an observational study, the size of the patient series relates to the ability to show some predictive power or to have a desired accuracy of estimation from the model. In small samples with limited power, the estimation is less than for larger samples. A review by Harrell et al. (10) describes model development in detail, relating issues of statistical power to aid the reader further in this area.
Regardless of the method selected, variables evaluated for inclusion should reflect patient presentation and daily clinical decision making. For example, in a risk model evaluating the utility of nuclear imaging, historical risk should be assessed before the added value of nuclear risk markers is evaluated. One may then decide to enter univariable predictors individually or by means of a stepwise procedure. Candidate variables for a multivariable model should include those with a probability value that is <0.20. The final model should include significant variables (i.e., P < 0.05), unless the hypothesis is to consider other variables (i.e., a negative study). It is helpful to validate the model findings in varied patient populations as a model is developed in a given test population, to enhance the generalizability of study findings. It is also important to perform regression diagnostics to consider the influence of outliers, if a given variable requires transformation, as well as to consider any interaction terms (e.g., female diabetic patients).
In Cox models, one must carefully consider whether the proportional hazards assumption has been met, that is, that the survival for the comparative groups is proportional. This proportionality may be viewed in a survival curve that proportionally decreases over time. A violation of this assumption is observed when early (e.g., in-hospital) and later outcomes occur, resulting in a crossing of the comparative survival strata, a violation of the assumption of the proportional hazard.
For most models developed on registry data or based on secondary analysis of randomized trial data, unaccounted-for variability is often seen. For example, exceedingly low R2 or concordance indices are common. In the case of the former, the explained variance often ranges from 0.2 to 0.4, indicating that the model explains only 20%–40% of the variability in estimating outcome. Furthermore, a concordance index rarely exceeds 0.75 (range, 0–1.0, with 0.5 reflecting chance). The receiver operating characteristic areas under the curve and concordance indices are interpreted similarly, reflecting how well the model classifies the outcome of interest (10–23).
An increasing limitation to all prognostic analyses that has yet to be thoroughly explored and underlies all prognostic analyses is the attempt to explain prognosis from the point of view of the natural history of disease (23,48). As physicians increasingly use test information to guide posttest decision making—for example, as a gatekeeper to the cardiac catheterization laboratory—the accuracy of the test in predicting clinical outcome declines. The reason is that patients with abnormal test results will undergo intervention and will have an improved outcome because of the subsequent posttest management. Thus, a patient who has severely abnormal findings on the perfusion scan and undergoes coronary bypass surgery can be expected to have an improved prognosis because of the surgery. However, the positive predictive value will be less than for an untreated patient, whose clinical outcome will likely worsen. This type of reasoning reflects appropriate aggressive cardiovascular management of a high-risk patient. Thus, the calculation of outcome in relation to test results should consider treatment that alters survival or event-free survival. The recent dramatic decline in mortality relates in large part to early and aggressive primary and secondary prevention strategies that alter the natural history of CAD. In reality, the optimal analysis may not be prognosis but the proportional therapeutic reduction in risk observed early and treated promptly. Thus, a paradigm shift in analytic strategies will need to be developed if one is to examine this type of disease management.
RISK ADJUSTMENT METHODOLOGIES
If clinically important differences in outcomes are to be ascertained, analyses must control for underlying differences or a predisposition to differing important cardiovascular outcomes (18–21). If the comparison of interest is a test, then the underlying risk in the population must be controlled for or adjusted for by some form of baseline risk adjustment before the results of an analysis are explored. To remove or reduce the effects of prognostic heterogeneity and to explore a given alternative hypothesis (i.e., no significant difference in outcome), one can divide the identified cohort into homogeneous subgroups that are similar in their prognostic expectations, or one can compare heterogeneous pooled patient cohorts using well-established multivariable regression modeling techniques (23). The latter strategy focuses on leveling the playing field to elucidate true differences between the comparative groups of interest (18). In such an analysis, a series of historical and physical examination parameters may be entered into a multivariable model (either individually or in an aggregated index) (19–21).
Each patient subset has important and unique considerations for the development of outcome models. For example, if one is examining differences in outcome between male and female patients, one can enter all clinical history variables, as well as sex, into a multivariable Cox model to predict survival (19–21). When all other clinically important survival predictors are considered (Table 2), if sex differences persist, the possibility exists that true biologic, sex-related differences or treatment-related differences may be operating in this population. Other important nonclinical factors include sociologic, psychologic, ethnic, financial, or personal preferences of patients, physicians, and practice settings. Failure to consider all of the unique contributors to an outcome leads to unaccounted-for variability in the analysis.
Major Pathways for Risk Assessment in Decision Making in CAD
APPLICATION OF RISK-ADJUSTED METHODOLOGIES
Risk-adjusted analyses should allow for baseline risk adjustment using a well-developed and validated set of clinical criteria that can be generalized to a wide population of similar patient cohorts. Researchers at Duke University have developed a set of clinical history and physical examination parameters to estimate a patient’s risk of significant CAD, severe CAD, cardiac mortality, and operative mortality (Table 1) (19–21). Cardiac risk factors and the type of chest pain symptoms predominate in the significant-CAD model, whereas congestive heart failure symptoms, peripheral vascular disease, history of prior myocardial infarction, and the length of symptoms are strong predictors of cardiac mortality. Although developed from data from catheterized patients, these models have been validated in referral patient populations and community hospital populations. Major prognostic factors affecting outcome with noninvasive testing parameters are reported in Table 3. Consideration of the historical and noninvasive parameters estimating outcome will aid in developing accurate outcome models (Fig. 3).

Plot of odds ratios in relation to patient sample size from series of published reports. These results indicate that with increasing sample size, odds ratio reduces and stabilizes. Stabilization is reflected by more similar odds ratios and narrower confidence intervals. (Adapted with permission of (12).)

Cumulative hazard rate (death rate per year) during 4-y follow-up based on presence of ischemia as found by stress myocardial perfusion imaging.
Major Prognostic Factors Affecting Outcome from Noninvasive Testing
INCREMENTAL MODELING STRATEGIES
The incremental value of new clinical information is of primary importance in this era of cost-conscious medicine (48,49,51,54–56,60). Therefore, a strategy of optimizing outcome detection at each clinical assessment should be developed (Fig. 4) (60). Such a strategy will promote resource efficiency by optimizing use of the least expensive strategies and then selectively using increasingly more expensive resources, with fewer patients receiving the most costly tests or procedures. If outcomes are optimized at each juncture, only high-risk patients are referred for additional medical care, thus enriching the populations with patients whose underlying risk is increased and whose need for treatment is higher than that of patients not referred.
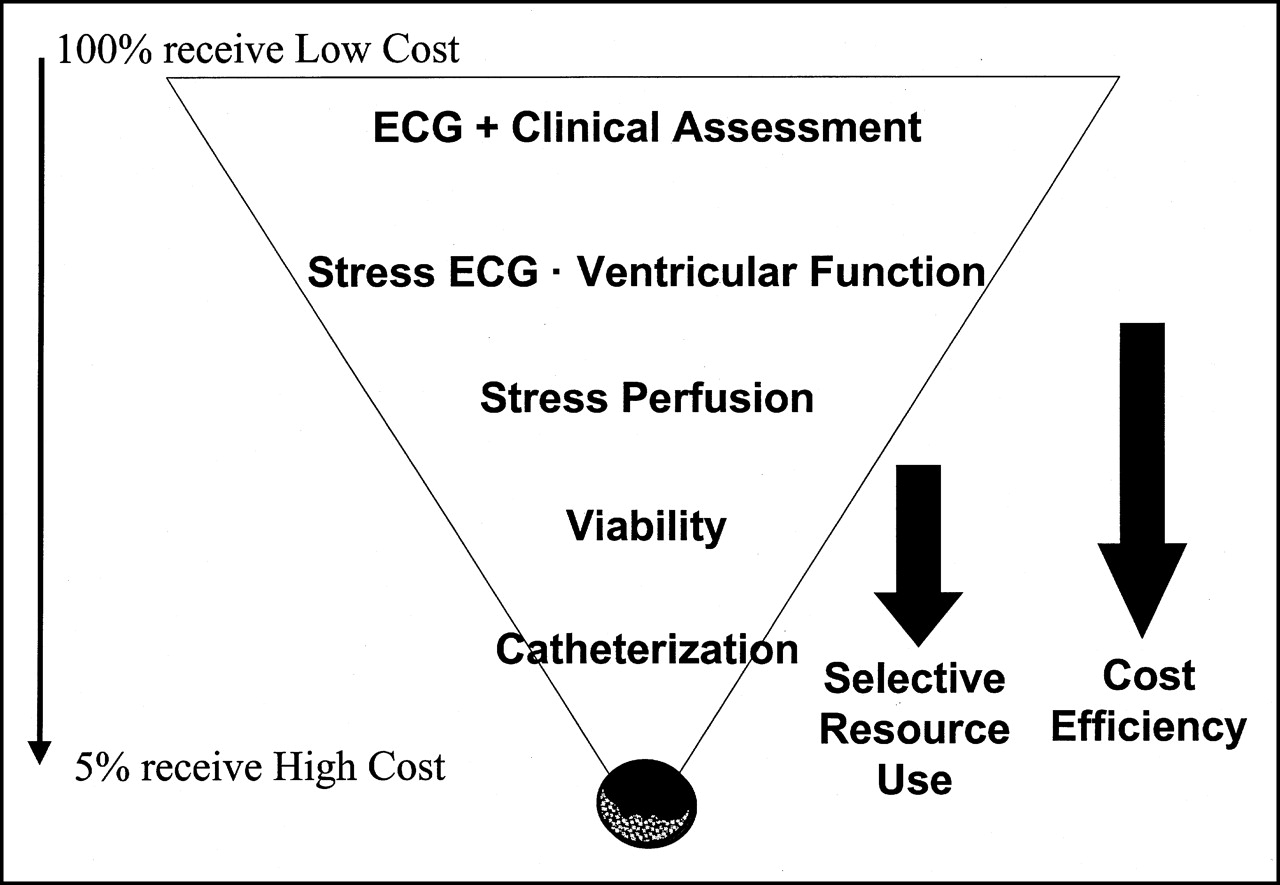
Strategy of medical resource use for evaluation of at-risk patients in cardiology. Patient flow is depicted as funnel, with risk assessment limiting further evaluation by higher cost tests to only those patients at greatest risk. ACE = angiotensin-converting enzyme.
Figure 4 shows a common diagnostic strategy for evaluating patients with chest pain. This assessment is analogous to a funnel in which most patients are evaluated at the top and fewer patients are evaluated toward the bottom. In a medical center, an outpatient clinic could represent the top and an angiography suite the bottom. Initially, all important clinical history and physical examination parameters are evaluated and integrated into an overall impression of the patient’s likelihood for coronary disease. Low-risk patients require only watchful waiting, whereas high-risk patients may proceed directly to cardiac catheterization. Intermediate-risk patients benefit maximally from further evaluation with noninvasive testing (either imaging if they have resting ST-T–wave changes or exercise treadmill testing if their resting electrocardiography findings are normal). In this example, by optimizing the clinical history we have provided a way to use the more expensive technology selectively, save costs, and enhance outcome detection.
In database analysis, estimating the percentage of improvement using diagnostic (receiver operating characteristic areas) or prognostic (change in χ2 or concordance index) regression analyses is also important (10). For example, after the contribution of comorbid conditions is considered, how much information is gained when nuclear imaging is added to a model estimating mortality?
VARYING TREATMENT SELECTION BY RISK
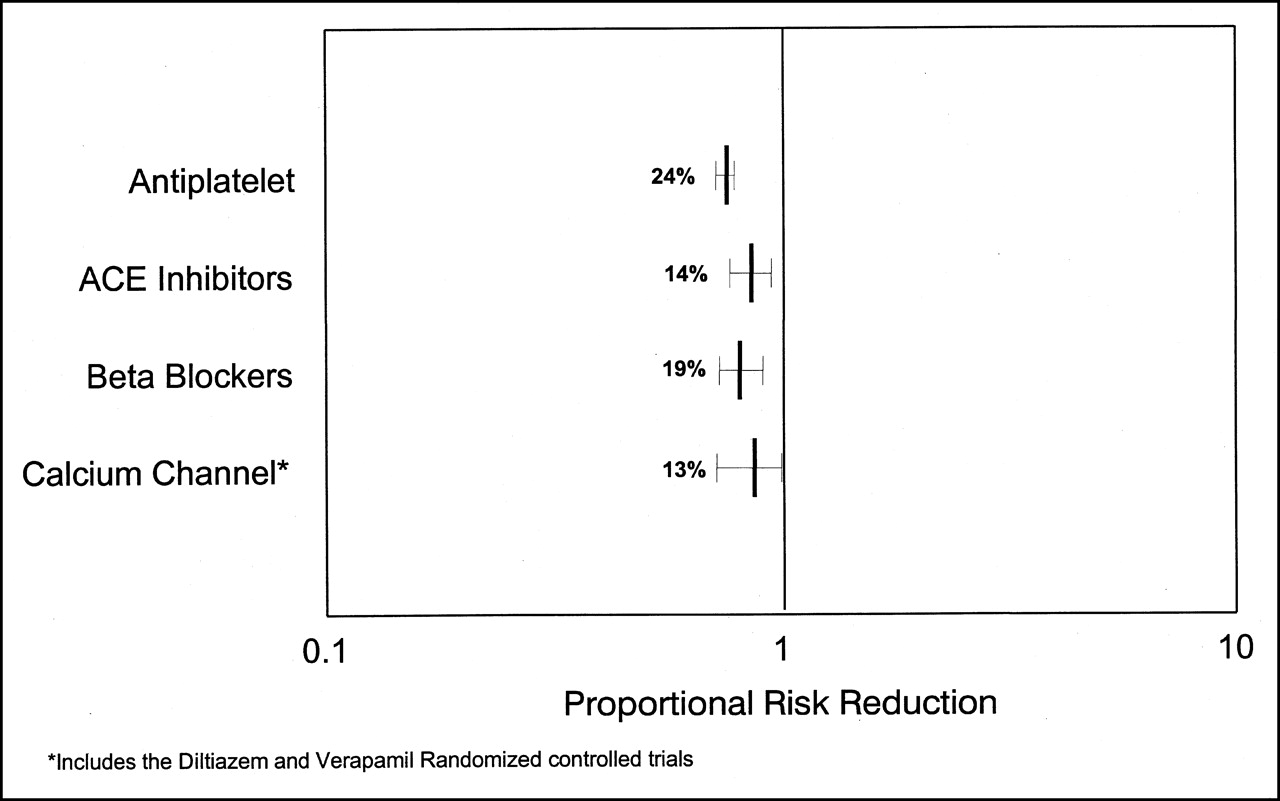
Over the last 2 decades, both medical and surgical therapies aimed at risk reduction have dramatically affected patient outcomes. In general, a review of secondary prevention trials reveals that most have had a moderate effect on proportional risk reduction, ranging from 10% to 25% (Fig. 5) (36). Highly effective therapies (e.g., coronary artery bypass surgery) often exhibit more dramatic results, with risk reductions of 25%–50%. For example, secondary prevention trials of lipid-lowering and antiischemic therapy and risk-assessment studies of regular exercise have shown a reduction of risk over standard treatment (23,61–68). When trials consider additional endpoints, the proportional risk reduction increases. For example, evidence from the Physician’s Health Study (63) on the survival benefits of aspirin revealed that the risk of a first nonfatal myocardial infarction might be reduced by 87%. For unstable angina, 4 randomized trials have shown that the use of aspirin reduced mortality and reinfarction rates by approximately 50% (64). Authors of the Simvastatin Survival Study reported that patients receiving a cholesterol-lowering agent experienced a 70% reduction in major cardiac events (65).

Metaanalysis of proportional risk reduction for secondary prevention trials in patients with known coronary disease.
Using evidence from clinical trials, one can devise nuclear risk-assessment models to glean insight into streamlining effective therapeutic intervention and risk reduction. Data reported by Dakik et al. (66) and Mahmarian et al. (67) revealed that the risk of subsequent cardiac events may be reduced in patients with evidence of provocative ischemia on quantitative myocardial perfusion imaging. This paradigm of treatment altering risk has been reviewed by O’Keefe et al. (68). From this paradigm of risk assessment, one may develop an empiric basis for treatment, with aggressive management used for patients at higher risk and watchful waiting used for patients at lower risk. However, one should remember that any given patient will receive multiple therapies, thus limiting application of trial evidence in daily clinical decision making. Using this information, one may more effectively guide therapy to reduce the risk of important cardiovascular events in high-risk patients. A risk-based model for testing and treatment was advanced in a conference on secondary prevention (69). The model described a method for targeting or tailoring intervention on the basis of risk in the patient cohort. Diverging from past therapeutic strategies that identified key clinical or diagnostic characteristics associated with effective intervention, this type of strategy is based on outcome data and the proportional risk benefit received by various patient subsets.
BALANCING BENEFITS OF HIGH-QUALITY CARE WITH ECONOMIC CONSTRAINTS
Important cardiac outcomes are usually expressed in clinical terms yet often have enormous economic implications for the patient, hospital, provider, and society (70–82). Although clinical research has largely examined clinical outcomes, recent research has focused on the economic implications of various disease management strategies. In years past, physicians had free reign in patient management. However, because of uncontrolled and excessive increases in the cost of medical care, concern has been increasing over the type, quality, and delivery of such care in the United States. Over the last decade, we have seen attempts to ration our finite health care resources. Resource use has focused on balancing constraint with a need for high quality. In economic terms, resource use is the quantity of societal investment needed to achieve a given health status (70–82).
The U.S. Public Health Service has recently released guidelines for establishing the cost-effectiveness of medical therapies (70,71). Similar guidelines and recommendations for the interpretation of economic analyses have been reported in the general medical and cardiology literature (73,75). The goal for all of these guidelines is to standardize the analysis and presentation of economic data as they relate to health care technologies and therapies. In large part, this evidence has grown from an understanding that clinical efficacy and the resultant practice patterns (e.g., resource use) are often divergent. Thus, although approved therapies are uniformly effective (or at least equivalent to one another), the resultant downstream change in resource use may be less intuitive given the upfront change in clinical status caused by the therapy.
Alternative approaches to treatment or testing in CAD are often evaluated through a comparison of varying decision-making strategies (12,70–82). In cost-effectiveness analysis, one adds the element of medical effectiveness and determines the cost per unit of outcome. Incremental cost-effectiveness is calculated as the cost change divided by the outcome change, in comparing test A with test B (70–82). General medical decision making assumes that adding information (through new therapies or screening tests) adds value to or improves diagnosis or prognosis (73). Although additional testing increases the cost of a patient’s work-up, the goal of a cost-effectiveness analysis is to identify a point of indifference at which either little benefit is gained or cost becomes excessive (Fig. 6). Economically dominant strategies are those that improve outcomes and lower costs (70–82).
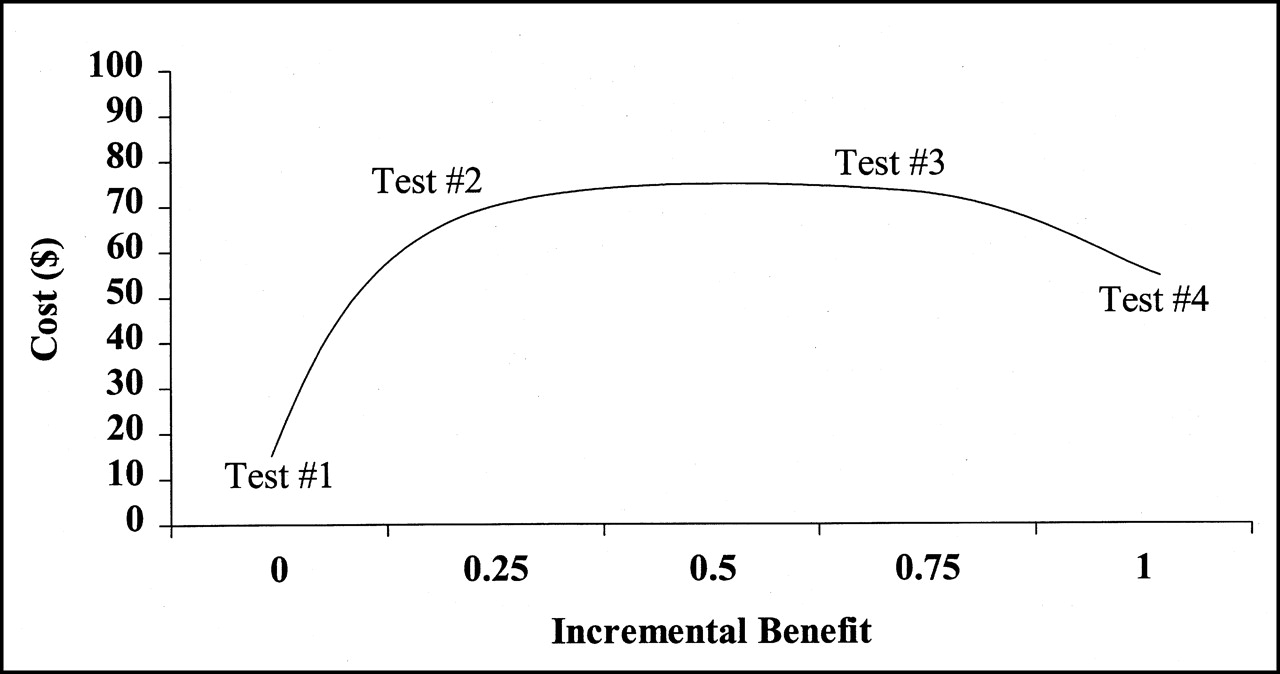
Interaction between clinical effectiveness and cost as more tests are added to patient’s clinical work-up. As patients proceed through clinical work-up, additional costs and, hopefully, additional clinical information are accrued. For cost-effectiveness calculation, incremental (or marginal) comparison of cost and outcome (or clinical benefit) is always available in ratio form. (Adapted with permission of (12).)
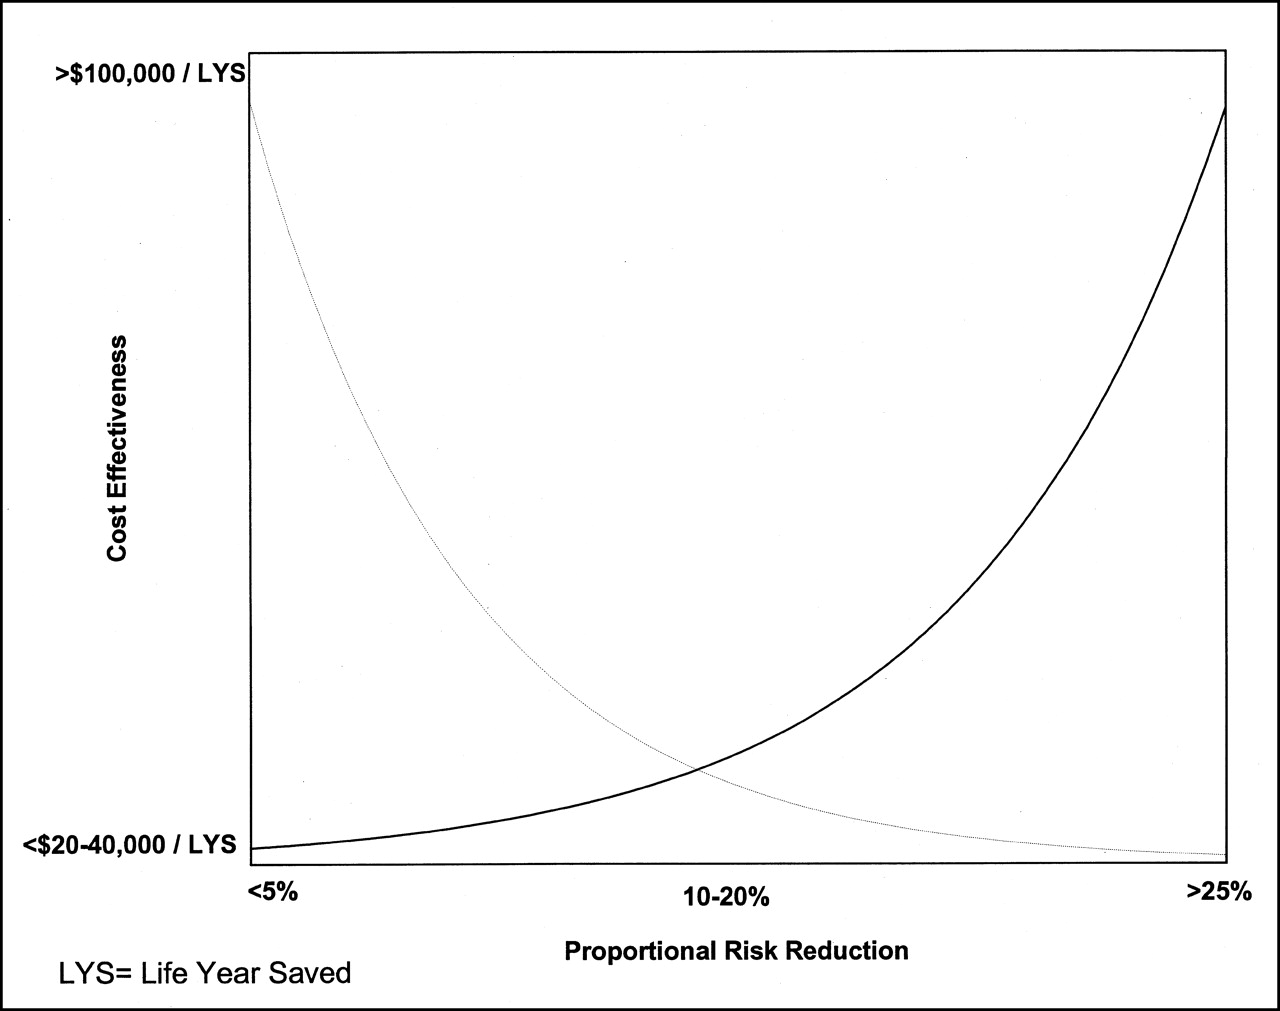
Another tenet often noted in cardiovascular economic analyses is that the potential for risk reduction is greater in secondary than in primary preventions (74,75). Thus, the denominator in the cost-effectiveness equation will yield a greater change in outcome, thus minimizing increased costs, in higher risk (i.e., heavy resource user) populations. Therefore, intervention is usually more cost-effective in higher risk populations or in a secondary prevention setting for cardiovascular disease. This “high-risk approach,” as called by Goldman et al. (74,75), focuses on identifying high-risk patients for receipt of medical intervention.
As population risk increases, proportional risk reduction is greater, resulting in enhanced cost-effectiveness. Thus, an inverse relationship exists between proportional risk reduction and cost-effectiveness (Fig. 7), and evidence is increasing that clinical effectiveness and cost-effectiveness parallel each other. In the area of cholesterol lowering, the high-risk approach would target therapy to populations in need of dietary or therapeutic programs (78). For statin use in secondary prevention populations, the cost-effectiveness ratios ranged from $3,300 to $15,000 per life-year saved for older men and women (78). A brief summary or league table may be derived to provide a compendium of cost-effectiveness data.

High-risk approach to risk assessment. As underlying population risk increases, proportional risk reduction is greatest, with resulting enhanced cost-effectiveness.
Cost-effectiveness is usually defined as cost per life-year saved. Despite this definition, in many cases the benefits of a diagnostic strategy may be indirect, and comparisons using life expectancy data may be less reliable (12,83). Nuclear imaging alone does not improve life expectancy but affects the decision to initiate therapeutic interventions. A type of cost analysis that may be more relevant to noninvasive imaging is the cost of identifying a cardiac event or disease case.
Cost utility analysis assesses the cost per unit change in patient utility (70–82). Utility may be defined as a hybrid of QOL and life expectancy (i.e., the product of 2 measures). For this analysis, a designated health state is assigned an overall utility relative to the best and worst outcomes. The most common outcome measurement for this type of analysis is quality-adjusted life-years. QOL is determined from patient interviews and reflects a perspective at a given time. One method of QOL assessment asks patients about their current health status and their opinion on the quality of their health, using a range from perfect health to ill health. From this perspective, perfectly healthy lives may be assigned a perfect score and, theoretically, low scores reflect poor health (41). A quality-adjusted life-year is a product of the number of life-years expected for a patient in relation to an adjusted value for his or her QOL.
Cost minimization or cost savings analysis has gained increasing popularity for developing disease management strategies in which the amount of information gained for patient management by adding a diagnostic screening test is compared with the composite cost of a given pathway of patient care. Management strategies with equivalent outcomes are developed with the goal of identifying the least costly. Another type of economic analysis is cost-benefit analysis, in which all consequences of an intervention or testing strategy are assigned monetary values (73).
At a time of great need to control the rising cost of health care, economic analyses have strong health policy implications (12,41,72). Integration of cost and effectiveness data has often revealed interesting clinical ramifications, such as the cost-prohibitiveness of screening asymptomatic patients with stress testing, the greater cost-effectiveness of using stress perfusion imaging on patients who are at an intermediate pretest risk, and the greater costliness of imaging lower risk patients (75). If guidelines of care are developed on the basis of integrated clinical and economic effectiveness data, a balance between cost and quality may be achieved. Figure 8 depicts an allocation of resources that may be devised on the basis of clinical and economic outcome data. Use of testing is recommended when cost-effectiveness data are less than the threshold of economic efficiency (i.e., <$50,000 per life-year saved).
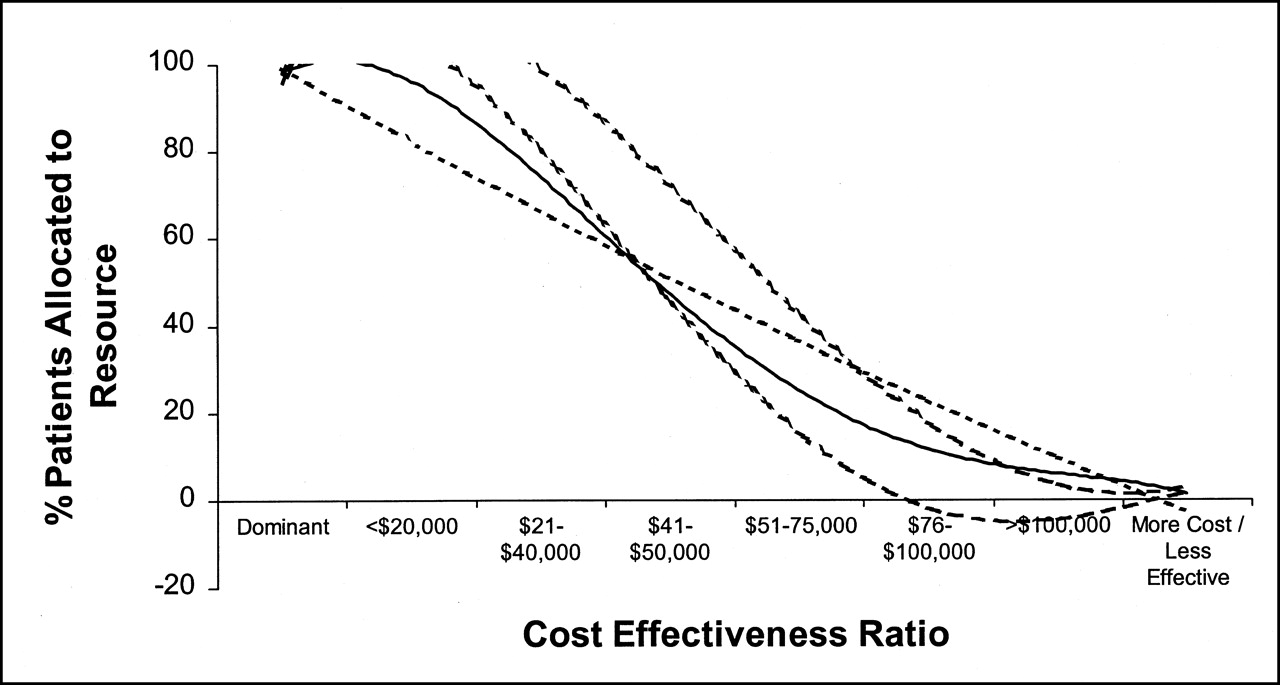
Allocation of scarce health care resources based on cost-effectiveness data. Greater percentage of patients should undergo testing when cost-effectiveness data are less than threshold for economic efficiency (i.e., <$50,000 per life-year saved).
CONCLUSION
Models for risk assessment are designed to identify whether patients are at low risk for cardiac events, and safely managed medically, or at high risk for cardiac events, and possibly benefited by aggressive medical therapy or coronary revascularization. For the results to be applicable to patient management, studies should address sample size, number and type of events, follow-up period, incremental value, positive and negative predictive values, QOL measures, and cost-effectiveness analysis. Improvements in medical management, including the use of aspirin, lipid-lowering therapy, angiotensin-converting enzyme inhibitors, and β-blockers, are decreasing the need for coronary angiography and coronary revascularization. Such approaches could be reserved for highly symptomatic patients not responding to conventional therapy and patients with high-risk findings not responding to noninterventional approaches. Noninvasive risk-assessment strategies may be of increasing importance in guiding appropriate patient management.
Acknowledgments
The authors thank Renee Brown for secretarial support and Lesley Wood for editorial assistance. This article was completed for the TriCity Outcomes Research Foundation.
Footnotes
Received May 15, 2001; revision accepted May 18, 2001.
For correspondence or reprints contact: Leslee J. Shaw, PhD, Emory Center for Outcomes Research, Room 638, 1518 Clifton Rd. NE, Atlanta, GA 30322.
REFERENCES
In this issue


Jump to section
- Article
- Abstract
- THEORETIC CONSTRUCTS WITHIN RISK ASSESSMENT
- MAJOR FACTORS IN OUTCOME ASSESSMENT
- ASCERTAINING CLINICAL ENDPOINTS
- EVALUATING PATIENT WELL-BEING AS AN OUTCOME
- METHODS OF OUTCOME ASSESSMENT
- RISK ADJUSTMENT METHODOLOGIES
- APPLICATION OF RISK-ADJUSTED METHODOLOGIES
- INCREMENTAL MODELING STRATEGIES
- VARYING TREATMENT SELECTION BY RISK
- BALANCING BENEFITS OF HIGH-QUALITY CARE WITH ECONOMIC CONSTRAINTS
- CONCLUSION
- Acknowledgments
- Footnotes
- REFERENCES
- Figures & Data
- Info & Metrics