


Abstract
The goals of this investigation were to assess the accuracy of 18F-fluorodihydrorotenone (18F-FDHR) as a new deposited myocardial flow tracer and to compare the results to those for 201Tl. Methods: The kinetics of these flow tracers in 22 isolated, erythrocyte- and albumin-perfused rabbit hearts were evaluated over a flow range encountered in patients. The 2 flow tracers plus a vascular reference tracer (131I-albumin) were introduced as a bolus through a port just above the aortic cannula. Myocardial extraction, retention, washout, and uptake parameters were computed from the venous outflow curves with the multiple-indicator dilution technique and spectral analysis. Results: The mean ± SD initial extraction fractions for 18F-FDHR (0.85 ± 0.07) and 201Tl (0.87 ± 0.05) were not significantly different, although the initial extraction fraction for 18F-FDHR declined with flow (P < 0.0001), whereas the initial extraction fraction for 201Tl did not. The washout of 201Tl was faster (P < 0.001) and more affected by flow (P < 0.05) than was the washout of 18F-FDHR. Except for the initial extraction fraction, 18F-FDHR retention was higher (P < 0.001) and less affected by flow (P < 0.05) than was 201Tl retention. Reflecting its superior retention, the net uptake of 18F-FDHR was better correlated with flow than was that of 201Tl at both 1 and 15 min after tracer introduction (P < 0.0001 for both comparisons). Conclusion: The superior correlation of 18F-FDHR uptake with flow indicates that it is a better flow tracer than 201Tl in the isolated rabbit heart. Compared with the other currently available positron-emitting flow tracers (82Rb, 13N-ammonia, and 15O-water), 18F-FDHR has the potential of providing excellent image resolution without the need for an on-site cyclotron.
Incomplete extraction and retention of 201Tl- and 99mTc-labeled flow tracers contribute to diagnostic and prognostic uncertainties in SPECT myocardial perfusion imaging (1–5). Although 82Rb, 13N-ammonia, and 15O-water can be used with PET to assess myocardial perfusion (6–9), problems with image resolution or the need for an on-site cyclotron has discouraged their widespread use. In an effort to find better perfusion indicators, we have been evaluating radiolabeled rotenone compounds as deposited myocardial flow tracers. Rotenone is a neutral lipophilic compound that binds to complex I in the mitochondrial electron transport chain (10–13). Marshall et al. recently reported that 125I-iodorotenone was superior to 99mTc-sestamibi as a deposited flow tracer in the isolated rabbit heart (14).
In this investigation, a second radiolabeled rotenone analog, 18F-fluorodihydrorotenone (18F-FDHR), was evaluated as a potential myocardial flow tracer and was compared to 201Tl instead of 99mTc-sestamibi. The experimental preparation was the isolated, isovolumic rabbit heart perfused retrograde with red blood cells (RBC) and bovine serum albumin (BSA). 18F-FDHR and 201Tl kinetics were assessed at flow rates ranging from 0.3 to 3.5 mL/min/g of left ventricular (LV) wet weight. Myocardial tracer deposition was determined from venous outflow curves after bolus introduction of 18F-FDHR, 201Tl, and the intravascular tracer 131I-albumin. Initial extraction fraction, net retention, washout, and net uptake of both flow tracers were computed with the multiple-indicator dilution technique and spectral analysis (14–16). Spectral analysis allowed separation of extravascular from intravascular tracer distributions and was also used in a previous report comparing 125I-iodorotenone and 99mTc-sestamibi (14). Because the experimental protocols and data analyses were identical in these 2 studies, it is possible to compare the results for all 4 flow tracers.
The results of this study indicate that 18F-FDHR and 201Tl were equally well extracted during the initial peak of the venous outflow curves. However, net retention and net uptake of 18F-FDHR were higher than those of 201Tl for the remainder of the 15-min experiment, making 18F-FDHR superior to 201Tl as a deposited flow tracer in the isolated rabbit heart. When the results of both studies were compared, the 2 radiolabeled-rotenone analogs had first-pass extraction fractions comparable to that of 201Tl and better retention than 99mTc-sestamibi for at least 15 min after tracer introduction, making 18F-FDHR and 125I-iodorotenone better flow tracers in the isolated rabbit heart. If similar results are observed in patients, 123I-rotenone could be used with SPECT and 18F-FDHR could be used with PET for a more accurate assessment of regional myocardial perfusion during stress and at rest.
MATERIALS AND METHODS
Experimental Preparation
All procedures were performed according to institutional guidelines for animal research. Isovolumic, retrograde RBC- and albumin-perfused rabbit hearts (n = 22) were prepared in a manner similar to that in previous reports (14,17). Hearts were obtained from male New Zealand White rabbits (R&R Rabbitry) weighing approximately 4 kg. The perfusate buffer was modified Tyrode’s solution containing BSA at 22 g/L (fraction V, fatty-acid free; Roche Diagnostics) and oxygenated bovine RBCs adjusted to a hematocrit level of 17%–20%. Substrates were glucose at 5 mmol/L and sodium pyruvate at 2 mmol/L. Electrolyte concentrations were 110 mmol/L for NaCl, 2.5 mmol/L for CaCl2, 6 mmol/L for KCl, 1 mmol/L for MgCl2, 0.435 mmol/L for NaH2PO4, and 28 mmol/L for NaHCO3. The pH and oxygen tensions were measured with an IRMA blood gas analyzer (Diametrics Medical, Inc.). The mean ± SD pH was 7.44 ± 0.06, and the partial pressure of oxygen was 320 ± 127 mm Hg. To maintain oxygenation and a stable pH, the surface of the RBC-containing perfusate was equilibrated with a mixture of 98% O2 and 2% CO2 during the experiment.
After a rabbit was given 4,000 U of heparin (Upjohn) and 250 mg of pentobarbital sodium (Abbott) through an ear vein, the heart was excised through a median sternotomy, arrested in ice-cold saline, and attached to a cannula to allow retrograde perfusion. After an apical drain was inserted into the left ventricle, a fluid-filled latex balloon connected to a Gould-Statham P23ID pressure transducer (Gould) was inserted across the mitral valve into the LV cavity. Perfusion pressure and systolic and diastolic ventricular pressures were recorded continuously with a Linearecorder (Western Graphtec). A coronary venous sampling catheter and a needle thermistor (Omega Engineering, Inc.) were inserted into the right ventricular cavity across the tricuspid valve. The venae cavae and pulmonary artery were ligated so that all coronary venous drainage flowed out of the sampling catheter. The atrioventricular node was crushed to allow controlled stimulation by 4-V, 4-ms stimuli from an SD44 stimulator (Grass Medical Systems). Temperature was maintained between 36°C and 38°C with a water-jacketed heating coil and a heart chamber. Coronary flow was kept constant with a peristaltic pump (Rainin Instruments). The coronary blood flow rate was measured by timed collection from the venous sampling catheter. The perfusate was not recirculated. Hearts were allowed to equilibrate for 15 min after surgical preparation was complete. During equilibration, developed pressure (peak systolic minus diastolic) was stable and averaged 73 ± 14 mm Hg.
Experimental Protocol
After equilibration, myocardial perfusion was gradually changed to the experimental flow rate and subsequently kept constant with the perfusion pump. A total of 22 hearts were evaluated. Each heart was studied at only one flow rate, ranging from 0.3 to 3.5 mL/min/g of LV wet weight. The balloon volume and the stimulus rate remained constant throughout all experiments. After 10 min at the experimental flow rate, a mixed-isotope bolus consisting of 131I-albumin (0.14 μCi), 18F-FDHR (4.6 μCi), and 201Tl (0.32 μCi) was injected just above the aortic cannula in 0.2 mL of perfusate buffer containing BSA but no RBCs. Venous sampling was performed as previously described (14,18).
Radiopharmaceutical Agents
201Tl was purchased from Mallinckrodt Medical. BSA was labeled with 131I (DuPont-NEN Research Products) by use of the IODO-GEN (Pierce) protein iodination technique (19).
High-specific-activity 18F was prepared by the 18O(p,n) 18F reaction with 10-MeV protons from the LBNL Biomedical Isotope Facility CTI RDS 111 cyclotron and 18O-enriched water. The aqueous 18F-fluoride ion was azeotropically dried with acetonitrile (ACN) under a gentle stream of nitrogen in the presence of tetra-n-butyl ammonium hydroxide to form reactive tetra-n-butyl ammonium 18F-fluoride (TBA18F). Nucleophilic displacement of the tosylate moiety of 7′-tosyloxy-6′,7′-dihydroroten-12-ol (DHR-ol-OTs) with the 18F-fluoride ion (TBA18F in acetonitrile for 20 min at 100°C) provided 7′-18F-fluoro-6′,7′-dihydroroten-12-ol (18F-FDHR-ol). The crude reaction mixture was filtered through a short plug of silica with ethyl acetate to remove nonreacted 18F-fluoride, and the solvent was removed at 100°C under a stream of nitrogen.
18F-FDHR-ol was oxidized with MnO2 in a slurry of Celite (Celite Corp.) and dichloromethane (DCM) to provide 7′-18F-fluoro-6′,7′-dihydrorotenone (18F-FDHR). The reaction mixture was filtered through Celite, diluted with high-pressure liquid chromatography solvent, and purified by high-pressure liquid chromatography (Partisil M9 25 [ ], containing 25% ethyl acetate and 75% hexanes, at 6 mL/min). The product fraction was isolated, the solvent was removed at 100°C under a stream of nitrogen, and ethanol was added. The radiochemical purity was >99%.
The production of 18F-FDHR from DHR-ol-OTs is shown in Scheme 1.
RBC Uptake and Albumin Binding
Studies of the binding of 18F-FDHR and 201Tl to RBCs were conducted at 37°C in the presence and in the absence of BSA. The hematocrit was 21%, and the concentration of BSA was 2.2% (w/v). In the first set of experiments (n = 3), 18F-FDHR, 201Tl, RBCs, and BSA were incubated together in buffer. In the second set of experiments (n = 3), 18F-FDHR and 201Tl were incubated in buffer with RBCs but without BSA. Aliquots from both experimental series were removed and briefly centrifuged (15–20 s at 16,000g) to pellet the RBCs at various times (30 s–15 min) after the addition of the 2 perfusion tracers. The relative binding of 18F-FDHR and 201Tl to RBCs was determined by measuring counts in the cell pellet and in the supernatant (plus or minus albumin). In experiments with BSA, the minimal amount of 18F-FDHR and 201Tl bound to BSA was determined by precipitating BSA with trichloroacetic acid to a final concentration of 10% and measuring counts in the protein pellet and in the supernatant separately.
Data Acquisition and Data Analysis
Venous samples and aliquots of a dilution of the isotope injection solution were counted by use of a γ-counter as previously described (18). Myocardial deposition kinetics for 18F-FDHR and 201Tl were assessed from the measured venous sample activity. The venous sample activity was expressed as the fractional venous appearance rate, h(t), and computed as follows:
 Eq. 1 where F denotes the blood flow (in mL/s), Ci(t) denotes the venous sample activity (in cps/g), and Q0 denotes the injected activity (in cps). Physically, h(t) is a transport function that is determined by intravascular transport and dispersion in addition to bidirectional diffusion into and out of the extravascular space.
The multiple-indicator dilution technique (15) and spectral analysis (16) were used to assess blood–tissue exchange of 18F-FDHR and 201Tl. The fundamental assumption of the multiple-indicator dilution technique is that the intravascular reference tracer (131I-albumin) accurately measures intravascular 18F-FDHR and 201Tl transport and dispersion. On the basis of this assumption, the differences between the 131I-albumin venous concentration curve and the curves for 18F-FDHR and 201Tl are used to measure transit time delays attributable to movement of the 2 flow tracers into and out of the extravascular space.
Mathematic analysis was based on a linear-system approach that assumes that the distribution of transit times for all 3 tracers does not change with time, that there is no interaction between the tracer concentrations of radiolabeled reference and perfusion molecules, and that the uptake of any one perfusion tracer molecule does not influence the uptake of any other perfusion tracer molecule. With this formulation, each perfusion tracer in the venous output of the heart was modeled as a convolution of the appearance of the intravascular reference tracer with a unit impulse response function. The unit impulse response function is the diffusible tracer venous concentration curve that would be observed after an idealized bolus without circulatory dispersion or transport delay. Physically, the impulse response function measures bidirectional diffusion into and out of the extravascular space after intravascular transport and dispersion are condensed into a nondelayed, narrow spike.
Spectral analysis quantified 18F-FDHR and 201Tl extravascular transit time delays by producing a spectrum of kinetic components that described the unit impulse response function of each flow tracer. The impulse response function was computed by deconvolving the perfusion tracer venous concentration curves by the intravascular reference tracer (131I-albumin) venous concentration curve. A nonnegative weighted least-squares algorithm was used to model the diffusible tracer fractional venous appearance rate at time t, hD(t), as having one component that behaves like the reference tracer, hR(t), along with delayed components that can each be represented as the convolution of the reference tracer curve with a decaying exponential, as follows:
 Eq. 2 where i(t) is the unit impulse response function, which is expressed as follows:
 Eq. 3 where δ(t) is the Dirac delta function that yields the nondelayed component that behaves like the reference tracer. This component contains the fraction c0 of injected activity that never escapes into the extravascular space. Through extrapolation of the spectral model to infinite time, the jth-delayed component contains a fraction cj of the injected activity that has a mean transit delay time of tj attributable to bidirectional diffusion between the vascular and extravascular spaces.
A total of 100 nonnegative components were used, with exponential time constants ranging between 1 s and 190 min equally spaced on a logarithmic scale. The extrapolated spectral components were not constrained to add up to 1 because of the relatively short time frame of the experiments (15 min) compared with the mean transit delay time of the slowest possible spectral component (190 min). Given m positive delayed components indexed according to increasing mean transit delay time, the first m − 1 components were termed intermediate components and the mth component was termed the slow component. With this kinetic model, the extraction fraction, D0, for a diffusible tracer is as follows:
 Eq. 4 and the combined fraction and combined mean transit delay time for the intermediate components are as follows:
 Eq. 5 The deconvolved net tracer retention at time t, Enet(t), is as follows:
 Eq. 6
Eq. 6
The deconvolved fractional escape rate, FER(t), a measure of tracer washout, was calculated as the ratio of the delayed components of the impulse response function and Enet(t), for t > 0, as follows:
 Eq. 7
Eq. 7
Net tissue tracer uptake, U(t), was computed as the product of tracer delivery by way of myocardial blood flow (F) and Enet(t), as follows:
 Eq. 8
Eq. 8
Net uptake, U(t), provides a measure of extravascular tissue tracer content and is the best index of the ability of a perfusion tracer to accurately report flow; for example, for an ideal tracer with an Enet(t) of 1 over all times and flows, U(t) is equal to flow.
Statistics
Data are expressed as the mean ± SD. Statistical analyses were performed with StatView statistical software (Abacus Concepts) and the MATLAB Statistics Toolbox (MathWorks). Regression lines were obtained with the unweighted least-squares method. A t test was used to test hypotheses about the slopes and y-intercepts of individual regression lines. Welch’s procedure (20) was used to compare the slopes of regression lines and to compare the areas under uptake-versus-flow curves. Paired comparisons of kinetic parameters of 18F-FDHR and 201Tl were made with both a paired t test and a nonparametric Wilcoxon signed-rank test. In all cases, the 2 tests yielded similar results regarding the statistical significance of the differences, and the larger of the 2 P values is reported. A P value of <0.05 was considered statistically significant.
RESULTS
RBC and Albumin Binding
Both bovine RBCs and BSA bound 18F-FDHR. In the absence of BSA, the rate with which 18F-FDHR bound to RBCs was rapid; after 30 s of incubation, 90.5% ± 0.6% of 18F-FDHR was RBC associated, and this value did not change significantly over 15 min. The average value across all time points was 90.5% ± 0.5%. As with RBCs alone, the binding of 18F-FDHR to RBCs in the presence of BSA was also rapid; steady-state binding was present after 30 s of incubation. However, in the presence of BSA, the binding of 18F-FDHR to RBCs declined to an average across all time points of 37.7% ± 2.1%. When BSA from the RBC supernatant was precipitated with trichloroacetic acid, equilibration between free 18F-FDHR and BSA-bound 18F-FDHR was present after 30 s of incubation; an average of 98.9% ± 1.4% of total 18F-FDHR activity was associated with albumin.
In contrast to the 18F-FDHR results, the rate with which 201Tl bound to RBCs was much slower, requiring approximately 15 min (with or without BSA) to reach a constant value. The presence of BSA resulted in an initial increase in RBC-associated 201Tl compared with that seen with RBCs in the absence of BSA. However, by 15 min, RBCs incubated with or without BSA reached the same levels, binding 55.2% ± 0.1% of the total 201Tl without BSA and 55.4% ± 0.4% with BSA. Also, in contrast to the 18F-FDHR results where virtually all of the 18F-FDHR in the supernatant was bound to albumin at 15 min, only 47.7% ± 1.7% of the 201Tl in the supernatant was bound to albumin.
Myocardial Tracer Transport and Impulse Response Function
Figure 1A shows the concentration–time curves, expressed as fractional venous appearance rates, for 18F-FDHR, 201Tl, and 131I-albumin in 1 experiment. Although the 3 tracers were introduced as a compact bolus, transport through the myocardium and associated perfusion tubing resulted in considerable temporal dispersion of the tracers. For the intravascular tracer, the fractional venous appearance rates reflected the distribution of transit times through the myocardial vasculature as well as the inflow and outflow tubing. For the 2 diffusible flow tracers, some molecules remained in the vasculature with the same transit time distribution as the intravascular tracer. Other molecules escaped into the extravascular space, where they either remained trapped for the duration of the experiment or diffused back into the vascular space. Escape of the 2 perfusion tracers from the vascular space is evident from their lower fractional venous appearance rates during the initial peak of the venous concentration curves. Subsequent reentry of the 2 perfusion tracers was seen during the later portions of the curves, when their fractional venous appearance rates exceeded that of the intravascular tracer.
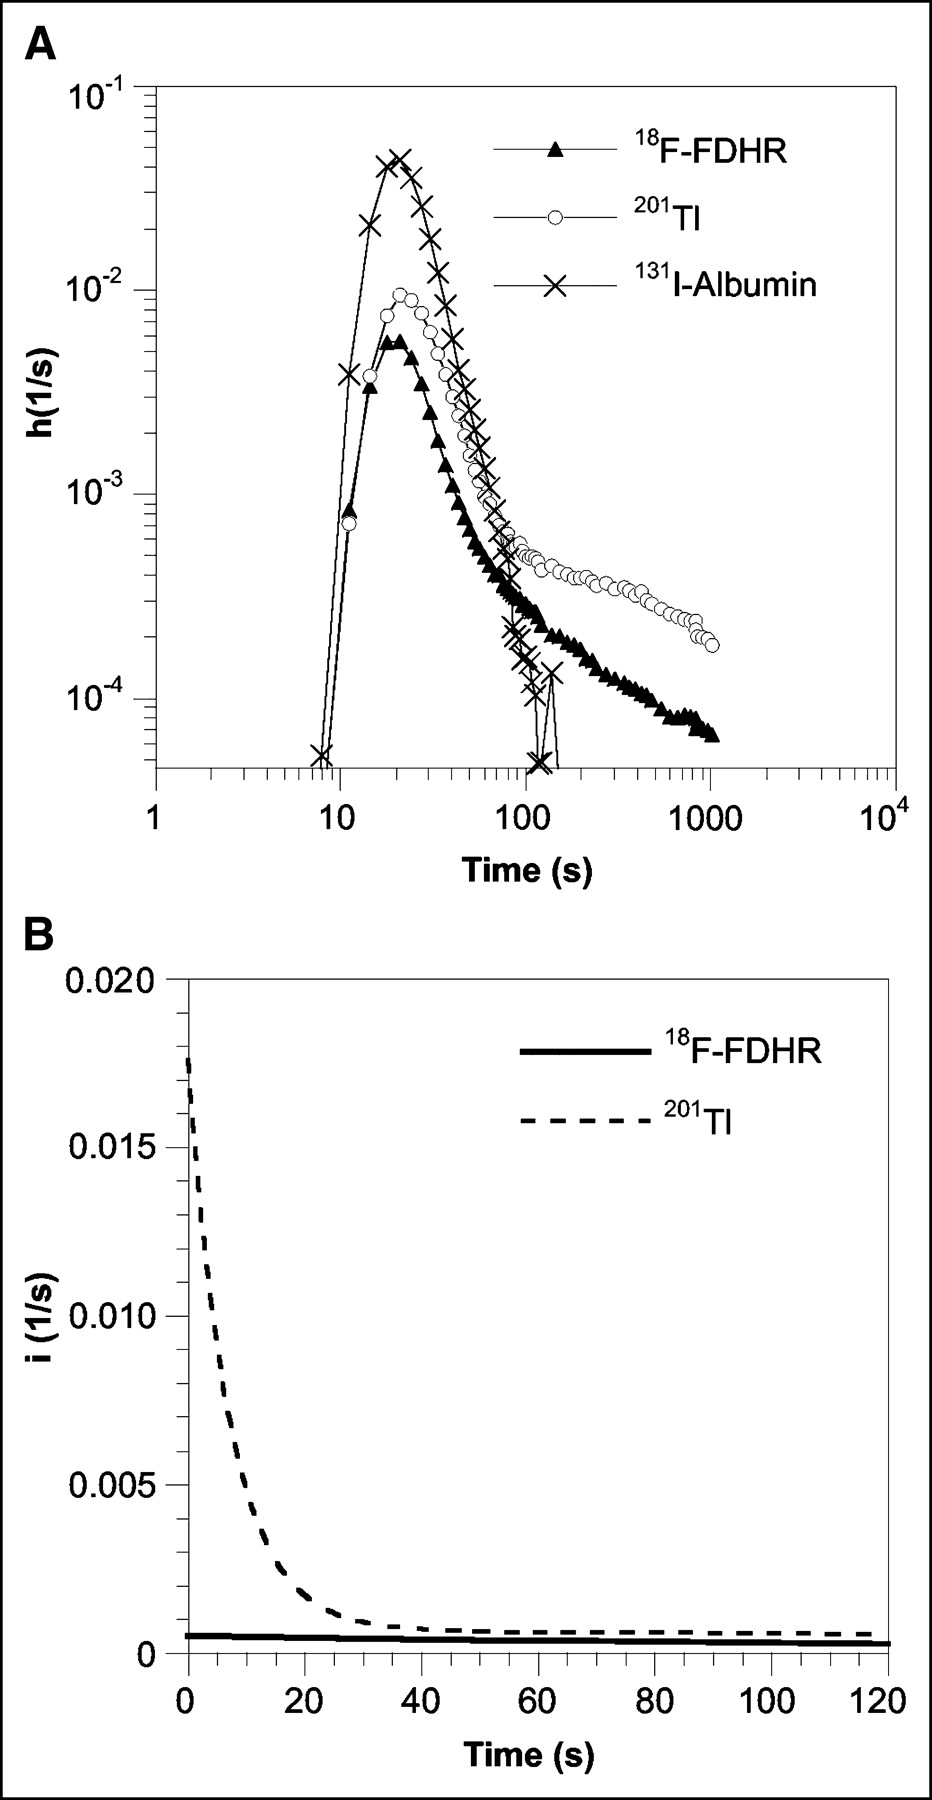
(A) Fractional venous appearance rate, h(t), for 18F-FDHR, 201Tl, and 131I-albumin as a function of venous collection times. (B) Delayed components of the deconvolved impulse response function, i(t), for the first 120 s. Both datasets are from the same experiment; the coronary flow rate was 1.6 mL/min/g of LV wet weight.
The delayed components of the impulse response function for the first 2 min of this experiment are displayed in Figure 1B. These delayed components are the sum of decaying exponentials from Equation 3 and depict the distribution of transit time delays attributable to movement of the flow tracer into the extravascular space followed by backdiffusion into the intravascular space. In this experiment, a larger amount of 201Tl reentered the vascular space, indicating that more extracted 201Tl than 18F-FDHR diffused out of this heart during the first 120 s after tracer introduction.
The nondelayed component fractions, c0 (Eq. 3), of the impulse response function for this experiment were 0.13 for 18F-FDHR and 0.14 for 201Tl (data not shown). These were the fractions of flow tracer molecules that remained inside the vasculature with transit time distributions indistinguishable from that of 131I-albumin.
Spectral Analysis
As was the case with previously reported spectral analyses of data for 125I-iodorotenone and 99mTc-sestamibi (14), there was consistency between measured and modeled fractional venous appearance curves for 18F-FDHR and 201Tl. Modeled diffusible tracer fractional venous appearance curves were obtained by convolving the measured 131I-albumin reference curve with the impulse response function given by the spectral models. The average root-mean-square differences between measured and modeled data were normalized to the root-mean-square values for measured data and expressed as percentages. For the 22 experiments, these differences averaged 9.7% ± 6.0% for 18F-FDHR and 3.1% ± 2.6% for 201Tl.
A second similarity to previously reported data (14) was that some spectral model parameters exhibited variability (Table 1). The number of delayed components in the impulse response function ranged from 1 to 4 for 18F-FDHR and from 2 to 5 for 201Tl. For each experiment, the number of 18F-FDHR components was less than or equal to the number of 201Tl components. On average, 18F-FDHR models contained 3.3 delayed components and 201Tl models contained 4.3 delayed components. However, despite this variability, robust estimates of extraction fraction, net retention, and washout (Eqs. 4, 6, and 7, respectively) were obtained by evaluating the impulse response function (Eq. 3) and its integral.
Spectral Analysis Components for 18F-FDHR and 201Tl
Two notable trends in the spectra were that the combined fraction of intermediate components, c1, …,m−1, was significantly smaller for 18F-FDHR than for 201Tl (P < 0.002) and that the slow-component mean transit delay time, tm, was significantly greater for 18F-FDHR than for 201Tl (P < 0.002). Thus, the results obtained with the spectral model indicated that less 18F-FDHR washed out in the 1- to 3-min intermediate time frame and that the long-term retention of 18F-FDHR was also better.
18F-FDHR and 201Tl Extraction
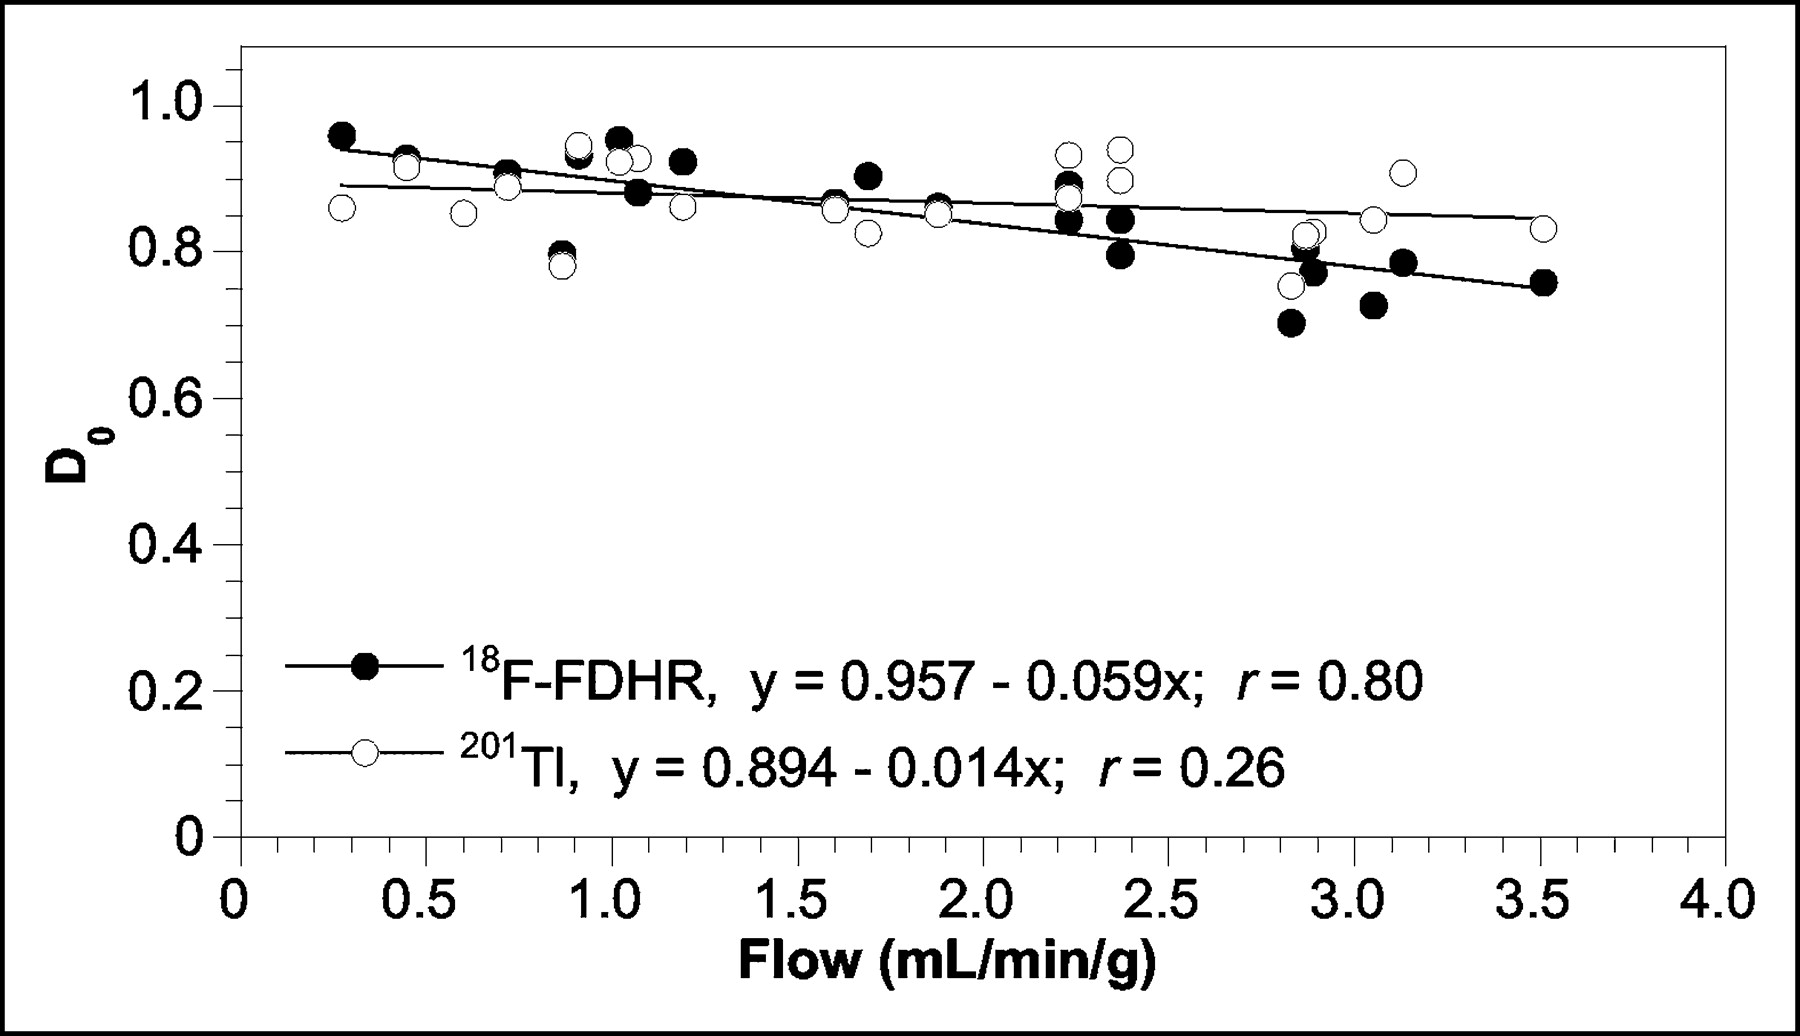
Figure 2 shows the initial extraction fraction (Eq. 4) values for 18F-FDHR and 201Tl as a function of myocardial blood flow for all 22 experiments. Over the range of flows evaluated, there was no significant difference between the mean ± SD initial extraction fraction values for 18F-FDHR (0.85 ± 0.07) and 201Tl (0.87 ± 0.05) (P > 0.1). The initial extraction fraction for 18F-FDHR decreased with flow (P < 0.0001), whereas flow did not have a significant effect on the initial extraction fraction for 201Tl (P > 0.2).

Initial extraction fractions, D0, for 18F-FDHR and 201Tl as a function of blood flow. Data were pooled from 22 experiments; each data point represents a single experiment. Equations for the linear fits to the data points are shown.
18F-FDHR and 201Tl Washout
Figure 3 is a 3-dimensional illustration (surface plot) of the effects of both time and flow on 18F-FDHR and 201Tl washout as quantified by FER(t) (Eq. 7). The surface heights represent the FER(t) values for 18F-FDHR (Fig. 3A and 3C) and 201Tl (Fig. 3B and 3D). The lines parallel to the flow axis depict the effect of flow on FER(t) at only 1 point in time. These lines were obtained from linear regressions of FER(t) values generated by evaluating Equation 7 at selected time points with data from all 22 experiments. The lines parallel to the time axis depict the effect of time on FER(t) at only 1 coronary flow. These lines were obtained by connecting points on the regression lines for FER(t) versus flow.

FER(t) as a function of flow and time for 18F-FDHR (A and C) and 201Tl (B and D) during the first 30 s (A and B) and from 30 s to 15 min (C and D).
Figures 3A and 3B show the effects of time and flow on 18F-FDHR and 201Tl FER(t) values during the first 30 s after tracer introduction. The surfaces are composed of 16 regression lines for FER(t) versus flow obtained at 2-s increments. FER(t) values for 201Tl were much higher than those for 18F-FDHR over all flows during the initial 30 s (P < 0.0001 for each time point). For both tracers, increasing flow resulted in higher FER(t) values for each point in time (P < 0.02 and P < 0.002 for 18F-FDHR and 201Tl, respectively). When flow was kept constant, there was a reduction in 201Tl and 18F-FDHR FER(t) values with time because of decreasing washout of activity from intermediate spectral components. 201Tl washout was very rapid at high flows early after tracer introduction. At low flows and after 15–20 s, the effects of time and flow were less prominent. Flow exerted a much stronger effect on 201Tl FER(t) than on that of 18F-FDHR during the first 20 s (P < 0.05 for each time point).
Figures 3C and 3D show surfaces composed of 16 regression lines for FER(t) versus flow obtained at 30 s and at 1-min increments from 1 to 15 min. As was the case during the first 30 s, FER(t) values for 201Tl were higher than those for 18F-FDHR (P < 0.001 for each time point). Although less striking than immediately after isotope introduction, flow had a stronger effect on 201Tl FER(t) than on that of 18F-FDHR (P < 0.05 for each time point). Reflecting this difference, increasing flow rates increased 201Tl FER(t) values at all time points (P < 0.001 for each time point), whereas 18F-FDHR values were only intermittently increased (significant increases from 30 s to 3 min and from 7 to 15 min [P < 0.05 for each time point]). When flow was kept constant, 18F-FDHR and 201Tl FER(t) values declined with time because of decreasing washout of activity associated with intermediate spectral components.
18F-FDHR and 201Tl Retention
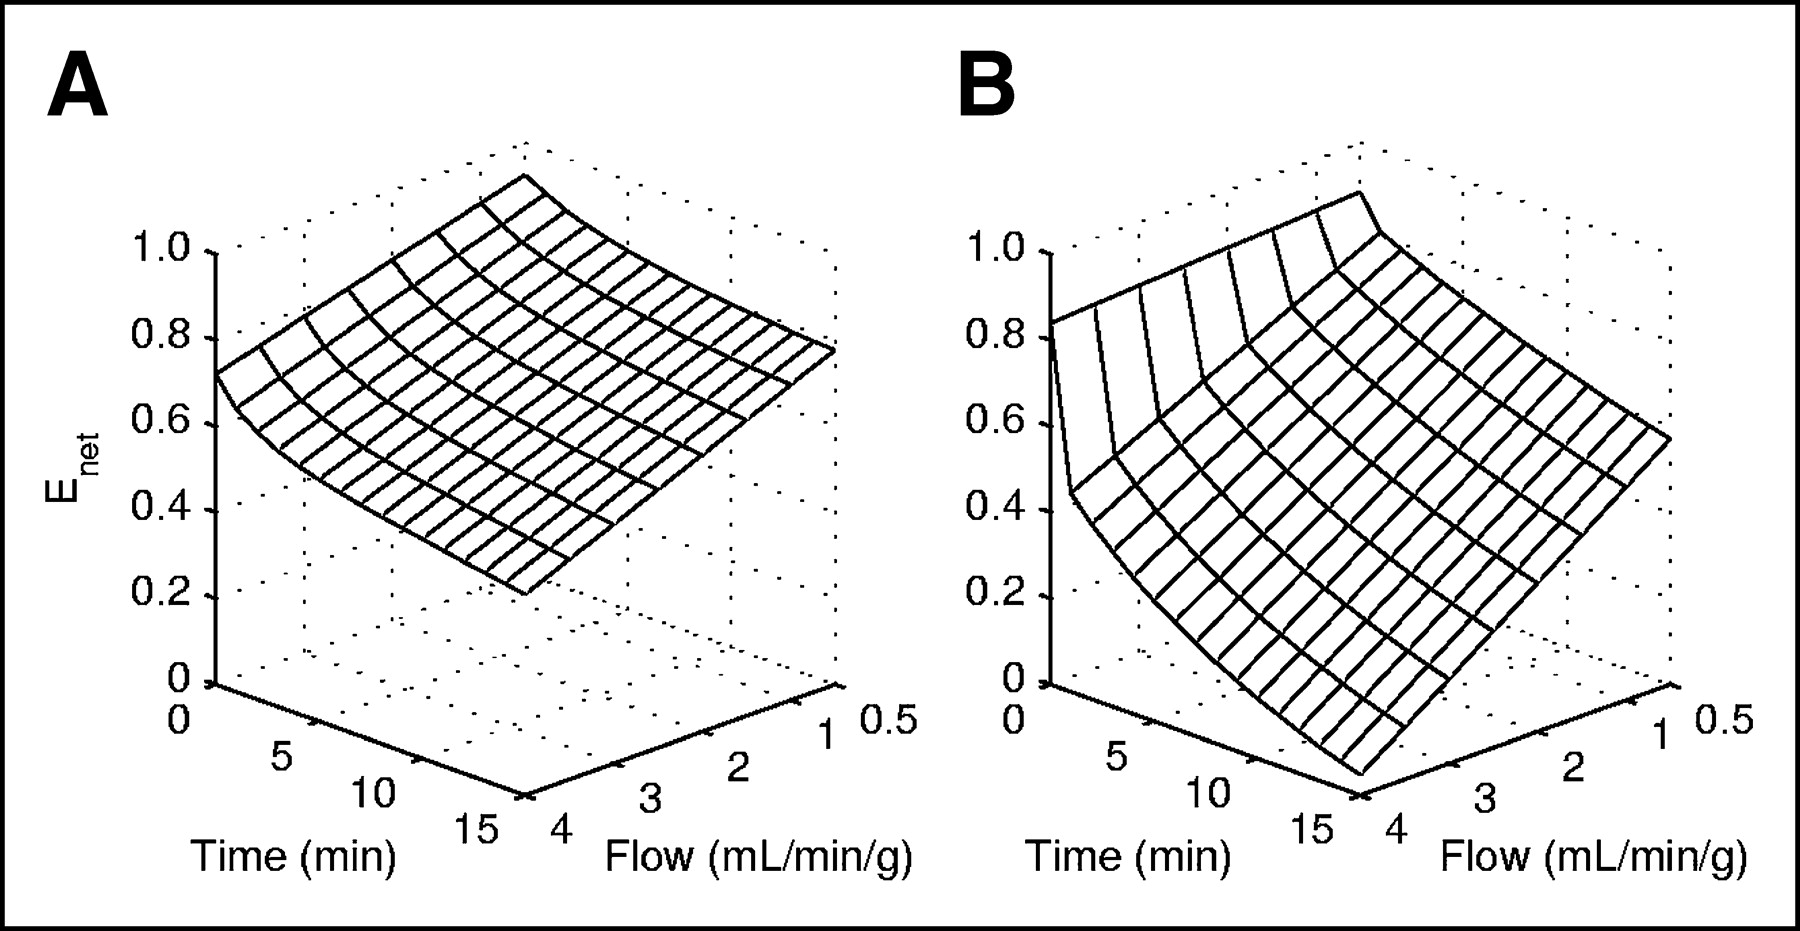
Figure 4 is a surface plot of the effects of time and flow on 18F-FDHR and 201Tl net retention; its configuration is similar to that of Figure 3, except that the flow axis has been reversed to allow better visualization of the effect of flow on tracer retention. The 16 lines parallel to the flow axis are linear regression lines obtained for Enet values from all 22 experiments by evaluating Equation 6 at 1-min increments. For both 18F-FDHR and 201Tl, the regression lines at time = 0 min are identical to the lines in Figure 2 and indicated that flow had a stronger effect on 18F-FDHR initial extraction fraction than on 201Tl initial extraction fraction. For all subsequent time points, 18F-FDHR net retention was higher than that for 201Tl (P < 0.0001 for each time point), because of the higher FER(t) values for 201Tl. Increasing coronary flow reduced both 18F-FDHR net retention and 201Tl net retention (P < 0.0001 for each tracer for each time point). Consistent with the different sensitivities to the effects of flow on washout, the decline for 201Tl was steeper than that for 18F-FDHR along the flow axis at times of ≥1 min, indicating that flow had a greater effect on 201Tl net retention (P < 0.05 for each time point).

Enet(t) as a function of flow and time for 18F-FDHR (A) and 201Tl (B).
18F-FDHR and 201Tl Uptake
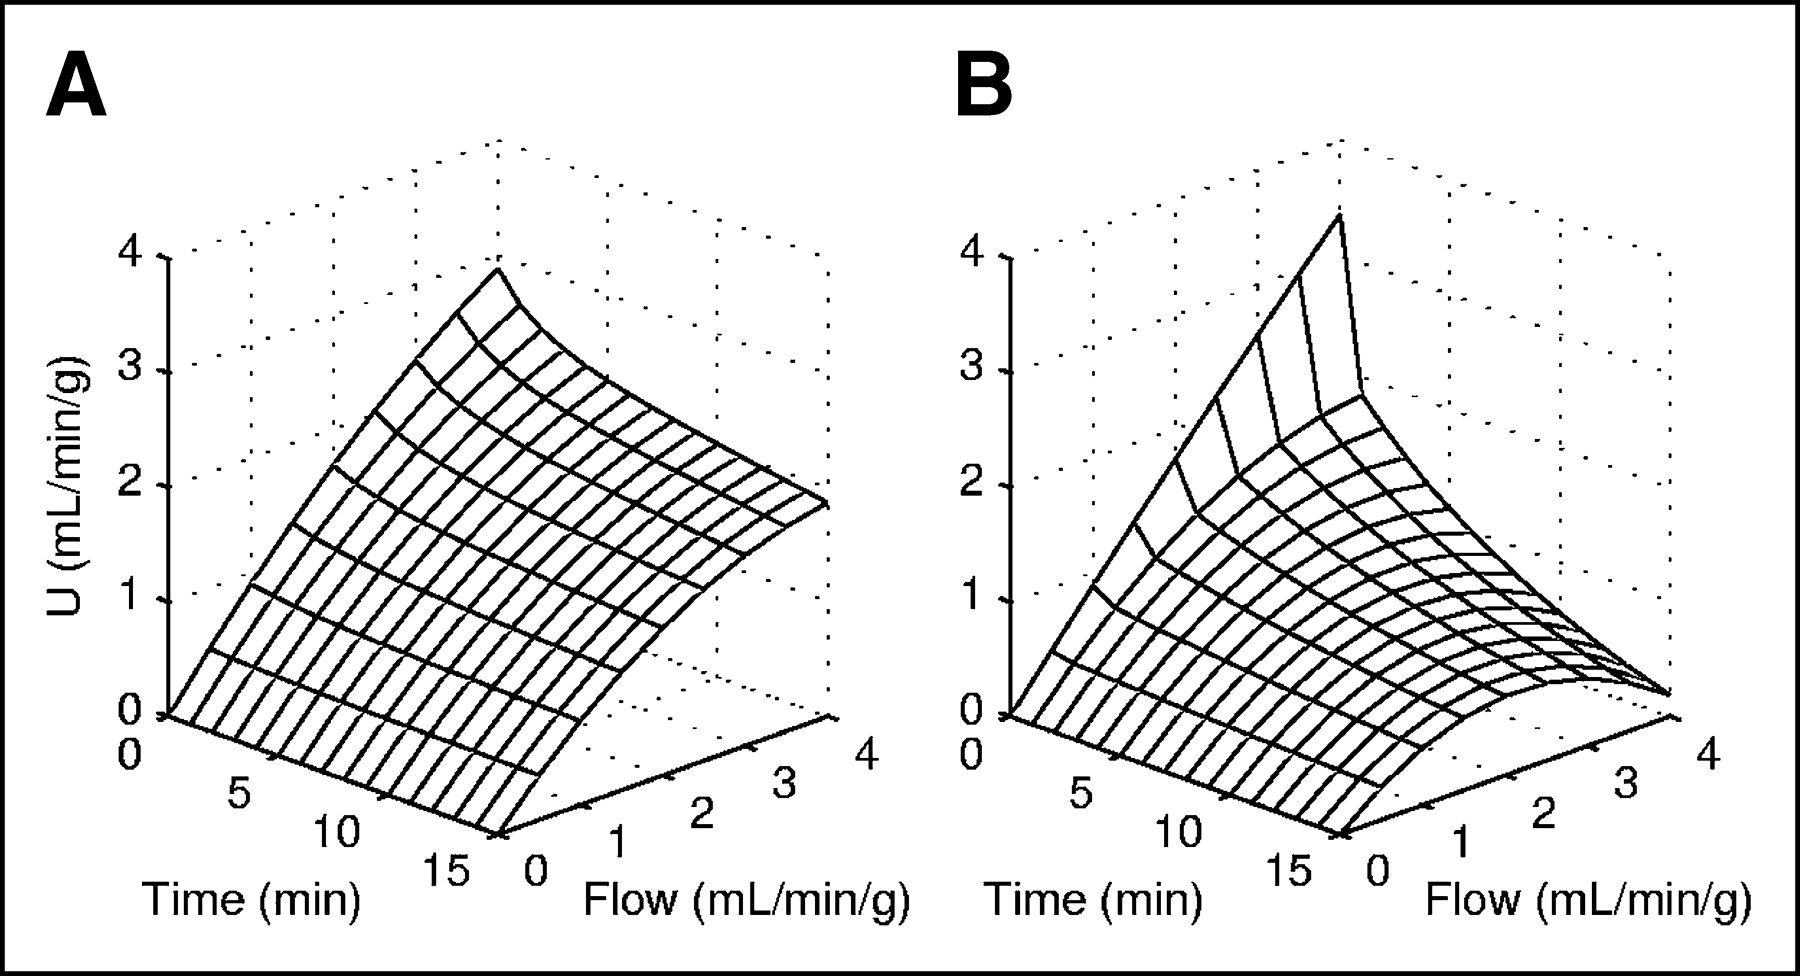
Figure 5 is a surface plot of the effects of time and flow on 18F-FDHR and 201Tl net uptake. The direction of the flow axis is identical to that in Figure 3. Because net uptake is computed as the product of flow and Enet (Eq. 8), ideal flow tracers have an Enet of 1 at all times and flows. For such ideal perfusion tracers, this surface plot would reduce to a 2-dimensional graph with flow and net uptake values falling on the line of identity. As shown in Figures 2 and 4, neither 18F-FDHR nor 201Tl had an initial extraction fraction of 1 at any flow, and the net retention of both tracers declined with increasing time and flow. When the 2 agents were compared, initial 18F-FDHR uptake values were less linearly related to flow than those for 201Tl, because the initial extraction of 18F-FDHR was sensitive to flow and the initial extraction of 201Tl was not (Fig. 2). However, 201Tl retention dropped sharply during the first minute and was more sensitive to flow than 18F-FDHR retention for the remainder of the 15-min experiment (Fig. 4). (At later times, 201Tl uptake actually declined as flow increased because of accelerated tracer washout at high flows in the absence of 201Tl recirculation, a condition not encountered in vivo). Thus, after the first minute, 18F-FDHR net uptake values were higher and more linearly related to flow than those for 201Tl.

Net uptake, U(t), as a function of flow and time for 18F-FDHR (A) and 201Tl (B).
Figure 6 shows the relationship between net uptake and flow at 1 and 15 min after tracer introduction for 18F-FDHR and 201Tl from the present study and comparable values for 125I-iodorotenone and 99mTc-sestamibi from a previous investigation (14). The results for 18F-FDHR and 201Tl are shown in Figures 6A and 6C, and those for 125I-iodorotenone and 99mTc-sestamibi are shown in Figures 6B and 6D. When the areas under the uptake-versus-flow curves at 1 min were compared (Figs. 6A and 6B), the net uptake values for both 18F-FDHR and 125I-iodorotenone were closer to the line of identity than those for either of the clinically available tracers (P < 0.0001 for each comparison). There was a small but statistically significant difference in the areas under the uptake-versus-flow curves for the 2 radiolabeled rotenone analogs at 1 min after tracer injection, with net uptake values for 18F-FDHR being slightly closer to the line of identity than those for 125I-iodorotonone (P < 0.05).
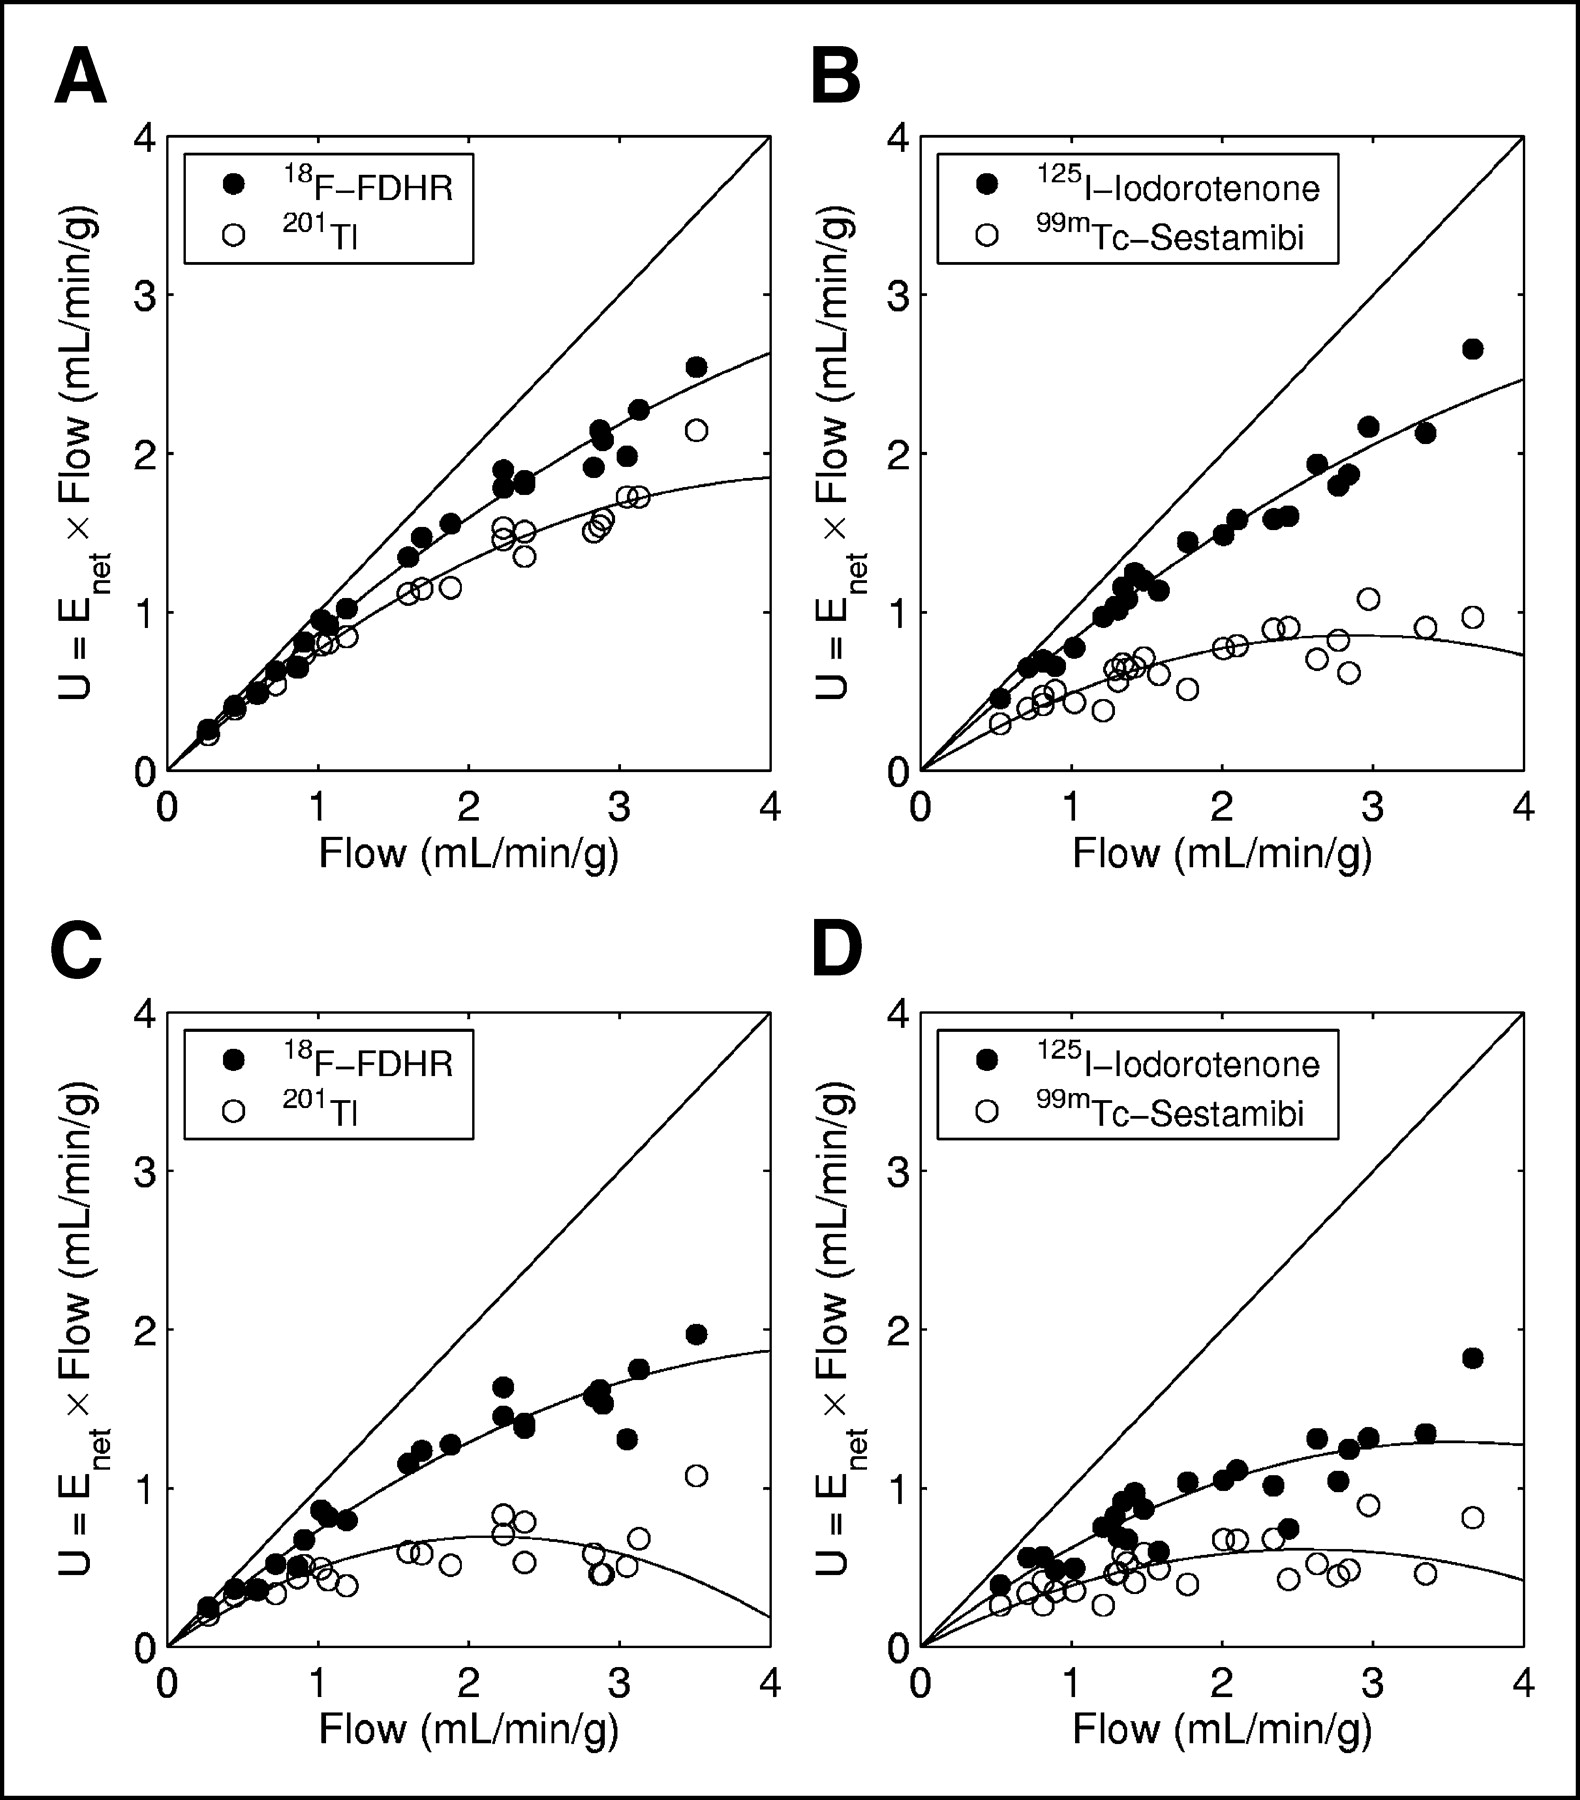
Relationship between net uptake, U(t), and flow for 18F-FDHR and 201Tl (A and C) and 125I-iodorotenone and 99mTc-sestamibi (B and D) at 1 min (A and B) and 15 min (C and D).

Production of 18F-FDHR from DHR-ol-OTs.
At 15 min after the injection of the isotopes (Figs. 6C and 6D), the net uptake values for the 2 radiolabeled rotenone analogs remained closer to the line of identity than those of either 201Tl or 99mTc-sestamibi (P < 0.0001 for each comparison). When 125I-iodorotenone and 18F-FDHR were compared, the differences in the areas under the uptake-versus-flow curves were slightly larger than those at 1 min, with net uptake values for 18F-FDHR continuing to be closer to the line of identity than those for 125I-iodorotonone (P < 0.001). These results indicate that both 18F-FDHR and 125I-iodorotenone were better flow tracers than either 201Tl or 99mTc-sestamibi from 1 to 15 min after bolus tracer introduction into the isolated rabbit heart. In addition, 18F-FDHR was a slightly better flow tracer than 125I-iodoroteone over the same time interval.
DISCUSSION
We compared 18F-FDHR, a radiolabeled rotenone analog, and 201Tl as myocardial perfusion indicators in the isolated rabbit heart. We observed that 18F-FDHR tissue tracer content was more closely related to flow than 201Tl content, except for a single measurement immediately after tracer introduction. Similarly, in previous work, we observed that the tissue tracer content of another radiolabeled rotenone analog, 125I-iodorotenone, was more closely related to flow than that of 99mTc-sestamibi (14). When results from the 2 studies were combined, both 18F-FDHR and 125I-iodorotenone tissue tracer contents were more closely related to flow than either 201Tl or 99mTc-sestamibi tissue tracer content. These observations indicate that 18F-FDHR and 125I-iodorotenone are better flow tracers than 201Tl and 99mTc-sestamibi in the isolated rabbit heart.
RBC and Albumin Binding and Permeation of Capillary Wall
The initial extraction fraction of a tracer is frequently used to assess its ability to permeate the capillary wall (21). Usually, neutral lipophilic compounds readily escape from the capillary into the extravascular space, because these compounds can diffuse through endothelial cell membranes (5). However, the initial extraction fraction for 18F-FDHR was no higher than that for 201Tl, a charged molecule that diffuses primarily through pores in the capillary wall (5). In addition, changes in flow affected 18F-FDHR initial extraction fraction but failed to significantly alter 201Tl initial extraction fraction. Because 18F-FDHR binding to RBCs and albumin was virtually complete after 30 s of incubation, the most plausible explanation for these observations is that the rate-limiting step for 18F-FDHR permeation of the capillary wall was dissociation from albumin or diffusion from RBCs.
Although infrequently cited in the cardiac literature, the binding of 201Tl to RBCs has been extensively investigated (22–24); it is well established that thallium enters the intracellular space of RBCs and may not be available for exchange with the myocardium (25). In the present study, we observed that 201Tl entered bovine RBCs slowly relative to 18F-FDHR; 55% was associated with the red cell fraction at 15 min. These observations are consistent with experience with 201Tl in the RBC-perfused rabbit heart. In a study comparing 201Tl with 99mTc (26), Marshall et al. observed that the peak extraction fraction for 201Tl was 0.83 ± 0.06, a value similar to that observed in this investigation. In these 2 studies, the isotope injection solution did not contain RBCs. However, in another investigation (18), the initial extraction fraction for 201Tl was only 0.67 ± 0.07. In this latter study, the injection solution contained RBCs. Because there was usually a lag time of up to 15 min between the addition of 201Tl to the RBC-containing perfusate and injection, there was sufficient time for 201Tl to enter RBCs and be unavailable to the myocardium. Because this phenomenon has not been investigated in vivo, the effect of red cell sequestration on regional 201Tl distribution or redistribution in patients is not clear.
Because 201Tl is charged, it has limited capillary permeability and is better extracted at low flows than at high flows (21,27–29). However, in both the current investigation and a previously published report (18), the expected decline in the thallium initial extraction fraction was not observed at higher coronary flows. There are 2 potential explanations for this anomalous behavior. First, at low flows, it takes longer to travel from the point of injection to myocardial capillaries, so that there is increased time for thallium to be sequestered inside RBCs. Because thallium inside RBCs is not available to the myocardium, the expected increase in the extraction fraction at low flows is not observed. Second, capillary permeability could increase as flow is increased because of either capillary recruitment or a temporal change in the capillary “twinkling” pattern, both obviating a decline in the extraction fraction at high flows. Weich et al. (29) observed an apparent increase in capillary permeability at higher flows when cardiac work was increased by rapid atrial pacing.
Washout and Retention
The ability to separate intravascular tracer distribution from extravascular tracer distribution by spectral analysis allows a qualitative comparison of the rate-limiting steps of 18F-FDHR versus 201Tl exchange between the blood and the myocardium. Early FER(t) provides a measure of the fraction of initially extracted tracer that backdiffuses into the intravascular space. In these experiments, early FER(t) for 201Tl was much higher than that for 18F-FDHR. Since the rates of diffusion from capillaries were similar for these 2 tracers, the higher backdiffusion of 201Tl is consistent with diminished sarcolemmal permeability for 201Tl. When this information is combined with the blood component binding studies and the 2 tracers are compared, the data suggest that the diffusion of 18F-FDHR into myocytes is limited by dissociation from RBCs or albumin, whereas that of 201Tl is limited by sarcolemmal permeability.
At late times in these experiments, the escape of these 2 flow tracers was related mostly to diffusion from the intracellular space. As with early FER(t), more 201Tl than 18F-FDHR escaped from the myocardium. Reflecting the less effective intracellular sequestration, 201Tl retention was lower and more affected by flow than 18F-FDHR retention at all times after the first measurement.
Although the superior retention of 18F-FDHR is presumably related to abundant mitochondria in the myocardium (10–13), the intracellular binding characteristics of 18F-FDHR (and 125I-iodorotenone) have not been systematically evaluated in the heart. In addition, the effects of changes in the mitochondrial metabolic rate attributable to altered workload, substrate supply, and ischemia are unknown. It is quite possible that extraction and retention of the radiolabeled rotenone analogs are altered by changes in mitochondrial function, limiting their use as flow tracers.
Comparison to Other Positron-Emitting Flow Tracers
Three positron-emitting flow tracers are currently available for clinical use. 82Rb is a generator-produced deposited flow tracer that does not require an on-site cyclotron. However, the use of 82Rb has been limited because it has a short half-life (75 s) and a high endpoint energy that degrades image quality. Also, the kinetics of 82Rb myocardial deposition indicate that it is not as good a flow tracer as 201Tl (18). In contrast to 82Rb, 15O-water is a flow-limited tracer; myocardial tracer delivery and washout are determined by the rate of coronary flow. Qualitative estimation of regional perfusion is not possible from a single image; to estimate flow with 15O-water, dynamic image acquisition is required, and quantification of regional flow requires a tracer kinetic model.
13N-Ammonia is a deposited flow tracer that was initially used clinically to assess regional blood flow in 1972 (30) and has been shown to provide accurate qualitative assessment of regional myocardial perfusion directly from tomographic images (31). 13N-Ammonia has also been used to quantify regional flow (32–37), although the rapid appearance of 13N-containing metabolites makes accurate assessment of the input function difficult. Previous studies evaluating 13N-ammonia kinetics in vitro did not use the multiple-indicator dilution technique (38), making comparison to the current results nonproductive.
18F-FDHR has 2 advantages over the positron-emitting flow tracers currently in use. First, both 15O-water and 13N-ammonia have short half-lives (2 and 10 min, respectively) and require an on-site cyclotron. 18F has a longer half-life (110 min) and does not require an on-site cyclotron; it can be obtained commercially. Second, 18F has the potential of providing excellent image resolution relative to 82Rb.
CONCLUSION
The results of this study and a previous investigation (14) have shown 18F-FDHR and 125I-iodorotenone to be superior flow tracers relative to 201Tl and 99mTc-sestamibi in the isolated rabbit heart. Although it is likely that these mitochondrion-avid tracers will be trapped in the myocardium of most mammalian species, there are issues that need further investigation. The first is that blood component binding in patients may be different from that in bovine RBCs and albumin. The second issue relates to potential changes in myocardial deposition when mitochondrial function is altered because of changes in workload, substrate supply, or the development of ischemia. Although these issues need to be addressed, the clear superiority of 18F-FDHR and 125I-iodorotenone over the tracers currently in use in the isolated rabbit heart provides sufficient motivation to continue to evaluate rotenone analogs both in vitro and in vivo.
Acknowledgments
This study was supported by National Heart, Lung, and Blood Institute grants PO1 HL25840 and RO1 HL6087701 and by the Director, Office of Science, Office of Biological and Environmental Research (OBER), Medical Science Division, U.S. Department of Energy, under OBER contract DE-AC03-76SF00098.
Footnotes
Received Mar. 19, 2004; revision accepted Jul. 15, 2004.
For correspondence or reprints contact: Bryan W. Reutter, Department of Nuclear Medicine and Functional Imaging, E.O. Lawrence Berkeley National Laboratory, University of California, 1 Cyclotron Rd., MS55-121, Berkeley, CA 94720.
E-mail: bwreutter{at}lbl.gov
REFERENCES
In this issue


Jump to section
Related Articles
Cited By...
- A Bridge Not Too Far: Linking Disciplines Through Molecular Imaging Probes
- Synthesis and Preliminary Evaluation of 18F-Labeled Pyridaben Analogues for Myocardial Perfusion Imaging with PET
- Myocardial Uptake of 7'-(Z)-[123I]Iodorotenone During Vasodilator Stress in Dogs With Critical Coronary Stenoses
- A Bridge Not Too Far: Linking Disciplines Through Molecular Imaging Probes
- A New 18F-Labeled Myocardial PET Tracer: Myocardial Uptake After Permanent and Transient Coronary Occlusion in Rats