


Abstract
The multidrug efflux transporter P-glycoprotein (P-gp) is expressed in high concentrations at the blood–brain barrier (BBB) and is believed to be implicated in resistance to central nervous system drugs. We used small-animal PET and (R)-11C-verapamil together with tariquidar, a new-generation P-gp modulator, to study the functional activity of P-gp at the BBB of rats. To enable a comparison with human PET data, we performed kinetic modeling to estimate the rate constants of radiotracer transport across the rat BBB. Methods: A group of 7 Wistar Unilever rats underwent paired (R)-11C-verapamil PET scans at an interval of 3 h: 1 baseline scan and 1 scan after intravenous injection of tariquidar (15 mg/kg, n = 5) or vehicle (n = 2). Results: After tariquidar administration, the distribution volume (DV) of (R)-11C-verapamil was 12-fold higher than baseline (3.68 ± 0.81 vs. 0.30 ± 0.08; P = 0.0007, paired t test), whereas the DVs were essentially the same when only vehicle was administered. The increase in DV could be attributed mainly to an increased influx rate constant (K1) of (R)-11C-verapamil into the brain, which was about 8-fold higher after tariquidar. A dose–response assessment with tariquidar provided an estimated half-maximum effect dose of 8.4 ± 9.5 mg/kg. Conclusion: Our data demonstrate that (R)-11C-verapamil PET combined with tariquidar administration is a promising approach to measure P-gp function at the BBB.
The ATP-binding cassette transporter P-glycoprotein (P-gp) is expressed in various body tissues, such as liver, kidney, intestines, testes, and brain. In the brain, P-gp is located at the luminal membrane of endothelial cells of blood capillaries, where it impedes the diffusion of lipophilic molecules into the brain by actively returning them to the vascular space through effluxion (1). Apart from its well-established role in multidrug resistance of cancer cells, P-gp–mediated efflux transport is also thought to be implicated in resistance to central nervous system drugs, such as antiepileptic, anticancer, anti-HIV, and antidepressant drugs (2). Moreover, changes in P-gp expression and function are thought to be involved in the etiology and pathogenesis of certain neurologic disorders, such as Alzheimer's disease (3) and Parkinson's disease (4).
The 11C-labeled calcium channel inhibitor verapamil has been developed as a PET tracer to assess in vivo the function of P-gp at the blood–brain barrier (BBB) (5). Whereas the tracer was initially used as a racemic mixture (6), enantiomerically pure (R)-11C-verapamil has been suggested to be preferable for kinetic modeling of PET data because of differences in metabolism and plasma protein binding between the (R)- and (S)-enantiomers (7–9).
11C-verapamil is effectively transported by P-gp at the BBB, thereby possessing low brain uptake, which in turn affords low counting statistics. For a more reliable assessment of P-gp functionality, the acquisition of paired 11C-verapamil PET scans, comprising 1 baseline scan and 1 scan after administration of a drug that modulates P-gp activity, has been suggested (10). In a proof-of-concept study in healthy volunteers, Sasongko et al. showed significant, yet moderate (∼90%), increases of 11C-verapamil–derived brain activity uptake after intravenous infusion of the immunosuppressant cyclosporine A, which has been attributed to cyclosporine A–induced blockade of cerebral P-gp (10). However, these investigators worked with blood concentrations of cyclosporine A that were severalfold higher than those achieved when the drug is used in the clinic. Unfortunately, safety concerns hamper the regular use of cyclosporine A at P-gp–modulating doses in 11C-verapamil–based PET protocols in human subjects, particularly in patients.
To overcome P-gp–mediated drug resistance, several new-generation P-gp modulators have been developed, and they have been shown to inhibit P-gp with good selectivity and high potency without causing significant side effects (11). One of the most potent P-gp modulators is the anthranilic acid derivative tariquidar (XR9576) (12), which inhibits substrate transport by P-gp in vitro with a half-maximum inhibition constant of about 0.04 μM (13). Tariquidar has already advanced to clinical trials, where increased tumor exposure to the P-gp substrate 99mTc-sestamibi as a surrogate marker for anticancer drug exposure was shown (14,15).
In this study, we used small-animal PET in naïve rats to develop an improved PET protocol that uses enantiomerically pure (R)-11C-verapamil and tariquidar to assess the functional activity of cerebral P-gp. To enable a comparison with human PET data, we analyzed our small-animal PET data by a kinetic modeling approach and estimated the rate constants of (R)-11C-verapamil transport across the rat BBB. By modeling (R)-11C-verapamil kinetics in rat brain with and without P-gp modulation, we were able to identify those model parameters that were most sensitive to changes in cerebral P-gp function.
MATERIALS AND METHODS
Animals
Adult female Wistar Unilever rats (Harlan-Winkelmann) weighing 220–250 g were used for this study. The study was approved by the local Animal Welfare Committee, and all study procedures were performed in accordance with the Austrian Animal Experiments Act. Rats had access to food and water ad libitum and were kept under a cycle of 12 h of light and 12 h of dark.
Before each experiment, the animals were placed in an acrylic container and anesthetized with 1.5% isoflurane. When unconscious, the animals were taken from the container and kept under anesthesia with 1.5% isoflurane administered via a mask during the whole experiment. The animals were warmed with a heating pad kept at 39°C. Each animal was cannulated in the carotid artery (for blood sampling) and the jugular vein (for administration of tariquidar and (R)-11C-verapamil).
Chemicals
Unless otherwise stated, all chemicals were of analytic grade and obtained from Sigma-Aldrich Chemie GmbH or Merck and used without further purification. Female Wistar rat plasma (anticoagulant: lithium-heparin) was purchased from Lampire Biologic Laboratories. Isofluran was obtained from Baxter Vertriebs GmbH. Tariquidar dimesylate was obtained from Xenova Ltd. For administration, tariquidar was freshly dissolved on each experimental day in 2.5% aqueous dextrose solution and injected at a volume of 3 mL/kg. Enantiomerically pure (R)-11C-verapamil was synthesized from (R)-norverapamil (ABX Advanced Biochemical Compounds) and 11C-methyl triflate as described earlier (16).
PET Experimental Procedure
The anesthetized animals were positioned in the scanner bed, and (R)-11C-verapamil (84 ± 16 MBq, 19.0 ± 11.8 nmol, n = 18) dissolved in 0.5–1 mL of phosphate-buffered saline (pH 7.4)/ethanol (9/1, v/v) was administered as an bolus via the jugular vein over approximately 40 s. At the start of radiotracer injection, dynamic PET was initiated using a small-animal PET scanner (microPET Focus 220; Siemens Medical Solutions).
During the first 3 min after radiotracer injection, 2-μL arterial blood samples were withdrawn manually with a micropipette from the carotid artery (approximately every 5 s), followed by further 2-μL samples taken at 5, 10, 20, 30, 40, 50, and 60 min. Activity in the blood samples was measured in a 1-detector Wallac γ-counter (Perkin Elmer Instruments), which was cross-calibrated with the PET camera. Moreover, 1 larger blood sample (0.6 mL) was collected into an heparinized vial at 10 min after tracer injection to determine plasma protein binding and metabolism of (R)-11C-verapamil. Blood activity data were corrected for radioactive decay and expressed as percentage injected dose per gram.
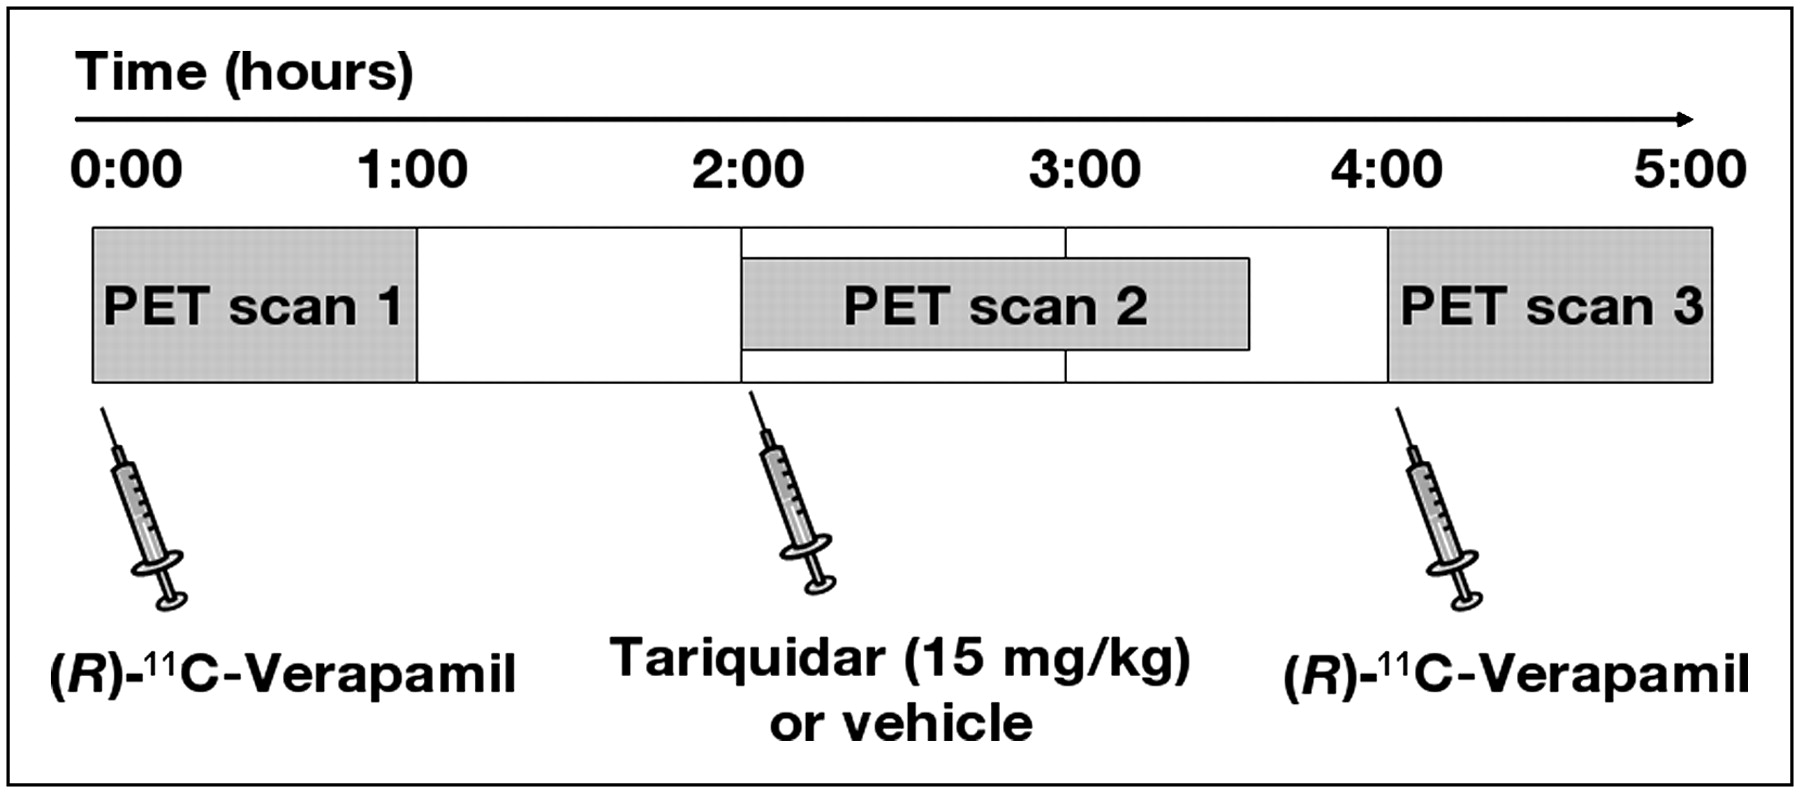
The study set-up is illustrated in Figure 1. A group of 7 animals underwent 3 consecutive PET scans (scans 1–3). First, (R)-11C-verapamil was injected and was followed by a 60-min baseline scan (scan 1). Then, 1 h after the end of scan 1, tariquidar (15 mg/kg, n = 5) or vehicle (n = 2) was administered via the jugular vein and scan 2 (90 min) was performed (scan 2 measured the remainder of circulating activity from scan 1). Finally, 3 h after the end of scan 1, (R)-11C-verapamil was injected and was followed by scan 3 (60 min). Four additional animals underwent only a single PET scan, 2 h after administration of 1, 3, 5, or 7.5 mg/kg of tariquidar.

Diagram of study set-up. After (R)-11C-verapamil PET scan 1, tariquidar (15 mg/kg, n = 5) or vehicle (n = 2) was administered intravenously and was followed by scan 2, which measured remainder of circulating activity from scan 1. At 3 h after scan 1, (R)-11C-verapamil PET scan 3 was acquired.
At the end of the last PET scan, the animals were sacrificed. A terminal blood sample (5 mL) was collected and the whole brain was harvested. Plasma was obtained by centrifugation (3,000g, 10 min). Plasma and brain samples were stored at −20°C until measurement of tariquidar concentrations.
Analysis of Plasma Protein Binding and Metabolism of (R)-11C-Verapamil
Plasma collected at 10 min after tracer injection and from the terminal blood sample, respectively, was used to determine plasma protein binding and metabolism of (R)-11C-verapamil. Protein binding was assessed by ultracentrifugation using Amicon Microcon YM-10 centrifugal filter devices (Millipore Corp.). Metabolism of (R)-11C-verapamil was analyzed using a previously described solid-phase extraction assay (8,17).
Measurement of Tariquidar Concentrations in Plasma and Brain
Tariquidar concentrations in terminal plasma samples and brain tissue samples were determined with a high-performance liquid chromatography (HPLC) assay using ultraviolet detection at a wavelength of 227 nm. All plasma and brain tissue samples were analyzed in duplicate. A Symmetry C18 HPLC column (125 × 4 mm, 5 μm) (Waters Corp.) was eluted isocratically with a mixture of acetonitrile, methanol, and aqueous ammonium acetate buffer (0.2 M, pH 5) (35/7.8/57.2, v/v/v) containing 0.005 M 1-octane sulfonic acid (PIC B-8 Low UV reagent; Waters) at a flow rate of 1 mL/min. On this system, tariquidar eluted with a retention time of about 13–14 min.
Plasma samples (200 μL) were diluted with 1 mL of aqueous phosphate buffer (0.025 M, pH 7.0). Then, 3 mL of tert-butyl-methyl ether were added, and the vials were stirred in a vortex mixer for 5 min. After centrifugation for 5 min at 3,000g, 2 mL of the ether layer were transferred into a new vial and concentrated to dryness. The residue was redissolved in 0.7 mL of mobile phase for HPLC, centrifuged for 5 min at 3,000g, and injected into the HPLC system, which was equipped with a 600-μL sample loop.
The frozen rat brains were weighed, brought to room temperature, and homogenized with 5 mL of aqueous phosphate buffer (0.025 M, pH 7.0). One milliliter of the brain tissue homogenate was mixed with 3 mL of acetonitrile and stirred in a vortex mixer for 5 min. After centrifugation, 3 mL of the supernatant was further processed and analyzed by HPLC as described for the plasma samples.
Calibration curves for the analysis of plasma and brain tissue samples were generated by analyzing different dilutions of a tariquidar stock solution (5.1 mg in 50 mL of water) in drug-free rat plasma or brain tissue homogenates. Before analysis, the calibration standards were incubated in a water bath (37°C) for 15 min. Recoveries of tariquidar from plasma and brain samples were more than 95% and 64%, respectively.
PET Data Analysis
PET data were sorted into frame sequences of 8 × 5 s, 3 × 10 s, 2 × 30 s, 3 × 60 s, 2 × 150 s, 2 × 300 s, and 4 × 600 s for scans 1 and 3, and 5 × 60 s, 4 × 150 s, 3 × 300 s, and 6 × 600 s for scan 2. PET images were reconstructed by Fourier rebinning followed by 2-dimensional filtered backprojection with a ramp filter. Normalization, randoms correction, and attenuation correction were applied to the data. Because we were interested in global transport of (R)-11C-verapamil across the BBB, whole brain was chosen as a volume of interest. Whole-brain volumes of interest were manually outlined on multiple planes of the PET summation images using the image analysis software AMIDE, and time–activity curves, expressed in units of percentage injected dose per gram, were calculated.
Kinetic Modeling of (R)-11C-Verapamil
A standard 1-tissue 2-rate-constant (1T2K) or 2-tissue 4-rate-constant (2T4K) compartment model was fitted to the (R)-11C-verapamil time–activity curves in rat brain (7,18–20). The input function was constructed by linear interpolation of the measured arterial blood activity data and by multiplication by the ratio of plasma to whole-blood activity, which was determined by separate measurements. A delay of 5 s due to transport of activity in the arterial catheter was considered for the time course of activity in plasma.
Fits were performed by the method of weighted nonlinear least squares as implemented in the Optimization Toolbox of MATLAB (MathWorks). Goodness of fit was assessed by visual inspection of observed and predicted concentrations versus time, by the correlation between observed and predicted concentrations, by the randomness of the residuals (runs test), and by estimating parameter uncertainties (variances) from the inverse of the appropriate Fisher information matrix (21).
To obtain a model-independent estimate of the distribution volume (DV), we applied Logan graphical analysis (22) to the PET and arterial plasma data using MATLAB. The slope DV of the linear part of the Logan plot was estimated by linear regression of the Logan variables. The linear regression was assessed by the magnitude of the squared linear correlation coefficient (r2).
A dose–response curve was fitted to the DVs of (R)-11C-verapamil (effect, E) after different doses of tariquidar using SPSS (SPSS Inc.) according to the following equation: where Emax is the maximum effect, D the tariquidar dose (mg/kg), ED50 the half-maximum effect dose, and n the Hill-factor.
Statistical Analysis
For all calculated outcome parameters, differences between scan 1 (before tariquidar administration) and scan 3 (after tariquidar administration) were tested with a 2-tailed paired Student t test. The level of statistical significance was set to 5%.
RESULTS
We used PET to study the effect of tariquidar on brain penetration of (R)-11C-verapamil in rats. We first assessed the test–retest variability of (R)-11C-verapamil PET in 2 rats by performing 2 consecutive scans at an interval of 3 h (Fig. 2A). The time–activity curves of the test–retest scans were nearly congruent. Mean DVs for the test and the retest scans were 0.23 and 0.22, respectively.

Time–activity curves in rat brain for (R)-11C-verapamil PET scans recorded before (□, n = 2, scan 1) and after (▪, n = 2, scan 3) administration of vehicle (A) and before (□, n = 5, scan 1) and after (▪, n = 5, scan 3) administration of tariquidar (15 mg/kg) (B). Activity concentration is expressed as mean percentage injected dose per gram (±SD).
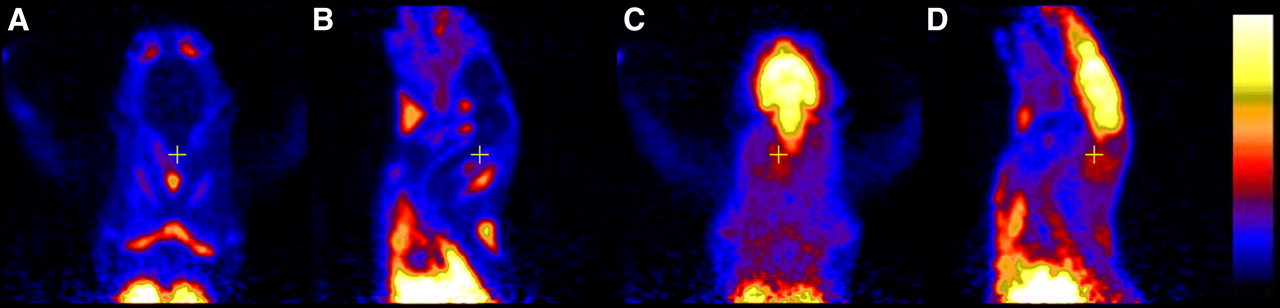
A group of 5 rats underwent paired (R)-11C-verapamil PET scans (scans 1 and 3; Fig. 1), with administration of tariquidar (15 mg/kg) 2 h before the start of scan 3 (Fig. 2B). Tariquidar administration had a pronounced effect on activity uptake in brain. The mean DV of scan 3 was increased by 1,137% over baseline scan 1 (P = 0.0007) (Table 1). In Figure 3, PET summation images of paired scans recorded in 1 rat are shown. In scan 1, activity uptake in brain was considerably lower than that in surrounding tissue, whereas in scan 3 activity uptake in brain was severalfold higher.

Transversal (A and C) and sagittal (B and D) PET summation images (0–60 min) recorded before (A and B, scan 1) and after (C and D, scan 3) administration of tariquidar (15 mg/kg). The radiation scale was set from 0 to 700 kBq/mL.
Outcome Parameters of 2T4K Model
In contrast to the brain-tissue time–activity curves (Fig. 2B), the blood time–activity curves were only moderately increased after tariquidar administration (Fig. 4). For selected plasma samples, we determined the percentage of unchanged (R)-11C-verapamil by a solid-phase extraction assay. At 10 min after radiotracer injection, unchanged (R)-11C-verapamil accounted for 84.1% ± 1.5% and 86.7% ± 4.0% of total plasma activity in PET scans 1 and 3, respectively. At 60 min after radiotracer injection (scan 3), 64.6% ± 9.8% of total plasma activity was in the form of parent (R)-11C-verapamil. At 10 min after radiotracer injection, nonprotein-bound (R)-11C-verapamil was 18.7% ± 1.3% and 18.9% ± 3.4% for scans 1 and 3, respectively.
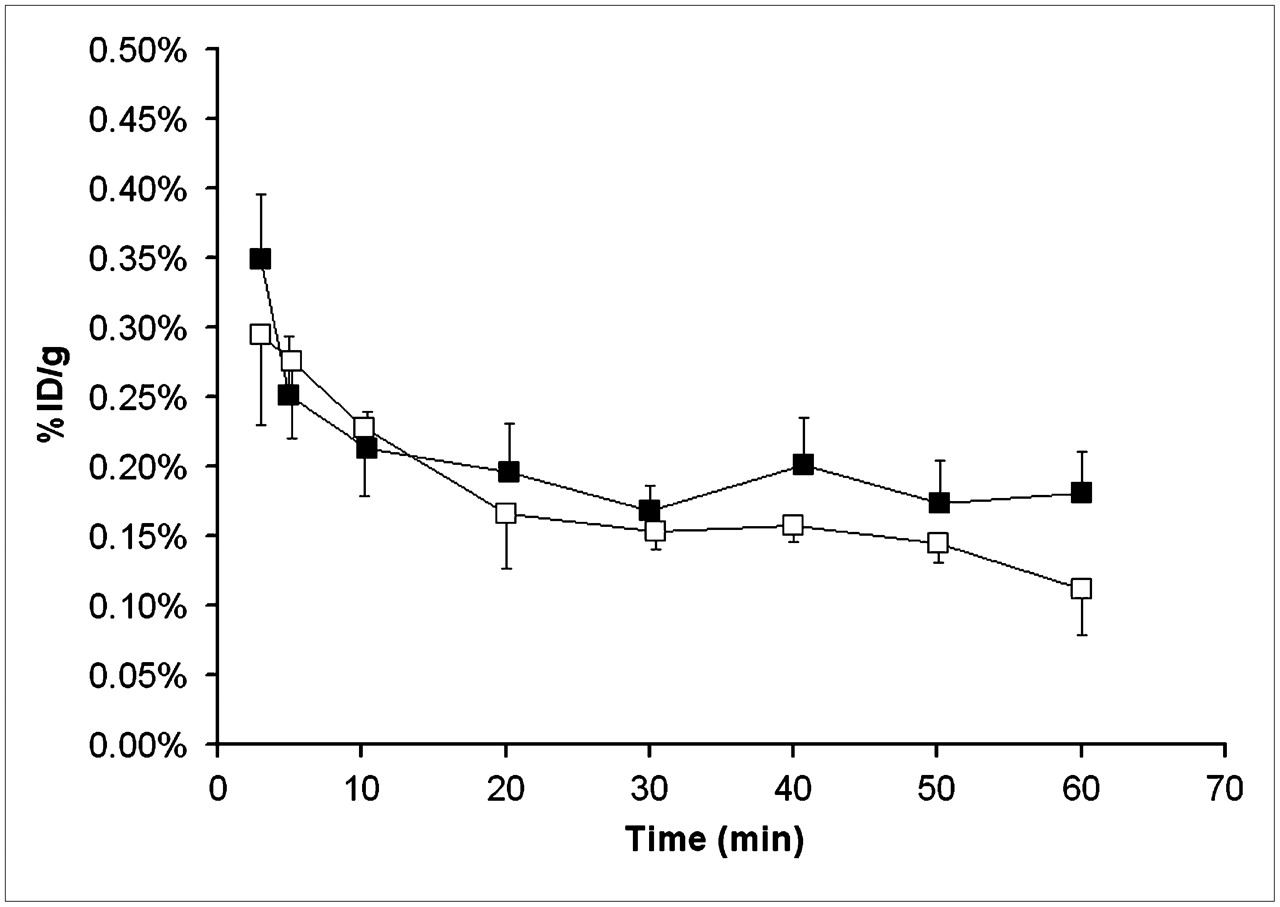
Total activity concentrations in whole blood before (□, n = 5, scan 1) and after (▪, n = 5, scan 3) administration of tariquidar (15 mg/kg). Activity concentration is expressed as mean percentage injected dose per gram (±SD).
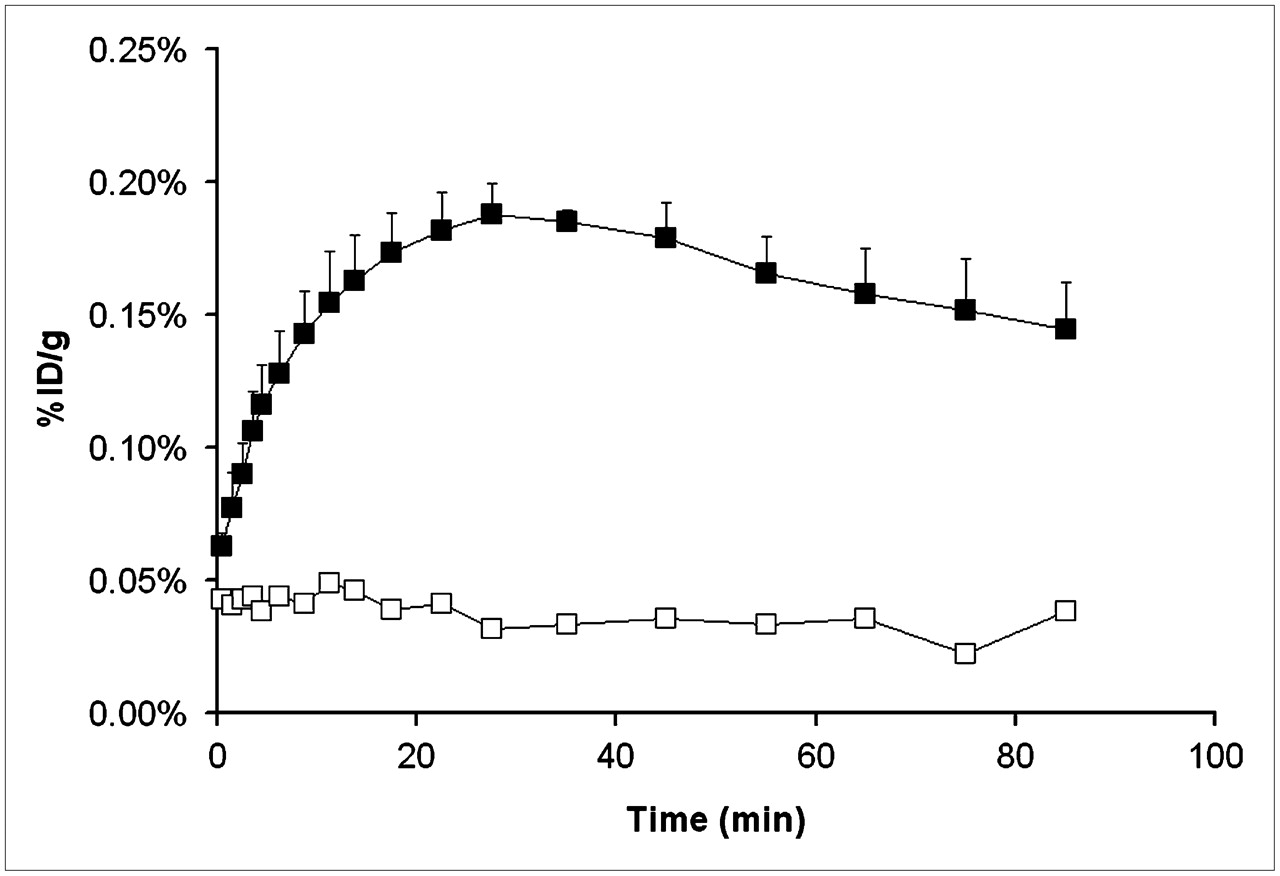
To monitor the time course of P-gp inhibition by tariquidar, we recorded 1 dynamic PET scan (scan 2) from time 0 to 90 min after tariquidar administration (Fig. 1). For this scan, peak uptake was reached 32 ± 5 min after tariquidar injection (Fig. 5). When only vehicle was administered, no increase of uptake in brain over the course of the 90-min PET scan was observed (Fig. 5).

Brain time–activity curves for PET scan 2 recorded from 0 to 90 min after administration of vehicle (□, n = 2) or tariquidar, 15 mg/kg (▪, n = 5). PET scan 2 measured remainder of circulating activity from scan 1. Activity concentration is expressed as mean percentage injected dose per gram (±SD for n = 5).
The 2T4K model provided better fits of the PET data than the 1T2K model. In Figure 6, fits obtained with the 2T4K model are shown. In Table 1, the outcome parameters of the 2T4K model are summarized. Compartmental-model–derived DV values agreed well with DVs estimated by Logan graphical analysis. The influx rate constant (K1) and DV were the model parameters most prominently affected by tariquidar pretreatment, as compared with baseline scans. K1 and DV were significantly increased—by 8- and 12-fold, respectively—after tariquidar administration (P = 0.004 and 0.0007 for K1 and DV, respectively). For k2, the efflux rate constant from the first tissue compartment, there was a trend toward decreased values after tariquidar treatment, although statistical significance was not reached (P = 0.057).
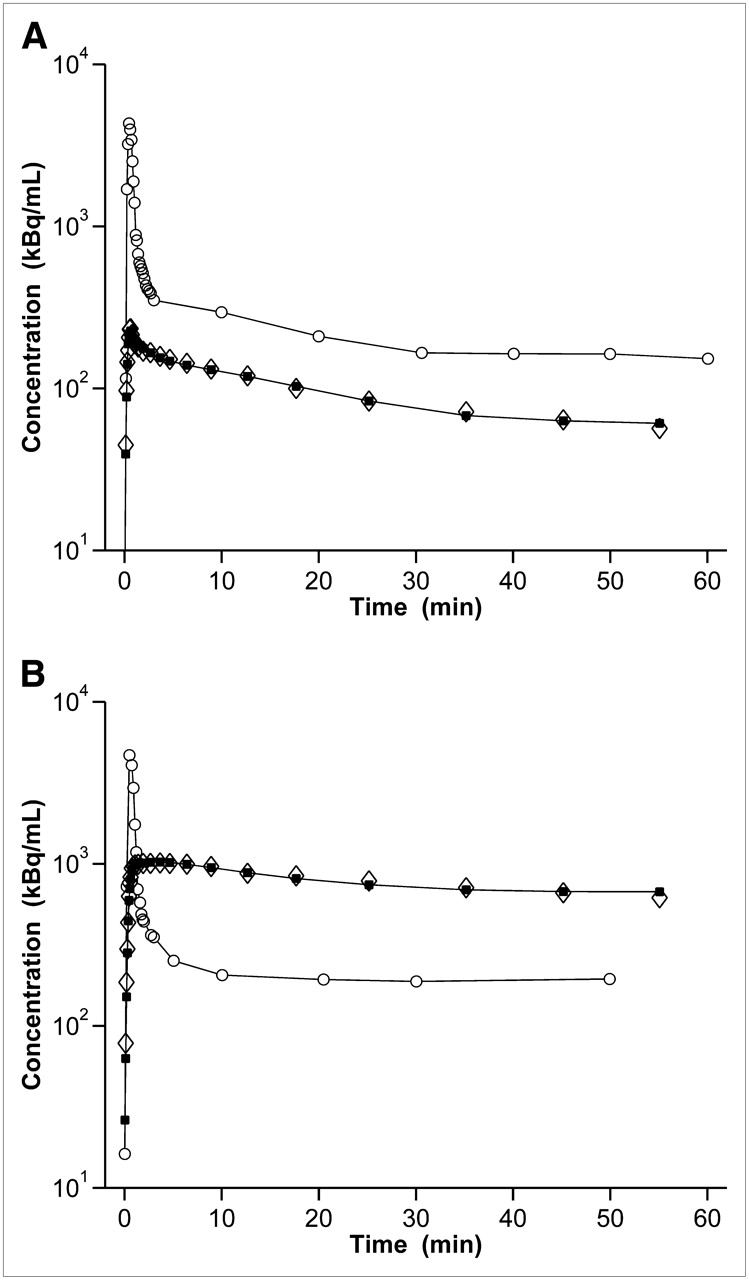
Time–activity curves and fits obtained from 2T4K model in brain of 1 rat: before (A, scan 1) and after (B, scan 3) administration of tariquidar (15 mg/kg). y-axis is in logarithmic scale. ○ = time–activity curve in plasma measured; ⋄ = time–activity curve in brain volume of interest measured; ▪ = time–activity curve in brain volume of interest model.
Because baseline (R)-11C-verapamil PET scans were quite similar for different animals (coefficient of variation of DV values, ∼25%), we abandoned the paired-scan paradigm and conducted a preliminary dose–response evaluation in a few animals (n = 1 per dose) by acquiring single PET scans after administration of 1, 3, 5, or 7.5 mg/kg of tariquidar. The time–activity curves recorded after the different tariquidar pretreatment doses are shown in Figure 7. There was a highly significant correlation between tariquidar dose and the measured DVs of (R)-11C-verapamil (r = 0.94; P < 0.001). A sigmoidal dose–response curve was fitted to the DVs measured after different tariquidar doses. The fitted parameters (estimate ± asymptotic SE) were as follows: ED50, 8.4 ± 9.5 mg/kg; Emax, 4.5 ± 3.8; and n, 1.9 ± 2.0.
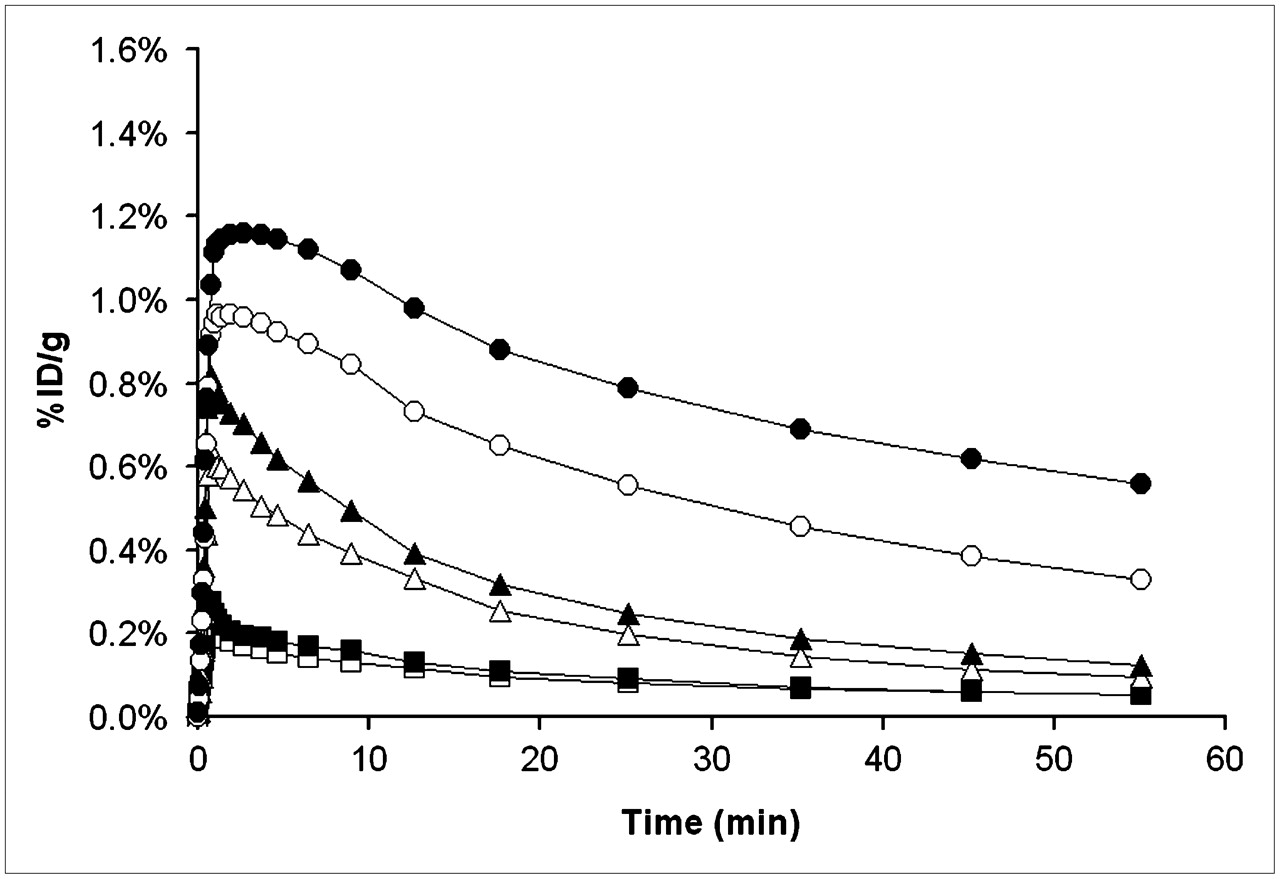
Brain time–activity curves after administration of different tariquidar doses: 0 mg/kg (□, n = 5), 1 mg/kg (▪, n = 1), 3 mg/kg (▵, n = 1), 5 mg/kg (▴, n = 1), 7.5 mg/kg (○, n = 1), and 15 mg/kg (•, n = 5).
Table 2 summarizes the concentration levels of tariquidar in plasma and brain tissue samples collected at the end of the PET scan, that is, about 3 h after intravenous tariquidar administration. Both plasma and brain concentrations of tariquidar correlated strongly with the DVs of (R)-11C-verapamil (plasma concentration: r = 0.85; P = 0.007, brain concentration: r = 0.95; P = 0.001). There was no correlation between plasma tariquidar concentrations and the area under the blood time–activity curves (r = −0.34; P = 0.37).
Concentrations of Tariquidar in Plasma and Brain
DISCUSSION
In this study, we investigated tariquidar-induced modulation of P-gp at the rat BBB by means of small-animal PET with the novel radiotracer (R)-11C-verapamil. A series of previous studies used PET and racemic 11C-verapamil to assess P-gp modulation by older-generation P-gp inhibitors (i.e., cyclosporine A and valspodar) in rats (5,23,24), nonhuman primates (25), and humans (10). In contrast to these previous studies, we used a P-gp inhibitor of the latest generation and analyzed our small-animal PET data by a kinetic modeling approach that allowed us to estimate the rate constants of (R)-11C-verapamil transport across the rat BBB. Thereby, a direct comparison of our rat data with previously acquired human PET data (20,26) using the same radiotracer became possible. Moreover, by modeling (R)-11C-verapamil kinetics in rat brain with and without P-gp inhibition, important data on the functional organization of P-gp–mediated efflux at the BBB could be obtained.
After tariquidar administration, brain uptake of activity was about 12-fold higher than on the baseline PET scans, whereas total blood activity levels were increased only slightly (Figs. 2B and 4). To rule out the possibility that increased brain activity uptake was related to factors other than changes in verapamil transport, we assessed the influence of tariquidar treatment on radiotracer metabolism and plasma protein binding. This is important, as several older-generation P-gp inhibitors, such as valspodar, have been shown to inhibit cytochrome P450 enzymes and thereby increase plasma levels of concomitantly administered therapeutic drugs (27). Our results show that both plasma protein binding and metabolism of (R)-11C-verapamil were essentially left unaffected by tariquidar administration. The latter substantiates that tariquidar displays minimal cytochrome P450–mediated pharmacokinetic interactions (12).
For kinetic modeling of PET data, knowledge of the time course of the radiotracer in arterial blood is required (input function). Because of the small size of the drawn blood samples (2 μL), correction for radiolabeled metabolites of (R)-11C-verapamil was not possible. Luurtsema et al. have previously described the metabolism of (R)-11C-verapamil in the same rat strain as that used for this study (8). In rats, (R)-11C-verapamil is almost exclusively metabolized by N-demethylation, which generates 11C-formaldehyde and other, unidentified, polar metabolites. We initially planned to apply previously reported correction factors (8) to correct total blood activity for polar radiolabeled metabolites. However, analysis of selected plasma samples showed that radiotracer metabolism was considerably slower in our study (87% and 65% vs. 64% and 28% unchanged (R)-11C-verapamil at 10 and 60 min, respectively, after radiotracer injection) (8). It cannot be excluded that the slower rate of radiotracer metabolism observed in our study is related to different forms of anesthesia used in the 2 studies. As radiotracer metabolism was slow for all animals examined in our study, we considered it justified to use total rather than metabolite-corrected blood activity concentrations for the kinetic modeling.
We first used a 1T2K compartment model, as described previously for the analysis of human PET data (7,20). However, this model failed to provide good fits for the PET curves, in particular for the curves measured after tariquidar administration. These curves were characterized by a plateau of activity after peak uptake that was not accurately described by the 1T2K model. The 2T4K model provided considerably better data fits (Fig. 6). A plausible physiologic correlate of the second tissue compartment could be the intracellular space of brain tissue, whereas the first tissue compartment could represent the extracellular space. 11C-verapamil is a lipophilic molecule that can be expected to diffuse well across brain cell membranes into the intracellular tissue compartment. Alternatively, the first tissue compartment could represent the endothelial membrane and the second compartment could represent both the extracellular and the intracellular space of brain tissue, with k3 and k4 describing the combined transport over the abluminal endothelial membrane and between the extra- and intracellular space (28). For some of the model parameters, in particular k3 and k4, the uncertainties were rather large, whereas other parameters (K1 and DV) were fairly robust (Table 1). As compared with human PET data (20,26), the (R)-11C-verapamil baseline DVs were 2- to 3-fold lower in rats, suggesting that P-gp–mediated transport of (R)-11C-verapamil is more efficient at the rat BBB than in the human BBB and thus leads to lower activity concentrations in rat brain. This finding is somewhat in contrast to previous findings by Hsiao et al., who reported that brain-to-blood partition ratios of racemic verapamil were similar in rats and humans (29).
Among all parameters of the 2T4K model, K1 and DV were most affected after tariquidar administration (Table 1). The approximately 8-fold increase of K1 caused by P-gp inhibition is in line with the concept that P-gp acts as a gatekeeper at the BBB and prevents substrates from diffusing across the luminal endothelial cell membrane (28). When the 1T2K model was used, K1 after tariquidar treatment was found to be increased to an extent similar to that for the 2T4K model (+632% for the 1T2K model vs. +711% for the 2T4K model). Similar findings (i.e., that P-gp modulation leads to an increased K1 of verapamil into brain) were also reported by other investigators (30,31).
A recent study by Syvänen et al. found that the efflux rate constant k2 of 11C-verapamil was also a sensitive indicator of P-gp transport across the rat BBB (24). It is important to note that these authors used a set-up different from ours. They first gave 11C-verapamil as a continuous infusion followed by administration of the P-gp inhibitor cyclosporine A 30 min after the start of radiotracer infusion. This set-up implies that 11C-verapamil had already crossed the BBB to a certain extent when the inhibitor was administered. Cyclosporine A might have thereby inhibited the active extrusion of 11C-verapamil from brain parenchyma (“vacuum cleaner” function of P-gp), which could have manifested as a decreased k2. In line with this assumption, we also observed a trend toward k2 decreases in our study (Table 1).
It is noteworthy that scan 2, which was recorded from time 0 to 90 min after tariquidar administration in our study (Fig. 5), was similar to the set-up described by Syvänen et al. (24). At the time when we administered tariquidar, the remainder of circulating activity from the first PET scan should have reached transient equilibrium in plasma and brain. Because our analysis had shown that metabolism of (R)-11C-verapamil was slow, it can be expected that a significant fraction of circulating activity still represented unchanged parent tracer. The time–activity curves shown in Figure 5 apparently reflected the dynamics of the entire inhibition process, including the distribution of intravenously administered tariquidar to P-gp at the BBB. Our data suggest that tariquidar is a fast-acting P-gp inhibitor with relatively low plasma clearance as reflected by the slow decline of activity after peak uptake (Fig. 5).
We performed a preliminary dose–response assessment by administering different tariquidar doses before PET (Fig. 7). A dose of 15 mg/kg was chosen as the maximum dose because an earlier study in a rat model of drug-resistant epilepsy had shown that higher tariquidar doses failed to produce further increases in response to antiepileptic drug treatment and also resulted in side effects of tariquidar (32). It is noteworthy that the estimated ED50 of our study (8.4 mg/kg) is comparable to the ED50 determined in vivo in mice, by conventional biodistribution, for another P-gp substrate (loperamide; ED50, 5.6 mg/kg) (33).
HPLC measurements of tariquidar levels in plasma indicate that the highest studied dose (15 mg/kg) translates to a drug plasma concentration of about 1.7 μM, achieved at 3 h after intravenous drug administration (Table 2). It is generally recognized that only the free fraction of a drug in plasma is able to exert a pharmacologic effect. In humans, tariquidar is bound 99.5% to plasma proteins (Ulrich Elben, written communication, 2008). When one assumes that the drug is bound to a similar extent to plasma proteins in rats, its unbound concentration attained after administration of the 15 mg/kg dose (Table 2) would correspond to about 0.01 μM, which is in a range similar to the in vitro half-maximum inhibition constant of the drug (0.04 μM) (13). In humans, a single intravenous dose of 2 mg/kg of tariquidar was well tolerated and produced maximum plasma concentrations (Cmax) of about 2.3 μM (12), corresponding to an unbound concentration of about 0.012 μM. Therefore, it seems reasonable to assume that clinically safe doses of tariquidar will result in a significant degree of cerebral P-gp blockade in humans.
Combined treatment with neurologic drugs (e.g., antiepileptic drugs) and a P-gp modulator such as tariquidar is a promising approach for overcoming P-gp–mediated drug resistance (2). The approach used in this study could be translated to future clinical trials with P-gp modulators in brain disorders to define appropriate clinical starting doses of these drugs in humans. The approach could also be used to define the time window of P-gp modulation to optimize the time point of therapeutic drug administration. Another clinical application of (R)-11C-verapamil PET could be to identify neurologic patients with pronounced cerebral P-gp activity, who would most likely benefit from continued treatment with P-gp–modulating drugs.
CONCLUSION
Our data demonstrate that (R)-11C-verapamil PET combined with tariquidar administration is a useful approach for the assessment of P-gp function at the BBB. It holds great promise for a future translation to animal models of drug resistance, as well to studies in healthy volunteers and patients. We were able to show that tariquidar is a potent and fast-acting inhibitor of cerebral P-gp that led, at the highest studied dose (15 mg/kg), to a 12-fold increase of the DV of (R)-11C-verapamil in rat brain. The increased DV could be attributed to an 8-fold increased K1 of activity into the brain.
Acknowledgments
The research leading to these results has received funding from the European Community's Seventh Framework Programme (FP7/2007-2013) under grant agreement number 201380. Aiman Abrahim is employed by the Austrian Science Fund (FWF) project “Transmembrane Transporters in Health and Disease” (SFB F35). Gert Luurtsema, Mark Lubberink, and Adriaan Lammertsma (Department of Nuclear Medicine and PET Research, VU University Medical Center, Amsterdam, The Netherlands) are gratefully acknowledged for help with setting up the (R)-11C-verapamil PET procedure in our laboratory and Marie-Claude Asselin (Wolfson Molecular Imaging Centre, Manchester, U.K.) for critical reading of the manuscript. We also thank Andreas Krcal, Thomas Zenz (Department of Nuclear Medicine), and Markus Kraus (Austrian Research Centers) for technical assistance with the radiosynthesis of (R)-11C-verapamil and Maria Zsebedics (Austrian Research Centers) for help with handling of laboratory animals. We are indebted to Peter Angelberger and Herbert Kvaternik (Austrian Research Centers) for continuous support and scientific advice. Tariquidar was kindly provided by Xenova Ltd. (Slough, Berkshire, U.K.).
Footnotes
-
↵* Contributed equally to this work.
-
COPYRIGHT © 2008 by the Society of Nuclear Medicine, Inc.
References
- Received for publication January 29, 2008.
- Accepted for publication April 11, 2008.


Jump to section
Related Articles
Cited By...
- ABCB1 and ABCG2 Regulation at the Blood-Brain Barrier: Potential New Targets to Improve Brain Drug Delivery
- Enhancing Target Tissue Levels and Diminishing Plasma Clearance of Ionizing Zwitterionic Antidotes in Organophosphate Exposures
- Calculation of an Apical Efflux Ratio from P-Glycoprotein (P-gp) In Vitro Transport Experiments Shows an Improved Correlation with In Vivo Cerebrospinal Fluid Measurements in Rats: Impact on P-gp Screening and Compound Optimization
- Rapid in vivo measurement of {beta}-amyloid reveals biphasic clearance kinetics in an Alzheimers mouse model
- Simultaneous Semimechanistic Population Analyses of Levofloxacin in Plasma, Lung, and Prostate To Describe the Influence of Efflux Transporters on Drug Distribution following Intravenous and Intratracheal Administration
- Modulation of P-glycoprotein at the Human Blood-Brain Barrier by Quinidine or Rifampin Treatment: A Positron Emission Tomography Imaging Study
- Quantification of Dynamic 11C-Phenytoin PET Studies
- Coadministration of P-Glycoprotein Modulators on Loperamide Pharmacokinetics and Brain Distribution
- Altered GABAA Receptor Density and Unaltered Blood-Brain Barrier Transport in a Kainate Model of Epilepsy: An In Vivo Study Using 11C-Flumazenil and PET
- A Novel Positron Emission Tomography Imaging Protocol Identifies Seizure-Induced Regional Overactivity of P-Glycoprotein at the Blood-Brain Barrier
- A Pilot Study to Assess the Efficacy of Tariquidar to Inhibit P-glycoprotein at the Human Blood-Brain Barrier with (R)-11C-Verapamil and PET