


Article Figures & Data
Figures
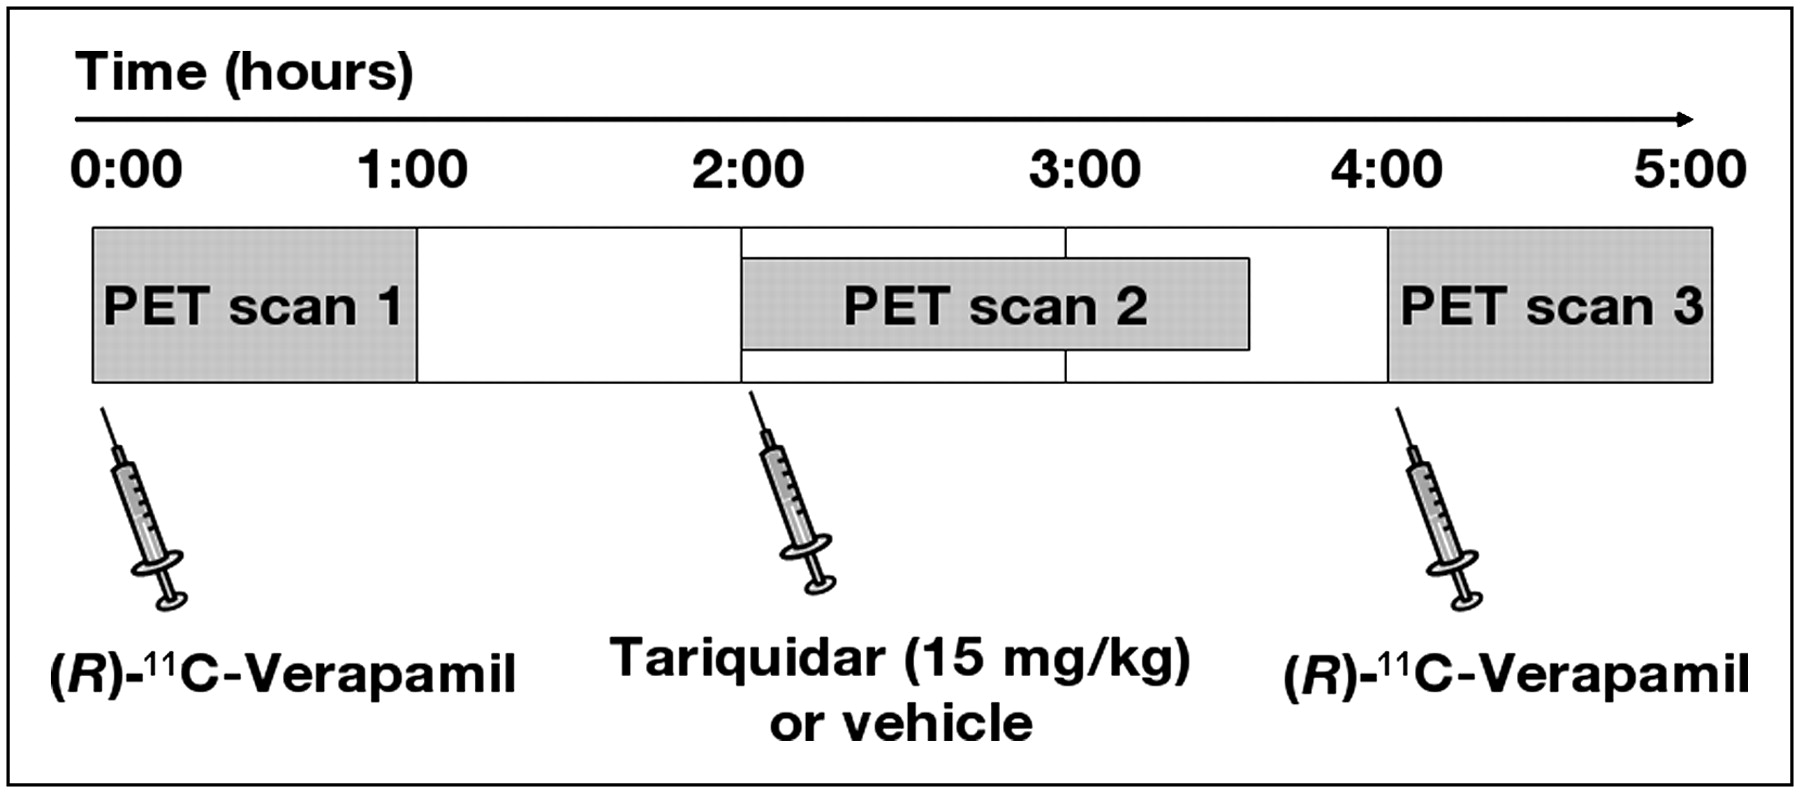
- FIGURE 1.
Diagram of study set-up. After (R)-11C-verapamil PET scan 1, tariquidar (15 mg/kg, n = 5) or vehicle (n = 2) was administered intravenously and was followed by scan 2, which measured remainder of circulating activity from scan 1. At 3 h after scan 1, (R)-11C-verapamil PET scan 3 was acquired.
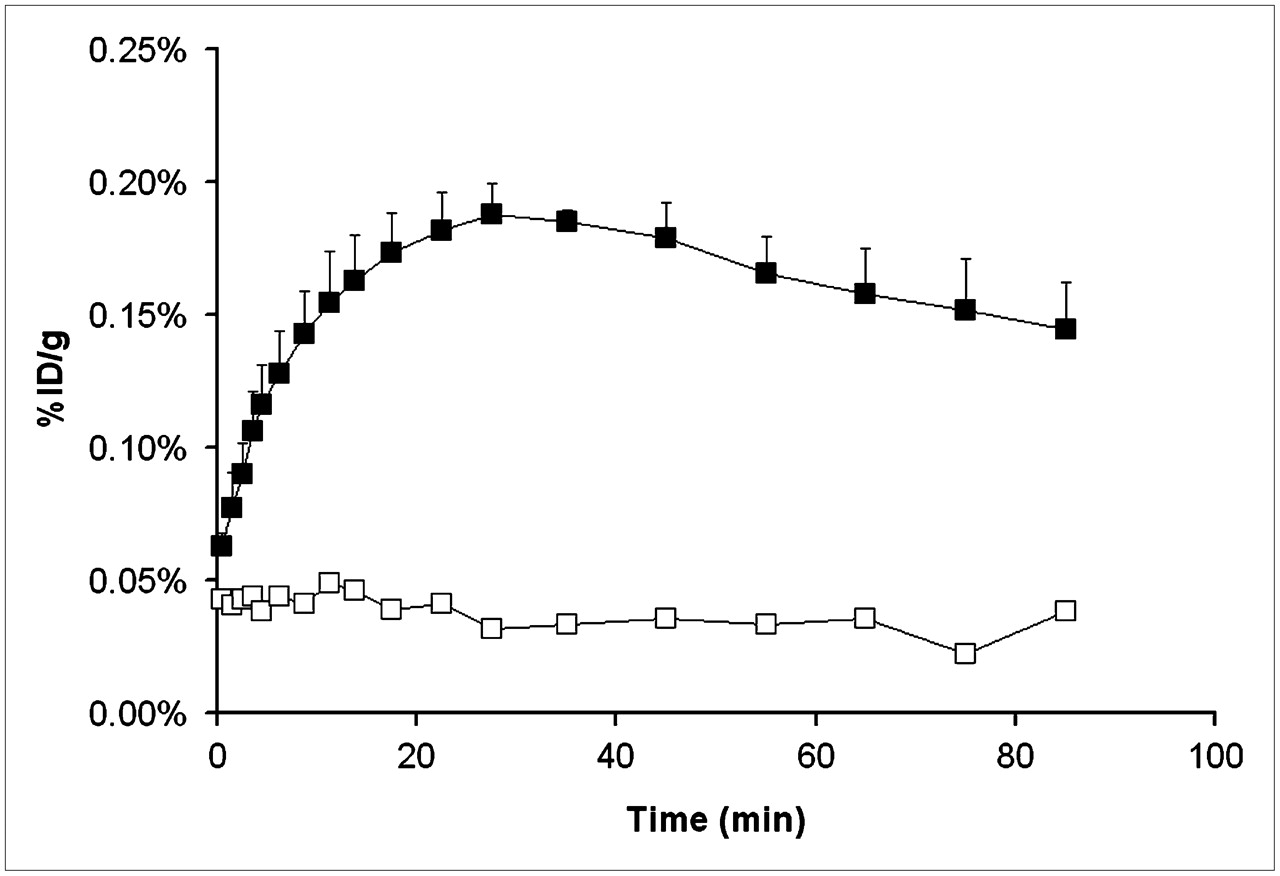
- FIGURE 2.
Time–activity curves in rat brain for (R)-11C-verapamil PET scans recorded before (□, n = 2, scan 1) and after (▪, n = 2, scan 3) administration of vehicle (A) and before (□, n = 5, scan 1) and after (▪, n = 5, scan 3) administration of tariquidar (15 mg/kg) (B). Activity concentration is expressed as mean percentage injected dose per gram (±SD).
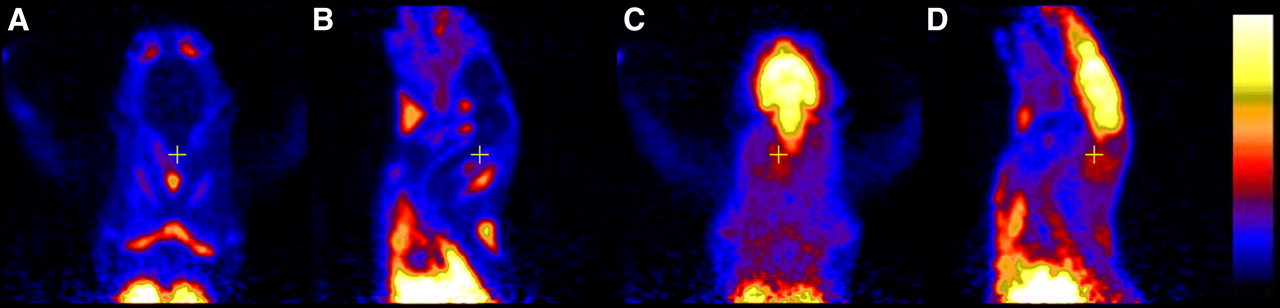
- FIGURE 3.
Transversal (A and C) and sagittal (B and D) PET summation images (0–60 min) recorded before (A and B, scan 1) and after (C and D, scan 3) administration of tariquidar (15 mg/kg). The radiation scale was set from 0 to 700 kBq/mL.
- FIGURE 4.
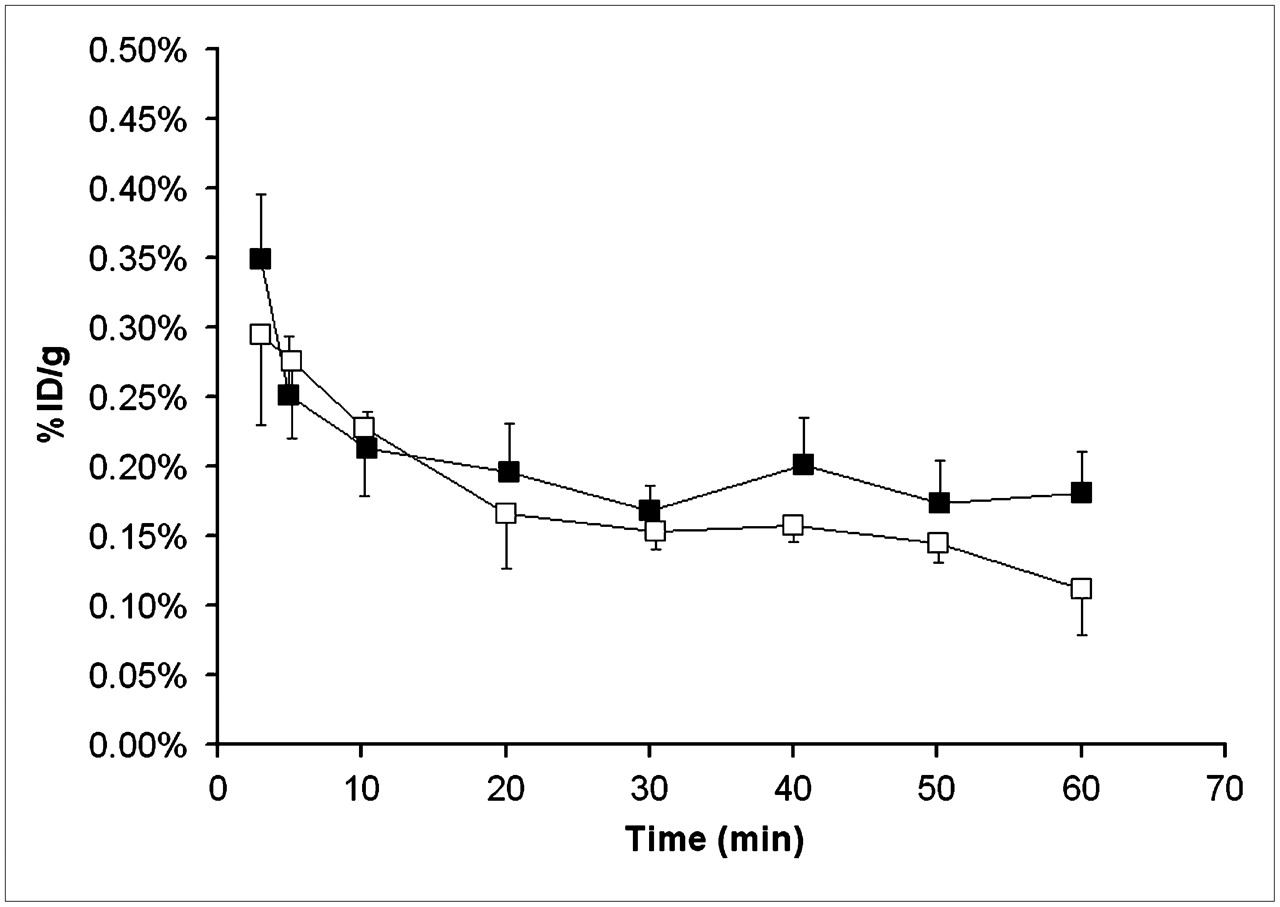
Total activity concentrations in whole blood before (□, n = 5, scan 1) and after (▪, n = 5, scan 3) administration of tariquidar (15 mg/kg). Activity concentration is expressed as mean percentage injected dose per gram (±SD).
- FIGURE 5.
Brain time–activity curves for PET scan 2 recorded from 0 to 90 min after administration of vehicle (□, n = 2) or tariquidar, 15 mg/kg (▪, n = 5). PET scan 2 measured remainder of circulating activity from scan 1. Activity concentration is expressed as mean percentage injected dose per gram (±SD for n = 5).
- FIGURE 6.
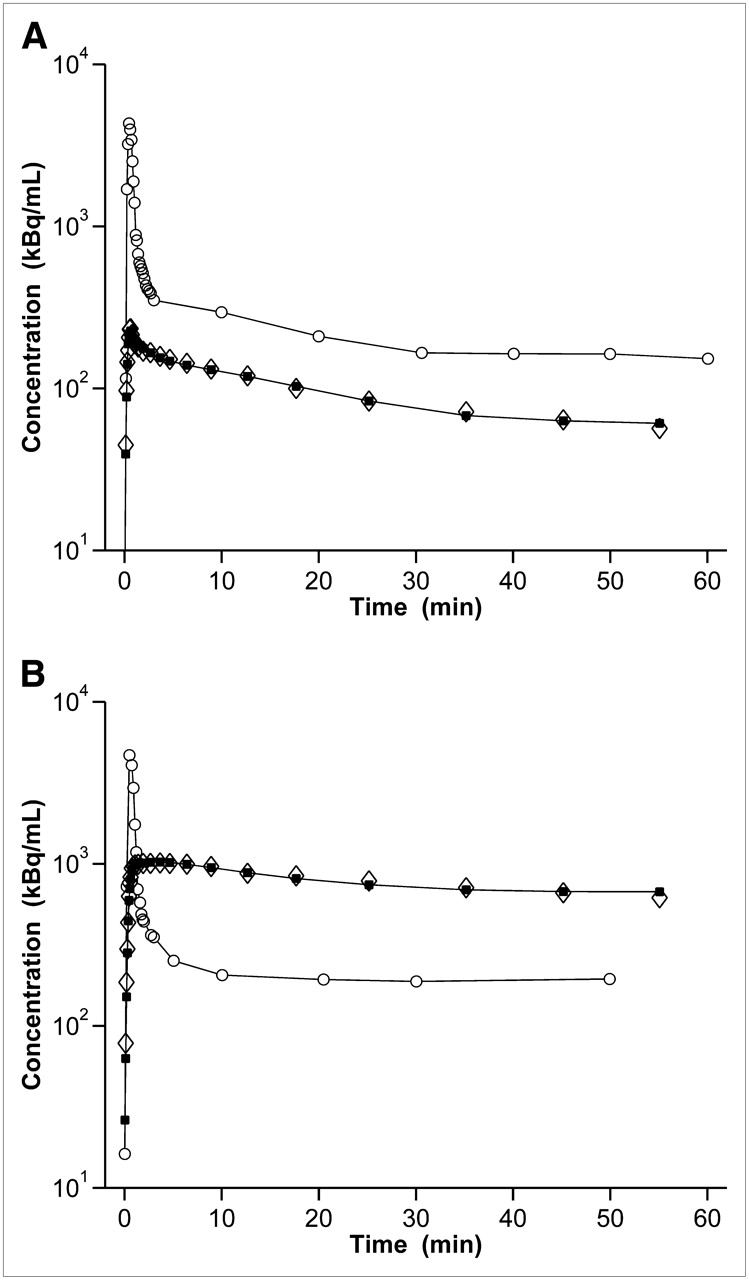
Time–activity curves and fits obtained from 2T4K model in brain of 1 rat: before (A, scan 1) and after (B, scan 3) administration of tariquidar (15 mg/kg). y-axis is in logarithmic scale. ○ = time–activity curve in plasma measured; ⋄ = time–activity curve in brain volume of interest measured; ▪ = time–activity curve in brain volume of interest model.
- FIGURE 7.
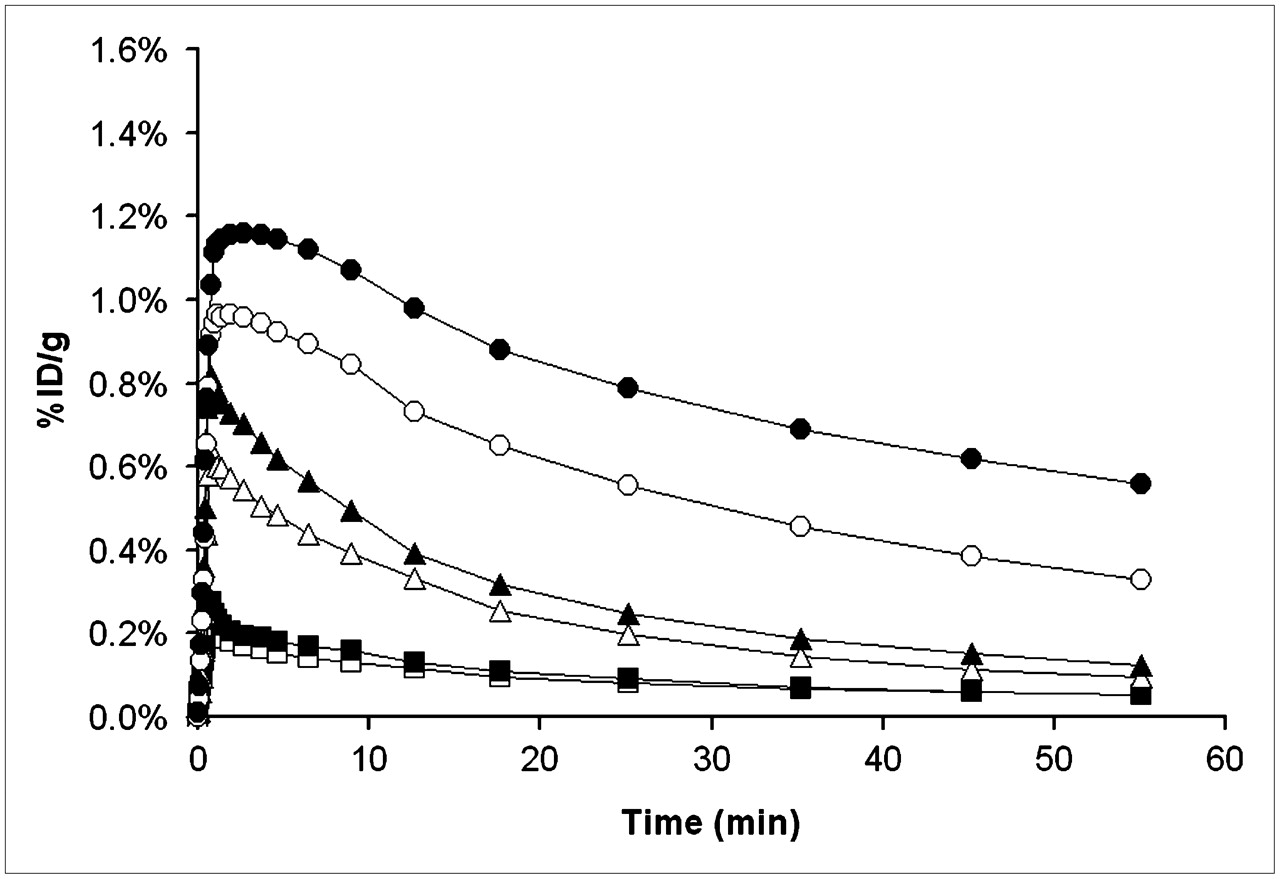
Brain time–activity curves after administration of different tariquidar doses: 0 mg/kg (□, n = 5), 1 mg/kg (▪, n = 1), 3 mg/kg (▵, n = 1), 5 mg/kg (▴, n = 1), 7.5 mg/kg (○, n = 1), and 15 mg/kg (•, n = 5).


Tables
Parameter Without tariquidar (n = 9) With tariquidar* (n = 5) Relative change (%) K1 (mL·mL−1·min−1) 0.07 ± 0.03 (16) 0.58 ± 0.20 (9) +711† k2 (min−1) 0.34 ± 0.06 (69) 0.27 ± 0.07 (43) −23 k3 (min−1) 0.29 ± 0.22 (395) 0.37 ± 0.17 (66) +27 k4 (min−1) 0.73 ± 0.29 (225) 0.66 ± 0.49 (55) −9 DV (mL·mL−1) 0.30 ± 0.08 (4) 3.68 ± 0.81 (3) +1,137† DV (Logan) (mL·mL−1) 0.32 ± 0.08 (1) 3.53 ± 0.79 (1) +1,007† ↵* Administered intravenously at dose of 15 mg/kg 2 h before start of PET scan.
↵† Statistically significant difference (paired t test, P < 0.005). For statistical testing, only paired data from scans 1 and 3 were considered (n = 5).
Outcome parameters are given as mean ± SD. Mean estimated coefficient of variance in percentage for each parameter is given in parentheses.
Tariquidar dose (mg/kg) Plasma (ng/mL) Brain (ng/mL) 15 (n = 5) 1,402 ± 296 4,131 ± 1,638 7.5 (n = 1) 911 2,570 5 (n = 1) 807 1,584 3 (n = 1) 266 1,449 Concentrations were determined 3 h after intravenous administration of different doses of tariquidar. For 15 mg/kg dose, data are mean ± SD.


Jump to section
Related Articles
Cited By...
- ABCB1 and ABCG2 Regulation at the Blood-Brain Barrier: Potential New Targets to Improve Brain Drug Delivery
- Enhancing Target Tissue Levels and Diminishing Plasma Clearance of Ionizing Zwitterionic Antidotes in Organophosphate Exposures
- Calculation of an Apical Efflux Ratio from P-Glycoprotein (P-gp) In Vitro Transport Experiments Shows an Improved Correlation with In Vivo Cerebrospinal Fluid Measurements in Rats: Impact on P-gp Screening and Compound Optimization
- Rapid in vivo measurement of {beta}-amyloid reveals biphasic clearance kinetics in an Alzheimers mouse model
- Simultaneous Semimechanistic Population Analyses of Levofloxacin in Plasma, Lung, and Prostate To Describe the Influence of Efflux Transporters on Drug Distribution following Intravenous and Intratracheal Administration
- Modulation of P-glycoprotein at the Human Blood-Brain Barrier by Quinidine or Rifampin Treatment: A Positron Emission Tomography Imaging Study
- Quantification of Dynamic 11C-Phenytoin PET Studies
- Coadministration of P-Glycoprotein Modulators on Loperamide Pharmacokinetics and Brain Distribution
- Altered GABAA Receptor Density and Unaltered Blood-Brain Barrier Transport in a Kainate Model of Epilepsy: An In Vivo Study Using 11C-Flumazenil and PET
- A Novel Positron Emission Tomography Imaging Protocol Identifies Seizure-Induced Regional Overactivity of P-Glycoprotein at the Blood-Brain Barrier
- A Pilot Study to Assess the Efficacy of Tariquidar to Inhibit P-glycoprotein at the Human Blood-Brain Barrier with (R)-11C-Verapamil and PET