


Visual Abstract

Abstract
Better biomarkers are needed to predict treatment outcome in non–small cell lung cancer (NSCLC) patients treated with anti–programmed death-1/programmed death-ligand 1 (PD-1/PD-L1) checkpoint inhibitors. PD-L1 immunohistochemistry has limited predictive value, possibly because of tumor heterogeneity of PD-L1 expression. Noninvasive PD-L1 imaging using 89Zr-durvalumab might better reflect tumor PD-L1 expression. Methods: NSCLC patients eligible for second-line immunotherapy were enrolled. Patients received 2 injections of 89Zr-durvalumab: one without a preceding dose of unlabeled durvalumab (tracer dose only) and one with a preceding dose of 750 mg of durvalumab, directly before tracer injection. Up to 4 PET/CT scans were obtained after tracer injection. After imaging acquisition, patients were treated with 750 mg of durvalumab every 2 wk. Tracer biodistribution and tumor uptake were visually assessed and quantified as SUV, and both imaging acquisitions were compared. Tumor tracer uptake was correlated with PD-L1 expression and clinical outcome, defined as response to durvalumab treatment. Results: Thirteen patients were included, and 10 completed all scheduled PET scans. No tracer-related adverse events were observed, and all patients started durvalumab treatment. Biodistribution analysis showed 89Zr-durvalumab accumulation in the blood pool, liver, and spleen. Serial imaging showed that image acquisition 120 h after injection delivered the best tumor–to–blood pool ratio. Most tumor lesions were visualized with the tracer dose only versus the coinjection imaging acquisition (25% vs. 13.5% of all lesions). Uptake heterogeneity was observed within (SUVpeak range, 0.2–15.1) and between patients. Tumor uptake was higher in patients with treatment response or stable disease than in patients with disease progression according to RECIST 1.1. However, this difference was not statistically significant (median SUVpeak, 4.9 vs. 2.4; P = 0.06). SUVpeak correlated better with the combined tumor and immune cell PD-L1 score than with PD-L1 expression on tumor cells, although neither was statistically significant (P = 0.06 and P = 0.93, respectively). Conclusion: 89Zr-durvalumab was safe, without any tracer-related adverse events, and more tumor lesions were visualized using the tracer dose–only imaging acquisition. 89Zr-durvalumab tumor uptake was higher in patients with a response to durvalumab treatment but did not correlate with tumor PD-L1 immunohistochemistry.
With the introduction of immunotherapy, the treatment of non–small cell lung cancer (NSCLC) changed dramatically. Multiple trials with programmed death ligand 1 (PD-L1) checkpoint inhibitors in patients with (locally) advanced NSCLC have shown improved survival outcomes as compared with standard-of-care cytotoxic chemotherapy (1–5). Unfortunately, not all patients with NSCLC benefit equally, and the search for biomarkers that can predict treatment outcome is ongoing. Although PD-L1 immunohistochemistry and tumor mutational burden are associated with clinical benefit from checkpoint inhibitor therapy, they are far from perfect (6–9).
PD-L1 expression is a biopsy-based biomarker, with the disadvantage that a small biopsy specimen does not capture the full extent of tumor heterogeneity of PD-L1 expression and is associated with a higher chance of a false-negative test result (6–8,10). In addition, substantial heterogeneity of PD-L1 expression can be observed within and between tumor lesions of the same patient (11). As a consequence of this lack of a good predictive biomarker, most patients with advanced-stage NSCLC are treated with a PD-L1 checkpoint inhibitor, with or without chemotherapy (2,5). Inherently, a large patient group is treated with a potentially toxic treatment without clinical benefit.
Noninvasive biomarkers that can overcome the problem of intra- and intertumor heterogeneity are needed. Visualization and quantification of PD-L1 expression on all tumor cells could potentially be such a biomarker, and recent clinical studies have shown that with PD-L1–directed tracers such as 89Zr-labeled atezolizumab and nivolumab, 18F-BMS-986192, and 99mTc-NM-01, tumor lesions could be visualized and tracer uptake could be correlated with PD-L1 expression on tumor cells (12–14).
After the results of the PACIFIC trial, adjuvant durvalumab was registered for stage III NSCLC patients treated with concurrent platinum-based chemotherapy and radiation therapy (15). Adjuvant durvalumab prolonged progression-free survival (PFS) significantly, and this also resulted in an overall survival (OS) benefit (16). However, there is still a large group of patients with disease relapse despite adjuvant durvalumab treatment. In the advanced-disease setting, the phase III MYSTIC trial evaluated durvalumab with or without tremelimumab and compared these treatments with standard chemotherapy as the first-line treatment for patients with stage IV NSCLC (17). Unfortunately, the primary endpoint of an improved OS was not met. This result supports the need for a better biomarker that can select patients who can benefit from durvalumab or durvalumab–tremelimumab combination treatment.
In this paper, we report the results of the first (to our knowledge) clinical PET imaging study conducted with 89Zr-labeled durvalumab, an anti–PD-L1 monoclonal antibody, in patients with advanced-stage NSCLC. Imaging series were obtained after injection of a single tracer dose and after a combined injection with a full dose of unlabeled durvalumab and the tracer dose. The aim of this study was to investigate the safety and feasibility of 89Zr-durvalumab PET/CT and to explore the relation of the imaging results to PD-L1 immunohistochemistry and treatment response. Because of the heterogeneity of PD-L1 expression in primary and metastatic lesions of individual patients, we hypothesize that 89Zr-durvalumab PET/CT will show substantial differences in tracer uptake between lesions and allow exploration of the relation of the imaging results to clinical parameters such as PD-L1 immunohistochemistry and treatment response. This study was not powered to evaluate the predictive value of 89Zr-durvalumab PET/CT for PD-L1 immunohistochemistry or treatment outcome. To study the safety and feasibility, 10 patients were required. The protocol allowed enrollment of additional patients in case a patient did not complete the PET scan acquisition.
MATERIALS AND METHODS
Patients
Patients with stage IV NSCLC who had progressed after at least 1 line of platinum-based doublet chemotherapy were asked to participate in this study. Earlier treatment with PD-L1 checkpoint inhibitors was not allowed. The study was conducted in accordance with the Declaration of Helsinki and was approved by the Institutional Review Board of the Amsterdam University Medical Centers for the Vrije Universiteit location. Before inclusion, each patient gave written informed consent after receiving a verbal and written explanation. The trial was registered at www.clinicaltrialsregister.eu (identifier 2019-000670-37).
Key eligibility criteria were pathologically proven EGFR-negative (wild-type) and ALK fusion–negative NSCLC, measurable disease according to RECIST 1.1 (18), an Eastern Cooperative Oncology Group performance status of 0–1, and the willingness to undergo a histologic biopsy immediately before the start of the study. The main exclusion criteria were symptomatic central nervous system metastases, use of corticosteroids with an equivalent of more than 10 mg of prednisone per day, or active autoimmune disease.
Tumor Biopsies
Histologic tumor biopsies were obtained before the first 89Zr-durvalumab injection and after the last line of systemic therapy. Biopsies were obtained from 1 lesion (metastasis or primary tumor, depending on the size and location of the individual lesions) per patient. An experienced thoracic pathologist, unaware of the clinical information, evaluated the histology slides. Tumor PD-L1 expression was scored for tumor cells, the tumor proportion score (TPS), and—for both tumor and immune cells—the combined positive score (CPS) (19,20). Details on histochemical stains are found in Supplemental Table 1 (supplemental materials are available at http://jnm.snmjournals.org).
Baseline Characteristics of Patients Included in Study
Durvalumab Radiolabeling
89Zr was purchased from Perkin-Elmer and coupled to durvalumab (human IgG1 κ-monoclonal antibody; primary route of elimination, protein catabolism; half-life, 18 d) (21) via the bifunctional chelator N-succinyl-desferal-tetrafluorophenyl ester (22). 89Zr-durvalumab is produced in compliance with current good manufacturing practices at Amsterdam University Medical Centers for the Vrije Universiteit location. The procedures for radiolabeling of durvalumab with 89Zr have been validated with respect to the final quality of the prepared conjugate and the production process. Details can be found in the supplemental materials.
Study Design
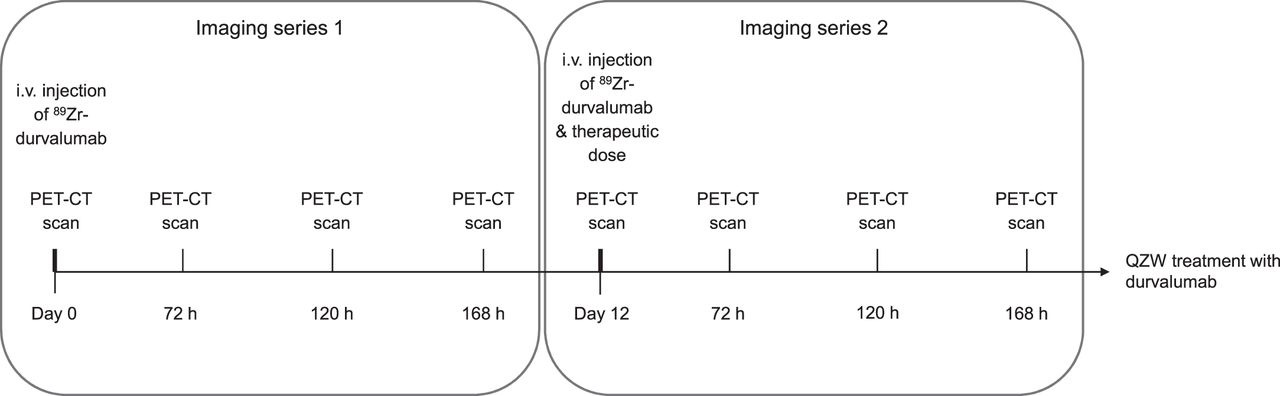
Two imaging series were scheduled for all included patients (Fig. 1). Whole-body (vertex to mid thigh) PET/CT with 89Zr-durvalumab as the radiotracer was performed after injection of a single dose of the tracer (37 MBq, 2 mg of 89Zr-durvalumab) on day 1. Twelve days later, a therapeutic nonradiolabeled dose of 750 mg of durvalumab was administered, followed within 2 h by a tracer dose injection (37 MBq, 2 mg of 89Zr-durvalumab). This interval of 2 h resulted in a situation comparable to a simultaneous coadministration, because of the slow tissue uptake of large mAbs from the blood pool (23). The second imaging series was intended to overcome a possible sink effect: a small amount of radiotracer might be rapidly cleared from the circulation and accumulate in the liver, spleen, or other organs or compartments. This effect might be overcome by predosing with nonradiolabeled durvalumab, resulting in availability of sufficient amounts of radiotracer in the circulation for binding to PD-L1 receptors in tumor tissue. The first 3 enrolled patients were scanned 1, 72, 120, and 168 h after injection (for biodistribution purposes), both after the tracer only and after the combined radiolabeled and nonradiolabeled durvalumab injection. Subsequent patients underwent 2 PET scans after each tracer injection (72 and 120 h). The interval between the first 89Zr-durvalumab injection and the second injection of combined tracer and nonradiolabeled durvalumab was 12 d, allowing for decay of radioactivity.
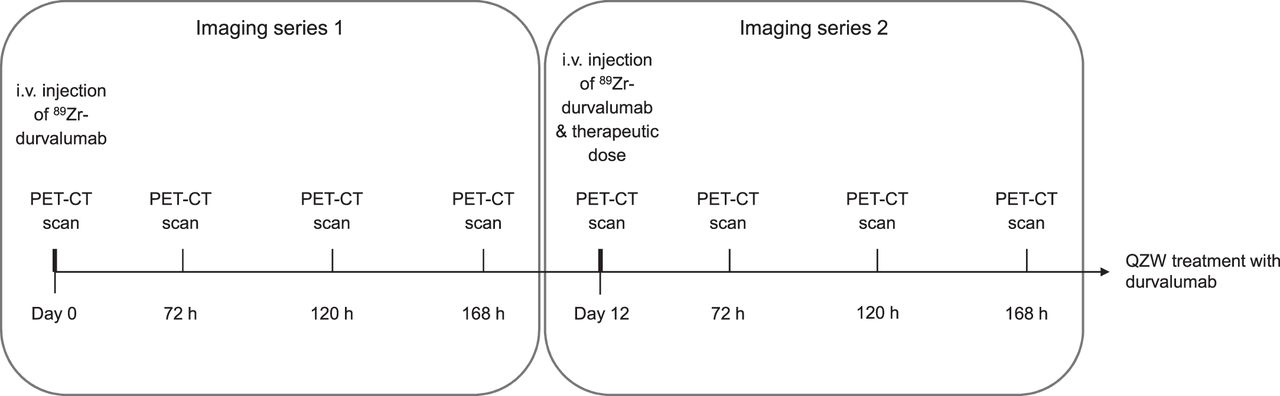
First 3 included patients received 4 PET/CT scans after each tracer injection (1, 72, 120, and 168 h after injection). Subsequent patients were scanned at 72 and 120 h after injection. i.v. = intravenous; QZW = once every two weeks.
An 18F-FDG PET scan, a diagnostic CT scan of the thorax and upper abdomen, and brain MRI were obtained before the initiation of treatment. After the image acquisition, durvalumab (750-mg flat dose) was administered every 2 wk until disease progression, unacceptable toxicity, or withdrawal of consent. Response was assessed with a diagnostic contrast-enhanced CT scan of the thorax and upper abdomen every 6 wk during treatment and interpreted according to RECIST 1.1 (18).
PET/CT Scan Analysis
Tumor lesions were identified and segmented on the 89Zr-PET images using in-house–developed software (24), while also using the low-dose CT scan. The baseline 18F-FDG PET/CT and diagnostic CT scans were used to differentiate between benign and malignant lesions. Volumes of interest (VOIs) were manually delineated over the entire tumor lesions when they could be distinguished from background on the attenuation-corrected images of the PET scan. In the case of tumor lesions without evident visual 89Zr uptake, a spheric VOI of 1 cm3 was drawn at the anatomic location of the tumor lesion, based on the low-dose CT, 18F-FDG PET, and diagnostic CT data. To quantify radiotracer uptake in normal tissue, a fixed VOI with a diameter of 2 cm (4.2 cm3) was used. Tracer uptake in all delineated VOIs was semiquantitatively assessed as SUV. From each VOI, the mean and peak activity concentrations (Bq/mL) were derived, normalized for body weight. SUVmean was reported for normal-tissue tracer uptake, and SUVpeak was reported for tumor lesions. SUVpeak was used to minimize the noise effect of 89Zr, as SUVmax is based on only 1 voxel (25). To avoid partial-volume effects, only tumor lesions exceeding 20 mm in long-axis diameter were included in the analysis.
Blood Samples
For the first 3 patients, venous blood samples (7 mL each) were collected to determine 89Zr-durvalumab activity at 5, 30, 60, and 120 min after injection and on days 3, 5, and 7 after injection. For the other patients, the samples were collected at 5 and 30 min after injection and on days 3 and 5 after injection.
Adverse Events
Tracer-related adverse events were recorded from the time of injection of the first tracer dose to the second full dose of durvalumab, which was 2 wk after the second imaging series. Before the first and second doses of durvalumab, patients visited the outpatient clinic for a review of adverse events. This consisted of a full physical examination and a laboratory assessment, including complete blood count, comprehensive serum chemistry, and thyroid-stimulating hormone level. The National Cancer Institute Common Terminology Criteria for Adverse Events, version 4.0, were used to score adverse events (26).
Statistical Analysis
A Mann–Whitney U test was used to compare the SUVpeak of all lesions (long axis diameter ≥ 20 mm) in the different groups with and without progressive disease. Progressive disease was defined according to RECIST 1.1. The Kruskal–Wallis test was used to compare the SUVpeak in all response categories according to RECIST 1.1 (progressive disease, stable disease, partial response, and complete response). Further, the relation between the lesion-based 89Zr-durvalumab accumulation and PD-L1 expression as assessed with immunohistochemistry (PD-L1 expression: 0%, 1%–49%, ≥50%) was also explored with the Kruskal–Wallis test.
The median SUVpeak of all delineated lesions (long axis diameter ≥ 20 mm) in the entire cohort was calculated and used to divide the patients into groups with high and low uptake. PFS and OS were summarized using Kaplan–Meier plots.
P values of less than 0.05 were considered to be statistically significant. All statistical analyses were performed using SPSS Statistics, version 25.0 (IBM), for Microsoft Windows.
RESULTS
Patients
Thirteen patients were enrolled between April 2018 and June 2019 (Table 1). All patients had pathologically confirmed NSCLC and confirmed progressive disease on prior chemotherapy. All patients received their first tracer dose injection. Eleven of 13 patients also received the second tracer injection according to the study protocol. One patient died as a result of rapidly progressive disease between scans, and 2 patients withdrew consent before the second imaging series. For the first 3 patients, the more extensive imaging protocol was followed (Supplemental Table 2).
Adverse Events
Patients started durvalumab treatment on the day of the second tracer administration and received an average of 7 cycles of durvalumab (range, 1–21; median, 3). A response evaluation after 6 wk was performed on 7 of 13 patients; the other patients progressed earlier or died. The best observed response was a partial response in 3 patients, stable disease in 2 patients, and progressive disease in 1 patient. One patient was not evaluable according to RECIST 1.1.
The reasons for treatment discontinuation were death or progressive disease in 10 patients, durvalumab-related pneumonitis in 1 patient, the coronavirus disease 2019 pandemic in 1 patient, and the request of 1 patient because of sicca symptoms, grade II, probably related to durvalumab treatment. The median PFS was 1.3 mo (95% CI, 0.0–3.8), and median OS was 4.8 mo (95% CI, 0.2–9.4).
Biodistribution of 89Zr-Durvalumab
PET imaging 1 h after injection (without a predose of unlabeled durvalumab) showed that 89Zr-durvalumab uptake was present mainly in the blood pool (average SUVmean, 7.2), liver (average SUVmean, 6.7), and spleen (SUVmean, 15.1). The 89Zr-durvalumab activity in the blood pool decreased over time (average SUVmean, 1.6 at 120 h) and was stable in the liver and bone marrow. The spleen showed the highest uptake, with a peak at 72 h after injection (average SUVmean, 20.0). Low uptake was seen in the kidneys, non–tumor-bearing lung tissue, and brain (Figs. 2A and 2C; Supplemental Fig. 1).
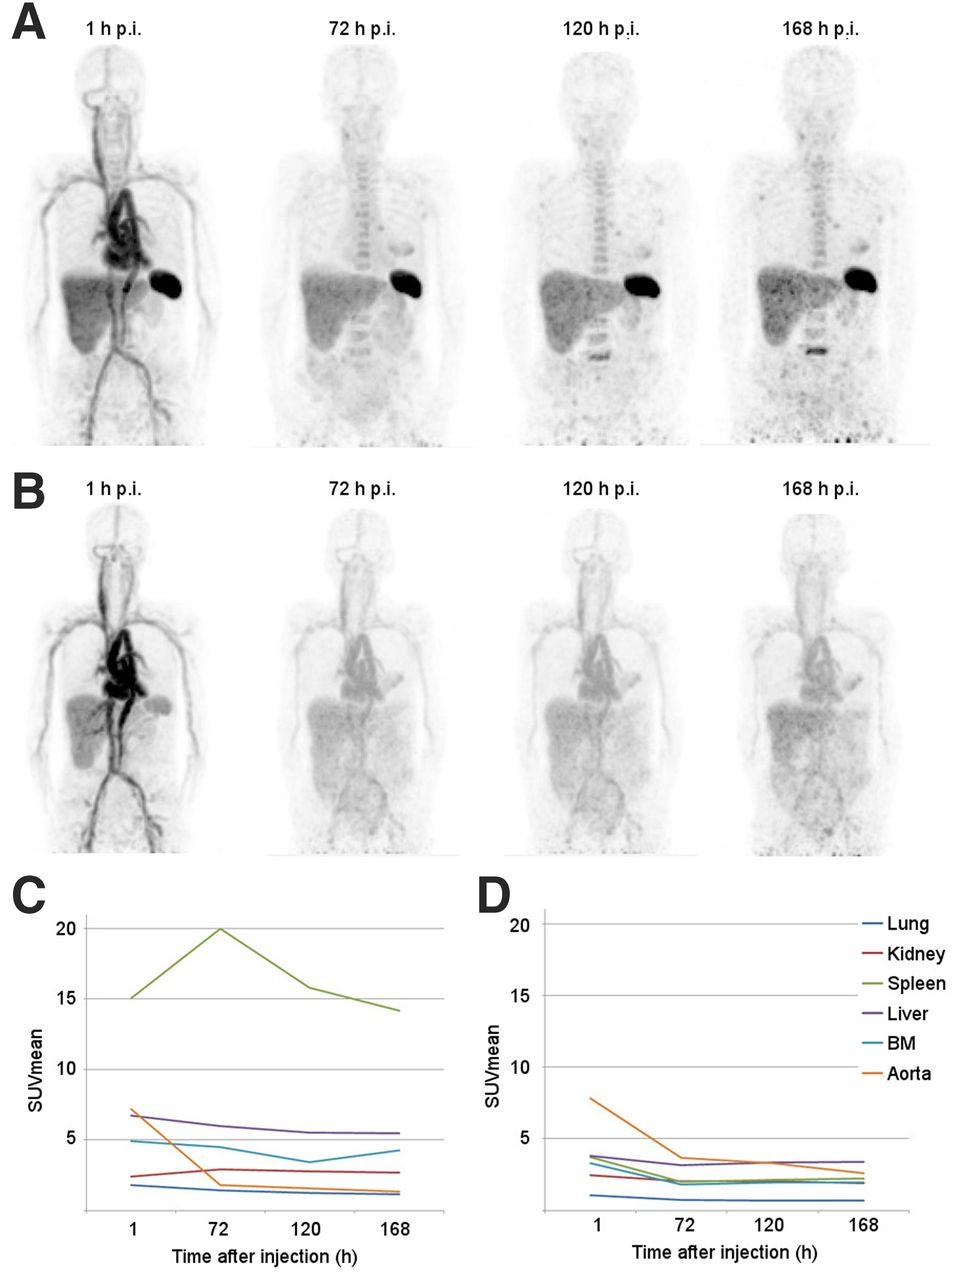
(A) Biodistribution at 1, 72, 120, and 168 h after injection of tracer dose (2 mg) only. (B) Biodistribution at 1, 72, 120, and 168 h after injection of tracer dose (2 mg) with unlabeled predose (750 mg) of durvalumab. (C) Average SUVmean of first 3 patients per organ without unlabeled predose of durvalumab. (D) Average SUVmean of patients 2 and 3 per organ with unlabeled predose of durvalumab. BM = bone marrow; p.i. = after injection.
When 89Zr-durvalumab was administered after a nonradiolabeled therapeutic dose of durvalumab, a different pattern was observed. The extent of 89Zr-durvalumab in the blood pool at 1 h after injection was comparable to that in the first imaging series but remained 2-fold higher in the following scans than in the first series. This large difference was confirmed by the venous plasma samples (Fig. 3).
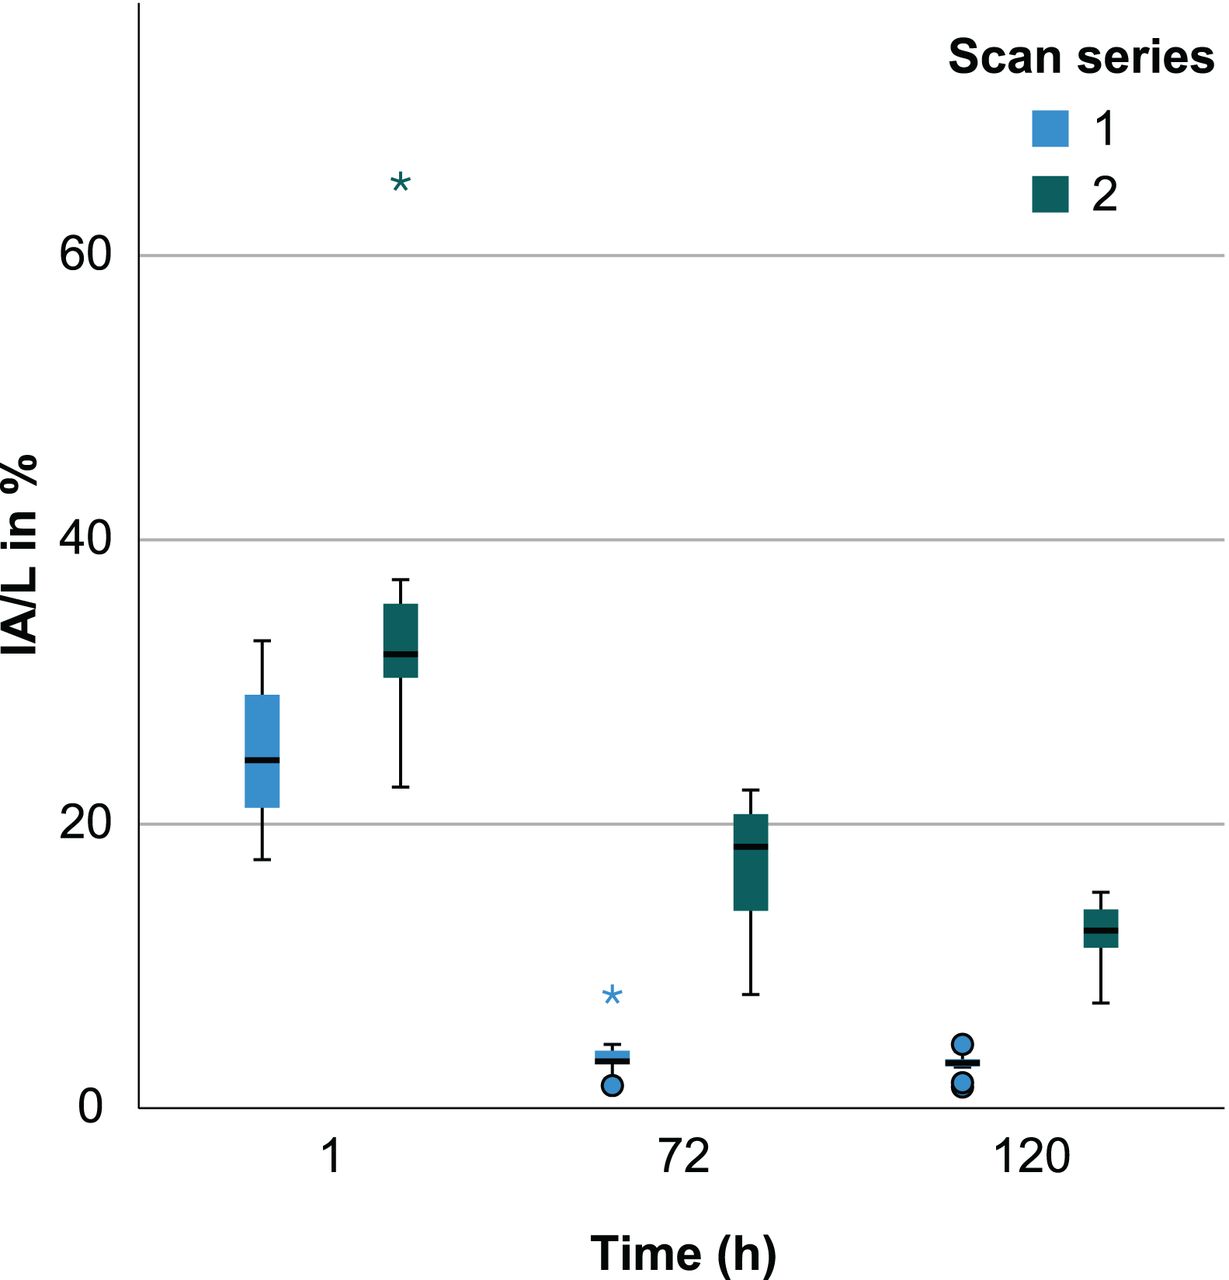
Venous plasma samples at 1, 72, and 120 h after injection of 89Zr-durvalumab in average radioactivity in percentage injected activity per liter. Scan series 1 is without predose of unlabeled durvalumab. Scan series 2 is with 750 mg predose of unlabeled durvalumab. IA = injected activity.
Further, 89Zr-durvalumab uptake in the second scan series was less pronounced in the organs such as spleen, bone marrow and liver (Figs. 2B and 2D).
Safety
The most frequently reported adverse events from the time of injection of the first tracer dose to the second full dose of durvalumab were anemia and pain (Table 2), which were most likely related to previously administered chemotherapy or disease progression. No tracer-related adverse events were recorded.
Tumor Uptake
Visual Analyses
In total, 102 lesions from 13 patients were detected on the baseline 18F-FDG PET/CT scans; 33 of these lesions had a long-axis diameter of at least 20 mm.
Of the 102 lesions, 26 (25%) were visualized on the 89Zr-durvalumab PET/CT scans using the tracer-only imaging acquisition. Of the 33 lesions with a long-axis diameter of at least 20 mm, 10 (30%) were visible.
In the imaging series of the first 3 patients, the tumor-to-background ratio was highest in the PET/CT scan obtained 120 h after injection, and tumor uptake was heterogeneous within and between patients, as shown in Figure 4.
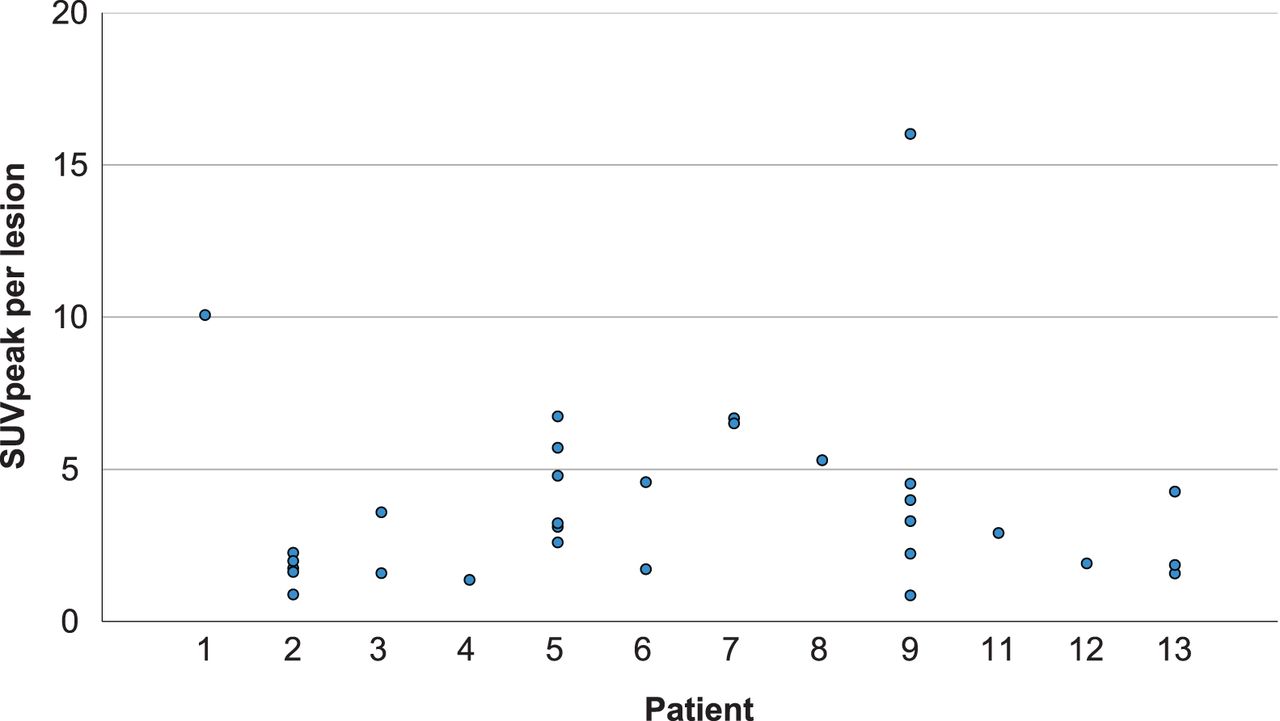
Tracer uptake for all patients per delineated tumor measuring at least 20 mm without predose of durvalumab at 120 h after tracer injection (scan of patient 12 is at 72 h, as 120-h scan was not available).
The 89Zr-durvalumab PET/CT scans that were obtained after the unlabeled therapeutic dose of durvalumab revealed a total of 14 (14%) lesions. Only 3 lesions that appeared on the second imaging series were not visible on the first imaging series. Two of these were small (<20 mm) lesions, whereas 1 was a large lung tumor (62 mm).
In total, 50 lesions with 89Zr-durvalumab uptake (malignant and nonmalignant) were seen at 120 h after injection of the tracer dose–only scan series, whereas 15 89Zr-durvalumab–positive lesions (malignant and nonmalignant) were seen at 120 h after injection in the second scan series (tracer dose after unlabeled therapeutic dose of durvalumab). Of the 50 89Zr-durvalumab–positive lesions, 52% were also 18F-FDG–positive and thus regarded as malignant. The 89Zr-durvalumab–positive and 18F-FDG–negative (nonmalignant) lesions were mostly mediastinal lymph nodes, but axillary, abdominal, and supraclavicular lymph nodes were also seen. Interestingly, most of these did not show stable uptake. At 72 h after injection, 23 89Zr-durvalumab–positive, 18F-FDG–negative (nontumor) lesions were seen. At 120 h, this number was 24. Only 12 of these lesions were seen both on the 72-h and on the 120-h scans.
Quantitative Analyses
The average SUVpeak for all delineated tumor lesions, divided by the average SUVpeak for the aorta, at 72 and 120 h was 4.1/2.2 = 1.8 and 3.9/1.9 = 2.1, respectively.
For subsequent quantitative analyses of tumor uptake, only 18F-FDG–positive lesions at least 20 mm in size from the tracer dose–only acquisition were included and delineated on the PET scan at 120 h after the first tracer injection. The range of tracer uptake within patients with more than 1 lesion varied from an SUVpeak of 0.2 (patient 3, with 2 lesions) to an SUVpeak of 15.2 (patient 9, with 6 lesions). This large range was caused by the presence of a high-uptake lesion that was close to the spleen, with spill-in of splenic tracer activity in the tumor VOI. Without this outlier, the range varied between 0.2 and 4.1, with an average of 2.4. In large tumors, heterogeneous uptake was observed, most often with the highest tracer uptake in the periphery of the tumor. This observation might be due to impaired vascularization in the core of the tumor (due to necrosis), as this impairment was also observed on the 18F-FDG PET. However, the periphery of the tumor showed an uptake pattern on 89Zr-durvalumab PET different from that on 18F-FDG PET (Fig. 5).

(A) 18F-FDG PET of large, malignant lesion in right lung. (B) Same patient as in A, with heterogeneous uptake of 89Zr-durvalumab in large malignant lesion in right lung. (C) 18F-FDG PET uptake in large malignant lesion in left upper lobe. (D) Same patient as in C, with heterogeneous uptake of 89Zr-durvalumab in large malignant lesion in left upper lobe.
Response
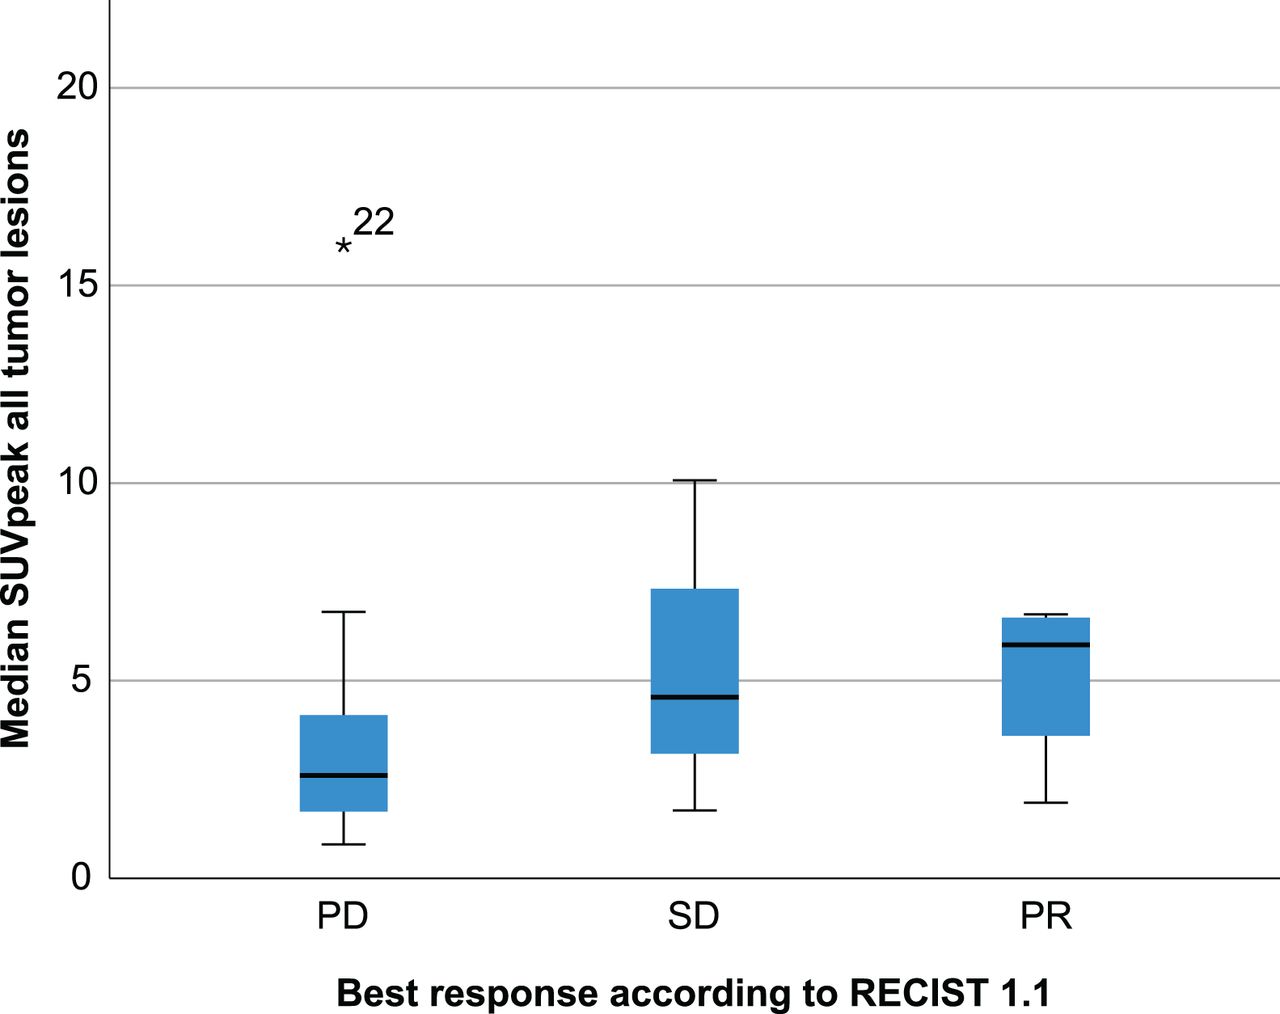
There were 3 patients who had a partial response and 2 with stable disease lasting 3 and 5 months, respectively. The median SUVpeak of tumor lesions in patients without progressive disease at 6 wk was 4.9, compared with 2.4 in patients with progressive disease at 6 wk. The difference was not statistically significant (P = 0.06). The median SUVpeak in patients with progressive disease, stable disease, and partial response was 2.4, 4.6, and 5.9, respectively. These differences, however, were not statistically significant (P = 0.12) either (Fig. 6). Patients with an average SUVpeak higher than the median (SUVpeak, 3.0) had a PFS of 7.3 mo. Those with an SUVpeak lower than the median had a PFS of 5.5 mo (P = 0.46). Patients with an SUVpeak higher than the median had a mean OS of 18.4 mo. Patients with an SUVpeak lower than the median had a mean OS of 5.9 mo. This difference was not statistically significant (P = 0.13). The above-mentioned outlier near the spleen in patient 9 was excluded from all response calculations.

Median 89Zr-durvalumab uptake at 120 h after injection for all tumor lesions (≥20 mm) per best RECIST response category. *22 represents one tumor lesion close to the spleen.
Immunohistochemistry
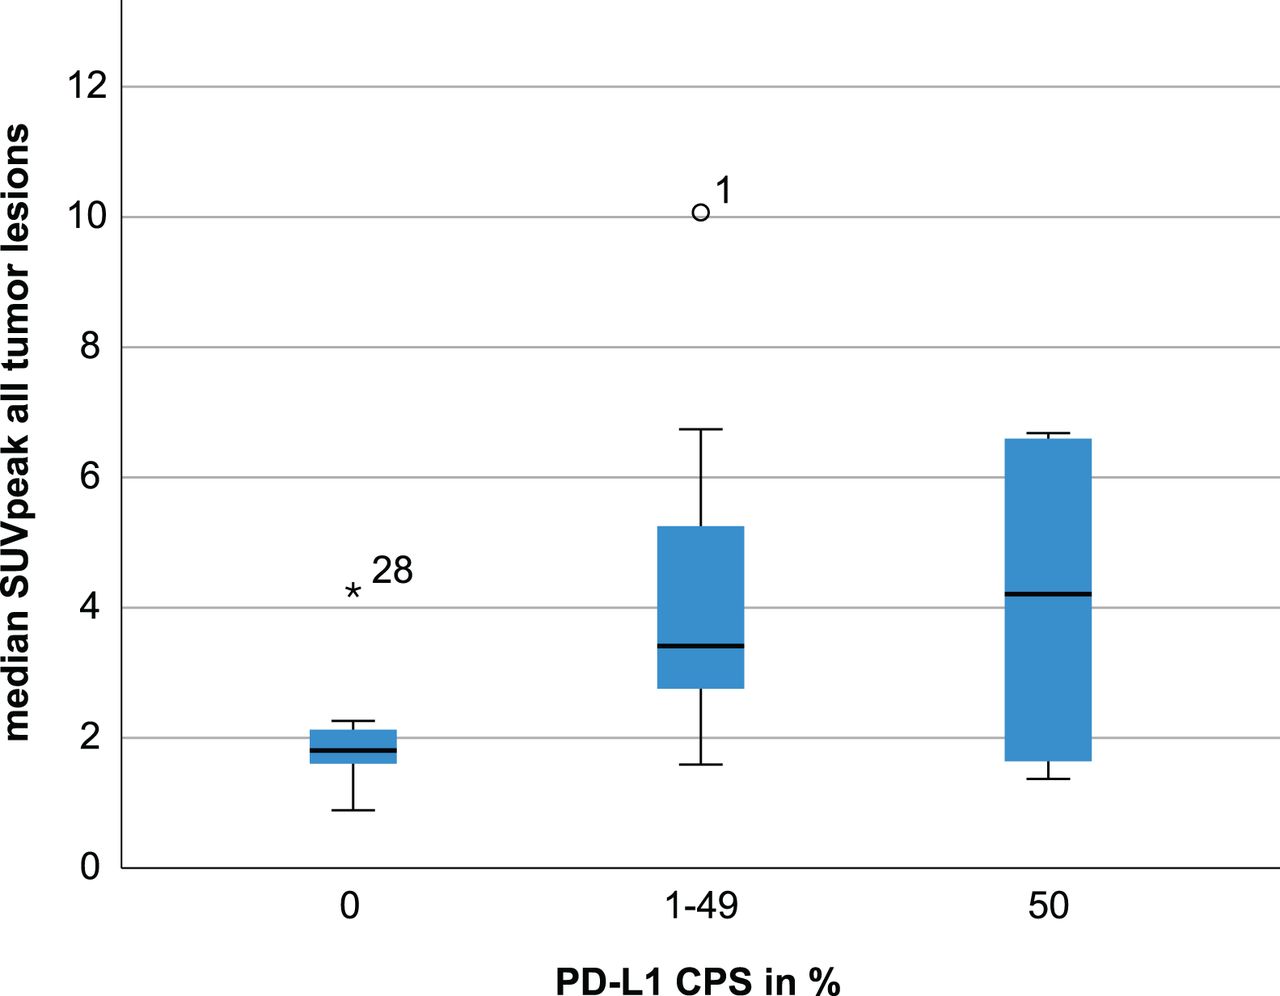
Eleven of 13 patients were evaluable for programmed death 1 and PD-L1 expression on immune and tumor cells. Our cohort contained only biopsies with a PD-L1 TPS of 0%, 1%, and 100% (Supplemental Fig. 2). There was no correlation between PD-L1 TPS and the median 89Zr-durvalumab uptake of all tumor lesions (≥20 mm) per patient (P = 0.93). Although not statistically significant, median 89Zr-durvalumab uptake increased with higher PD-L1 CPS (P = 0.06). Again, in this calculation the outlier near the spleen was excluded (Fig. 7). No significant difference was observed in average 89Zr-durvalumab uptake and programmed death 1 immunohistochemistry (P = 0.10).

Correlation between median 89Zr-durvalumab uptake at 120 h after injection for all tumor lesions (≥20 mm) and PD-L1 CPS. *28 represents one tumor lesion close to the spleen. °1 represents one tumor lesion in the right middle lobe with very high tracer uptake.
DISCUSSION
In this study, we showed that 89Zr-durvalumab is safe and well tolerated, without any reported tracer-related adverse events. The biodistribution of 89Zr-durvalumab was comparable to results observed in previous studies using 89Zr-labeled immune checkpoint inhibitors (12,13). High uptake was seen in the liver (likely due to tracer catabolism) and spleen, where 89Zr-durvalumab binds to PD-L1 receptors on lymphocytes and dendritic cells. As there are PD-L1–positive lymphocytes in the bone marrow, uptake there was slightly higher than in the blood pool. Low uptake was observed in the kidneys, lungs, and brain.
We showed the difference between 2 imaging acquisitions: one without a predose and one with a therapeutic predose of unlabeled durvalumab. The imaging series after the coinjection with unlabeled durvalumab showed a much lower uptake in target tissues (tumor, spleen, and bone marrow) than did the imaging series without a predose, as was likely due to saturation of the available PD-L1 receptors by a therapeutic dose much higher than the tracer dose (750 mg vs. 2 mg). Further, likely because of saturation of the catabolic capacity of the monoclonal antibody durvalumab, the liver also showed lower uptake in the second imaging series. Consequently, fewer tumor lesions were delineable on the PET scans that were made after the coinjection with unlabeled durvalumab.
The use of this unlabeled durvalumab was intended to overcome the so-called sink effect, wherein a substantial amount of the 89Zr-labeled tracer accumulates in nontumor tissues with high specific (e.g., spleen) or nonspecific (e.g., liver) uptake. As a result, insufficient amounts of radiotracer are left in the circulation, available to bind to PD-L1 receptors on tumor cells. We demonstrated, however, that the imaging series without the unlabeled predose identified more tumor lesions than the imaging series with the predose. As a result of coinjection of the tracer with a full dose of unlabeled durvalumab, the latter occupies most PD-L1 receptors in normal tissue and tumor lesions and a larger fraction of the tracer remains present in the blood pool (Fig. 5B). This effect might also explain why a large tumor in the lung was not visualized on the first imaging series but showed higher uptake than the background in the second series. On the basis of contrast-enhanced CT evaluation, this was a well-vascularized tumor, and the tumor PD-L1 immunohistochemistry in this specific patient (patient 6) was 1%. The tumor was visualized in the second series due to the higher amount of tracer in the blood pool compared with the first series. Selection of the optimal tracer strategy for imaging of tumor lesions remains challenging. In this study, we showed adequate uptake in tumor lesions and target tissues using the tracer-only strategy. However, we studied only either a tracer-only dose or a coinjection with a full dose of unlabeled durvalumab, and the optimal imaging strategy might be coinjection of the tracer with a lower unlabeled dose. Further research is needed to explore whether such a strategy is better.
Although tumor lesions could be visualized and quantified, not every patient showed tracer uptake in tumor lesions. Absence of tracer uptake, however, did not rule out a treatment response. For example, the only tumor lesion of patient 12 did not show higher uptake than background, and the availability of tracer was sufficient (Fig. 3) and a partial response was achieved. Tumor uptake within and between patients was heterogeneous. There are numerous causes for this observation, such as a heterogeneous presence of PD-L1–positive malignant cells or a heterogeneous density of these cells in the tumor stroma. Also, immune cells can be more prevalent in one part of the tumor whereas the other part can be an immune desert. PD-L1 expression on these immune cells can also be heterogeneous (6–8). In our data, especially in larger tumor lesions, uptake was more pronounced at the periphery of the tumor. This increased peripheral uptake can be caused by the binding site barrier effect, by which less penetration into the tumor mass occurs as a result of binding of the relatively large monoclonal antibody to receptors in the periphery of tumor lesions. Further, a higher perfusion rate at the edge of the tumor than at the center, or the higher prevalence of immune cells at the periphery of immune-infiltrate–excluded tumor lesions, could explain this observation (27).
Using the 18F-FDG PET/CT obtained at baseline as a reference, we were able to differentiate between malignant and benign lesions that were visualized on the 89Zr-durvalumab PET. To interpret 89Zr-durvalumab PET results in future studies, we would advise use of an 18F-FDG PET scan as a reference. An interesting difference in 89Zr-durvalumab uptake by nonmalignant lesions, mostly lymph nodes, was observed between the scans obtained at 72 and 120 h after injection. Some of these lesions showed higher uptake at 72 h after injection, whereas others showed higher uptake at 120 h after injection. Since these lesions are lymphoid tissue, the change in uptake over time might be related to the immune cells’ assembling in lymph nodes at one point in time and leaving them at the next point in time. Dendritic cells are known to travel from tissue to lymph nodes, and T cells are known to travel the opposite way (28).
Three patients developed an adverse event attributed to durvalumab treatment; predictive signs were not visible on 89Zr-durvalumab PET/CT. Two patients were diagnosed with pneumonitis, and 1 patient experienced sicca symptoms. A higher 89Zr-durvalumab uptake was not observed in the lung tissue of patients who developed pneumonitis during durvalumab treatment than in patients who did not develop pneumonitis. Further, the patient with sicca symptoms did not show uptake in the parotid glands on 89Zr-durvalumab PET/CT.
Previous studies showed a correlation between PFS and a high tumor uptake on immuno-PET. In a clinical study with anti-PD-L1 18F-BMS-986192, uptake expressed as SUVpeak in tumors correlated with PD-L1 expression significantly (12). In the same study, patients were scanned with 89Zr-nivolumab, and tumor uptake was significantly higher in patients whose tumor biopsies showed aggregates of programmed death 1–positive tumor-infiltrating immune cells. Further, uptake of 89Zr-nivolumab and 18F-BMS-986192 was higher in responding lesions than in lesions that were stable or grew. A study of another 89Zr-labeled drug was conducted with the PD-L1 checkpoint inhibitor atezolizumab (13). Comparable results to those with the 89Zr-nivolumab tracer were found: no correlation with PD-L1 expression on tumor cells, but significantly higher 89Zr-atezolizumab uptake in responding patients. In our study, we found no difference in median SUVpeak between the PD-L1 TPS groups (0%, 1%–49%, and ≥50%). However, for PD-L1 CPS (both tumor and immune cell PD-L1 expression), a trend between the PD-L1 CPS groups and SUVpeak was found. Because of the spatial resolution of PET, the SUVpeak comprises tracer binding to PD-L1–positive tumor and immune cells. Therefore, PD-L1 CPS might be a better tissue correlative for PET than is PD-L1 TPS.
In our results, there was no significant correlation between response and SUVpeak, although a trend was seen. Since this study was not powered for treatment outcome, as the sample size was too small, future studies need to evaluate the predictive value of 89Zr-durvalumab for durvalumab treatment outcome. Also, a relatively large number of patients deteriorated quickly. The clinical situation in patients with progressive NSCLC after a first line of chemotherapy often declines rapidly. The study design might also have affected the clinical outcome. Because of the extensive imaging protocol, there was a study-related delay in the start of treatment.
Immuno-PET is a promising step forward in predicting response to checkpoint inhibitors. Identifying the best treatment strategy is of great importance to prevent unnecessary toxicity and costs (29–31). The group of patients who receive PD-L1 checkpoint inhibitors is growing. Recently, adjuvant durvalumab at stage III has been approved (15,16) and neoadjuvant immunotherapy for early-stage NSCLC might soon follow (32–34). However, in a substantial number of these patients, the disease will relapse. A one-size-fits-all strategy feels like a step backward. Immuno-PET tracers such as 89Zr-durvalumab could potentially guide patient selection in the clinical setting and assist in the development of new treatment strategies.
CONCLUSION
This study showed that 89Zr-durvalumab PET/CT imaging is safe and feasible. Tumor lesions could be visualized and quantified, and more tumor lesions could be delineated with only the tracer dose of durvalumab than with the use of an unlabeled therapeutic predose of durvalumab. 89Zr-durvalumab uptake did not correlate with PD-L1 TPS. Nonsignificant correlations were found between clinical outcome during durvalumab treatment and tracer uptake and between PD-L1 CPS and tracer uptake. Further research is needed to investigate the potential role and optimal dose of 89Zr-durvalumab as a biomarker in cancer patients treated with durvalumab.
DISCLOSURE
This work was supported by Astra Zeneca. Astra Zeneca was not involved in design of the study; collection, analysis, or interpretation of the data; or writing of this article. No other potential conflict of interest relevant to this article was reported.
KEY POINTS
QUESTION: Is 89Zr-durvalumab PET/CT a safe and feasible tool to visualize and quantify PD-L1–positive malignant lesions in NSCLC?
PERTINENT FINDINGS: In this single-arm, open-label exploratory pilot study, 13 patients underwent one or more 89Zr-durvalumab PET/CT scans. There were no serious adverse events, and uptake was visualized and quantified in malignant lesions. Uptake showed heterogeneity within and between lesions and better correlated with PD-L1 CPS than with PD-L1 TPS immunohistochemistry, although neither was statistically significant.
IMPLICATIONS FOR PATIENT CARE: Further research is needed to investigate the potential role of 89Zr-durvalumab as a biomarker in cancer patients treated with durvalumab.
Footnotes
Published online Aug. 12, 2021.
- © 2022 by the Society of Nuclear Medicine and Molecular Imaging.
REFERENCES
- Received for publication May 5, 2021.
- Revision received July 22, 2021.
In this issue


Jump to section
Related Articles
Cited By...
- 18F-BMS-986229 PET to Assess Programmed-Death Ligand 1 Status in Gastroesophageal Cancer
- Preclinical development of novel PD-L1 tracers and first-in-human study of [68Ga]Ga-NOTA-RW102 in patients with lung cancers
- First exploration of the on-treatment changes in tumor and organ uptake of a radiolabeled anti PD-L1 antibody during chemoradiotherapy in patients with non-small cell lung cancer using whole body PET
- 89Zr-DFO-Durvalumab PET/CT Before Durvalumab Treatment in Patients with Recurrent or Metastatic Head and Neck Cancer