


Visual Abstract
Abstract
The use of synaptic vesicle glycoprotein 2A radiotracers with PET imaging could provide a way to measure synaptic density quantitatively in living humans. 11C-UCB-J ((R)-1-((3-(11C-methyl-11C)pyridin-4-yl)methyl)-4-(3,4,5-trifluorophenyl)pyrrolidin-2-one), previously developed and assessed in nonhuman primates and humans, showed excellent kinetic properties as a PET radioligand. However, it is labeled with the short half-life isotope 11C. We developed a new tracer, an 18F-labeled difluoro-analog of UCB-J (18F-SynVesT-1, also known as 18F-SDM-8), which displayed favorable properties in monkeys. The purpose of this first-in-human study was to assess the kinetic and binding properties of 18F-SynVesT-1 and compare with 11C-UCB-J. Methods: Eight healthy volunteers participated in a baseline study of 18F-SynVesT-1. Four of these subjects were also scanned after a blocking dose of the antiepileptic drug levetiracetam (20 mg/kg). Metabolite-corrected arterial input functions were measured. Regional time–activity curves were analyzed using 1-tissue-compartment (1TC) and 2-tissue-compartment (2TC) models and multilinear analysis 1 to compute total distribution volume (VT) and binding potential (BPND). The centrum semiovale was used as a reference region. The Lassen plot was applied to compute levetiracetam occupancy and nondisplaceable distribution volume. SUV ratio-1 (SUVR-1) over several time windows was compared with BPND. Results: Regional time–activity curves were fitted better with the 2TC model than the 1TC model, but 2TC VT estimates were unstable. The 1TC VT values matched well with those from the 2TC model (excluding the unstable values). Thus, 1TC was judged as the most useful model for quantitative analysis of 18F-SynVesT-1 imaging data. The minimum scan time for stable VT measurement was 60 min. The rank order of VT and BPND was similar between 18F-SynVesT-1 and 11C-UCB-J. Regional VT was slightly higher for 11C-UCB-J, but BPND was higher for 18F-SynVesT-1, though these differences were not significant. Levetiracetam reduced the uptake of 18F-SynVesT-1 in all regions and produced occupancy of 85.7%. The SUVR-1 of 18F-SynVesT-1 from 60 to 90 min matched best with 1TC BPND. Conclusion: The novel synaptic vesicle glycoprotein 2A tracer, 18F-SynVesT-1, displays excellent kinetic and in vivo binding properties in humans and holds great potential for the imaging and quantification of synaptic density in neuropsychiatric disorders.
Synaptic vesicle glycoprotein 2A (SV2A) is located in the presynaptic vesicle membrane of virtually all synapses (1) and is the target of the anticonvulsant drug levetiracetam (2). We previously developed 11C-UCB-J ((R)-1-((3-(11C-methyl-11C)pyridin-4-yl)methyl)-4-(3,4,5-trifluorophenyl)pyrrolidin-2-one) as a PET radiotracer, tested it in nonhuman primates and humans, and found it to have excellent imaging properties (3–5). SV2A PET could provide a way to measure synaptic density quantitatively in living humans and to track changes in synaptic density with disease. For example, SV2A PET imaging with 11C-UCB-J showed lower hippocampal SV2A specific binding in patients with Alzheimer disease than in cognitively normal subjects (6). In major depressive disorder (7), the severity of depressive symptoms was inversely correlated with SV2A density. Synaptic changes have also been found in Parkinson disease (8) and schizophrenia (9).
11C-UCB-J has excellent test–retest reproducibility to measure distribution volume (VT), with a short scan time (∼60 min) (5). However, it has a half-life of 20 min, which requires the tracer to be produced on-site. An SV2A radiotracer labeled with 18F for PET imaging is attractive for clinical diagnostic applications. We therefore developed 18F-SynVesT-1 ((R)-4-(3-Fluoro-5-(fluoro-18F)phenyl)-1-((3-methylpyridin-4-yl)methyl)pyrrolidin-2-one, the difluoro-analog of UCB-J) and demonstrated its suitability for imaging SV2A in rhesus monkeys. 18F-SynVesT-1 has the same favorable properties as 11C-UCB-J: high brain uptake and good specific binding signals (10). The previous identifier for this tracer was 18F-SDM-8, as it was part of a series of 18F-labeled UCB-J analogs developed as synaptic density markers (10). This tracer has also been studied elsewhere with the identifier 18F-MNI-1126 (11). The new name, 18F-SynVesT-1, was since agreed upon between the groups to eliminate future confusion in the field from use of 2 different names for the same radioligand.
In this study, we evaluated 18F-SynVesT-1 in healthy human volunteers and determined a suitable kinetic model for quantitative analysis of 18F-SynVesT-1 imaging data. A subgroup of volunteers also participated in a baseline and blocking study with levetiracetam using both 18F-SynVesT-1 and 11C-UCB-J for comparison.
MATERIALS AND METHODS
Human Subjects
Four healthy volunteers (4 men; 44 ± 13 y old; body mass index, 30 ± 2) completed a baseline study with 18F-SynVesT-1. A second group of healthy volunteers (2 men and 2 women; 38 ± 15 y old; body mass index, 27 ± 4) were enrolled in a baseline-blocking study of 18F-SynVesT-1 and 11C-UCB-J using levetiracetam as the blocking drug. All subjects were screened with a physical exam, medical history, routine laboratory studies, pregnancy tests (for women), and electrocardiography to assess for eligibility. The institutional review board–approved study was also approved by the Yale–New Haven Hospital Radiation Safety Committee and was performed in accordance with federal guidelines and regulations of the United States for the protection of human research subjects contained in title 45, part 46, of the Code of Federal Regulations. All subjects gave written informed consent.
Brain PET Studies
PET Imaging
PET images were acquired using the High Resolution Research Tomograph (Siemens Medical Systems), which acquired 207 slices (1.2-mm slice separation) in list mode for 120 min for 18F-SynVesT-1 and 90 min for 11C-UCB-J. A 6-min transmission scan was conducted for attenuation correction. Dynamic scan data were reconstructed in 27 frames (6 × 30 s, 3 × 1 min, 2 × 2 min, and 16 × 5 min) for 11C-UCB-J, with 6 additional 5-min frames for 18F-SynVesT-1, with corrections for attenuation, normalization, scatter, randoms, and dead time using the motion-compensation ordered-subsets expectation maximization list-mode algorithm for resolution-recovery reconstruction (12). Event-by-event motion correction (13) based on measurements with the Polaris Vicra sensor (NDI Systems) was included in the reconstruction. Subjects were administered 18F-SynVesT-1 as an intravenous injection over 1 min by an automatic pump (PHD 22/2000; Harvard Apparatus). 11C-UCB-J was administered as a bolus for 2 subjects and as a bolus plus infusion for the other 2 subjects. The blocking scan was conducted 3 h after intravenous administration of levetiracetam (18F-SynVesT-1, 20 mg/kg; 11C-UCB-J, 10 mg/kg [n = 3] and 20 mg/kg [n = 1]).
MRI
Each subject underwent MRI for PET image registration. The MRI sequence was a 3-dimensional magnetization-prepared rapid acquisition with a gradient-echo pulse, using an echo time of 2.78 ms, a repetition time of 2,500 ms, an inversion time of 1,100 ms, and a flip angle of 7° on a 3-T whole-body scanner (Trio; Siemens Medical Systems) with a circularly polarized head coil.
Arterial Input Function Measurement
Discrete blood samples were manually drawn every 10 s from 10 to 90 s; every 15 s from 90 s to 3 min; and then at 3.5, 5, 6.5, 8, 12, 15, 20, 25, 30, 45, 60, 75, and 90 min for both tracers, with 2 additional samples taken at 105 and 120 min for 18F-SynVesT-1. Samples were centrifuged to obtain plasma and then counted with a calibrated well counter.
Radiotracer metabolism was analyzed using plasma samples collected at 3, 8, 15, 30, 60, and 90 min after injection for both tracers, with an additional sample at 120 min for 18F-SynVesT-1. Metabolites were analyzed using the column-switching high-performance liquid chromatography method (14) to determine the parent fraction, as previously described (10). An ultrafiltration-based method (Centrifree; Millipore) was used to measure the plasma free fraction (10).
Image Registration and Regions of Interest
PET images were corrected for motion by frame-by-frame registration to a summed image (0–10 min after injection) using a 6-parameter mutual information algorithm (FLIRT; FSL). The summed PET image was then coregistered to the subject’s T1-weighted MR image (6-parameter affine registration), which was subsequently coregistered to the automated anatomic labeling template (15) in Montreal Neurologic Institute (16) space using a nonlinear transformation (BioImage Suite) (17). Using the combined transformations from template-to-PET space, regional tissue time–activity curves were generated in the following regions: amygdala, anterior cingulate cortex, caudate nucleus, cerebellum, frontal cortex, globus pallidus, hippocampus, insular cortex, occipital cortex, parietal cortex, posterior cingulate cortex, putamen, temporal cortex, and thalamus. The region of interest for the centrum semiovale (CS) was designed to minimize the partial-volume effect (18).
Quantitative Analysis
For 18F-SynVesT-1, regional total distribution volume (VT) was computed from the time–activity curves using 1-tissue-compartment (1TC) and 2-tissue-compartment (2TC) models. The relative fit quality of 1TC and 2TC models was compared with the F test. Percentage SE (%SE) was estimated from the theoretic parameter covariance matrix. Multilinear analysis 1 (MA1) (19) was also applied to estimate VT by changing the starting time t* (from 10 to 60 min with 10-min increments). The choice of best kinetic model for 18F-SynVesT-1 was based on analysis of data from the 8 baseline scans.
For comparison of parametric images to 11C-UCB-J, which used the 1TC model (5), parametric VT images for 18F-SynVesT-1 were also generated with the 1TC model using a basis function method, with k2 limited to the range of 0.01–1.0 min−1 and without postsmoothing. All modeling was performed with in-house programs using IDL, version 8.0 (ITT Visual Information Solutions).
The minimal scan duration for VT quantification was evaluated by considering shorter datasets (30–120 min in 10-min increments, n = 8) using the selected kinetic model. The percentage differences in VT derived using data from the shorter intervals and 120 min were calculated. The choice of minimum scan time was based on criteria defined previously (20).
The CS region was used as a reference region to compute regional binding potential (BPND) from VT. The Lassen plot was used to determine target occupancy by levetiracetam and the nondisplaceable distribution volume (VND) (21). The VND from gray matter regions was compared with baseline VT in CS to test the suitability of CS as a reference region.
In addition, a simplified outcome measure, the SUV ratio (SUVR), was evaluated in comparison to BPND. Static SUVR-1, which would equal BPND at equilibrium, was computed for 9 time windows of 30-min duration (10–40, 20–50, 30–60, 40–70, 50–80, 60–90, 70–100, 80–110, and 90–120 min) and compared with BPND, calculated from regional VT ratio (target/reference) − 1. All outcome measures were computed from regional time–activity curve analysis of baseline scans.
RESULTS
Human Injection and Scan Parameters
The mean administered dose of 18F-SynVesT-1 had an activity of 180 ± 7 MBq (range, 167–186 MBq) and 180 ± 4 MBq (range, 175–185 MBq) for the baseline (n = 8) and blocking (n = 4) scans, respectively. Injection and scan parameters are listed in Table 1.
Subject Information and PET Scan Parameters
Safety
No significant clinical changes were observed with the administration of 18F-SynVesT-1 in an injected-mass dose of up to 0.55 μg.
Plasma Analysis
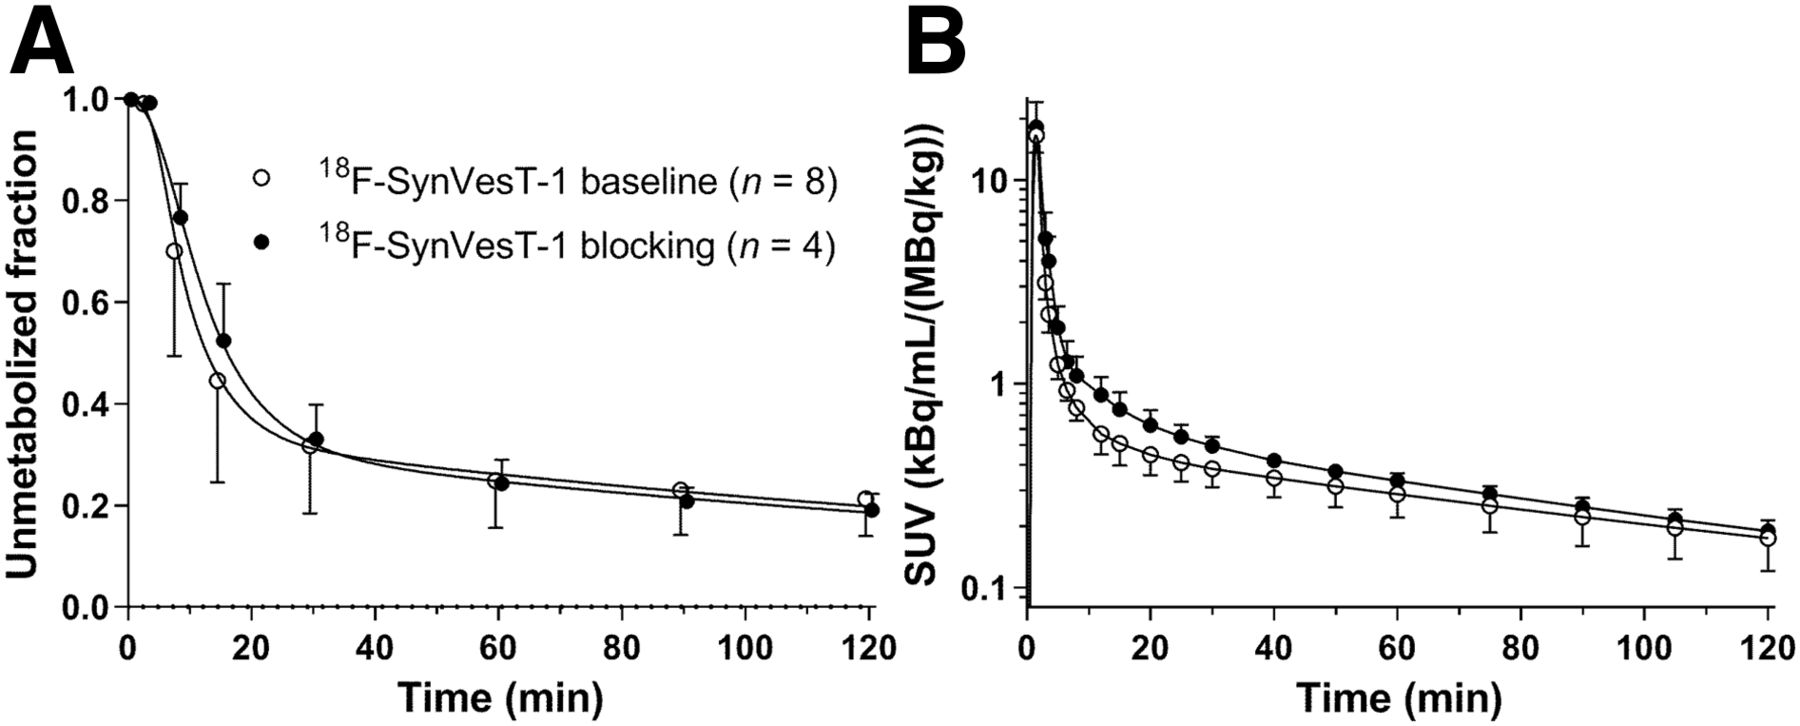
Data from plasma analysis are displayed in Figure 1. At 60 min after radiotracer injection, the fraction of radioactivity corresponding to the parent compound was 26% ± 9% (n = 8, baseline) and 26% ± 9% (n = 4, blocking) for 18F-SynVesT-1 and 23% ± 8% (n = 2, baseline) and 23% ± 10% (n = 2, blocking) for 11C-UCB-J. The plasma free fraction was 0.31 ± 0.01 (n = 8, baseline) and 0.30 ± 0.02 (n = 4, blocking) for 18F-SynVesT-1 and 0.27 ± 0.02 (n = 4, baseline) and 0.28 ± 0.02 (n = 4, blocking) for 11C-UCB-J. The parent fraction at 60 min and free fraction in plasma did not significantly differ between baseline and blocking conditions with 18F-SynVesT-1.

Mean ± SD of plasma parent fraction (A) and metabolite-corrected plasma activity (B) in baseline studies and levetiracetam blocking studies with 18F-SynVesT-1.
Brain Distribution and Kinetics
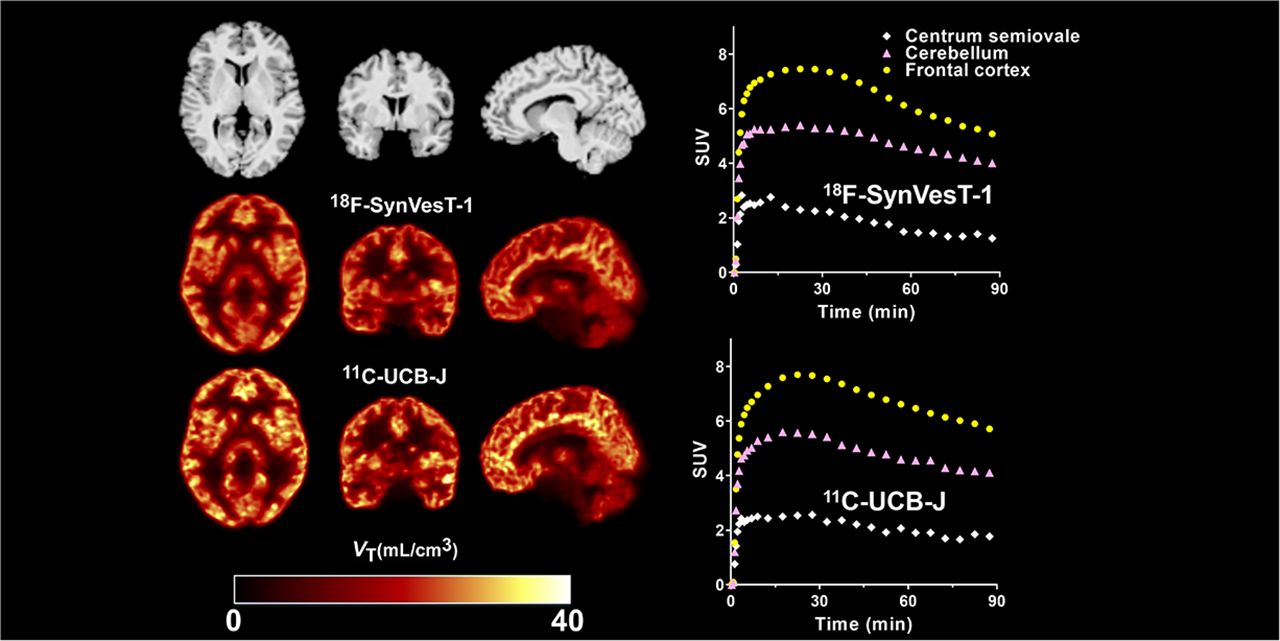
Typical time–activity curves and their fitting are shown in Figure 2. High uptake was seen in gray matter regions and low uptake in white matter regions. The order of regional uptake levels was similar between 18F-SynVesT-1 and 11C-UCB-J. SUV in brain regions peaked at 5–20 min and 10–25 min after injection for 18F-SynVesT-1 and 11C-UCB-J, respectively.

Time–activity curves and fittings with 1TC (dotted curve) and 2TC (solid curve) models in same subject under baseline conditions (A and B) and levetiracetam blocking conditions (C and D) with 18F-SynVesT-1, and under same baseline conditions (E and F) and blocking conditions (G and H) with 11C-UCB-J. 2TC model was not applied to 11C-UCB-J.
The 2TC model was favored over the 1TC model by the F test (66% of fits), and the differences were found predominantly in the cerebellum, hippocampus, and neocortical regions. In particular, a moderate lack of fit was seen in the cerebellum with the 1TC model. Although the 2TC fits were excellent, kinetic parameters were not reliably estimated (%SE > 100% in 32% of the fits for k3 and 77% of the fits for k4), leading to poor estimation of 2TC VT in 60% of fits (%SE > 10%). In stable VT cases (%SE < 10%), the estimated k4 was not small (∼0.02). But, in unstable VT cases (%SE > 100%), the estimated k4 was very small (<10−9). The ratio of k3/k4 was also unstable (%SE > 1,000%). Excluding the unreliable 2TC VT estimates, 1TC VT values matched exceptionally with those from 2TC (1TC VT = 1.01 × 2TC VT – 0.32, R2 = 1.00). The MA1 method was also tested with a range of t* settings. If t* has a very small effect on VT, then the 1TC model is appropriate. The results showed that MA1 VT values derived with different t* settings did not differ from those estimated by 1TC: the percentage differences ranged from 0.2% ± 0.3% (t* = 10 min) to 2.7% ± 0.8% (t* = 60 min). The largest difference was seen in the cerebellum and hippocampus with a t* of 60 min (4%–5%). Given the insensitivity of VT estimates to t* settings in MA1, the quality of fitting by 1TC, and the excellent match with reliable 2TC VT, the 1TC model was judged as most appropriate for analysis of 18F-SynVesT-1 imaging data.
The mean 1TC-estimated VT (mL/cm3) for 18F-SynVesT-1 ranged from 3.5 ± 0.4 in the CS to 19.3 ± 2.8 in the putamen (Table 2), whereas K1 estimates (mL/min/cm3) ranged from 0.112 ± 0.011 (CS) to 0.377 ± 0.040 (putamen). These K1 values were similar to those of 11C-UCB-J (range, 0.113 ± 0.010 to 0.367 ± 0.047), with a relative difference of 4% ± 8%. The 1TC k2 estimates (1/min) ranged from 0.014 ± 0.001 (amygdala) to 0.032 ± 0.003 (CS) for 18F-SynVesT-1.
In Vivo Binding Parameters of 18F-SynVesT-1 and Minimum Scan Time for Stable Measurement, Derived with 1TC Model
Voxel-based parametric images were computed with 120 and 90 min of scan data for, respectively, 18F-SynVesT-1 and 11C-UCB-J (Fig. 3). For 18F-SynVesT-1, effectively identical VT values were obtained with both parametric imaging and time–activity curve fitting: VT (voxel) = 1.01 × VT (time–activity curve) + 0.02, R2 = 1.00.

MR and coregistered parametric VT images of 18F-SynVesT-1 (120-min PET data) and 11C-UCB-J (90-min PET data) in same subject, calculated with 1TC model and basis function method.
A minimum scan duration of 60 min was required to satisfy the stability criteria for VT estimates in all brain regions in 1TC time–activity curve analysis. For specific regions, 60 min was required for the hippocampus and cerebellum, 40 min for the anterior cingulate cortex, and 30 min for other regions (Table 2).
Figure 4 shows examples of Lassen plots using VT measured with 18F-SynVesT-1 and 11C-UCB-J in the baseline blocking study with levetiracetam (Table 3). The occupancy by a 20 mg/kg dose of levetiracetam was 85.3% ± 4.7% as measured by 18F-SynVesT-1 and 82.5% as measured by 11C-UCB-J, whereas occupancy produced by the 10 mg/kg dose was 76.4% ± 5.6% as measured by 11C-UCB-J. The VND, determined as the x-intercepts from the Lassen plots, was 2.38 ± 0.33 mL/cm3 for 18F-SynVesT-1 and 3.13 ± 0.40 mL/cm3 for 11C-UCB-J. The gray matter VND was lower than the baseline CS VT by 32% ± 16% for 18F-SynVesT-1 and 29% ± 13% for 11C-UCB-J; these offsets did not significantly differ between the tracers (P = 0.83). If VND in CS equals that in gray matter, these data indicate that the BPND for CS is 0.47 and 0.41 for 18F-SynVesT-1 and 11C-UCB-J, respectively. However, we previously showed that VND is greater in CS than in gray matter (18).
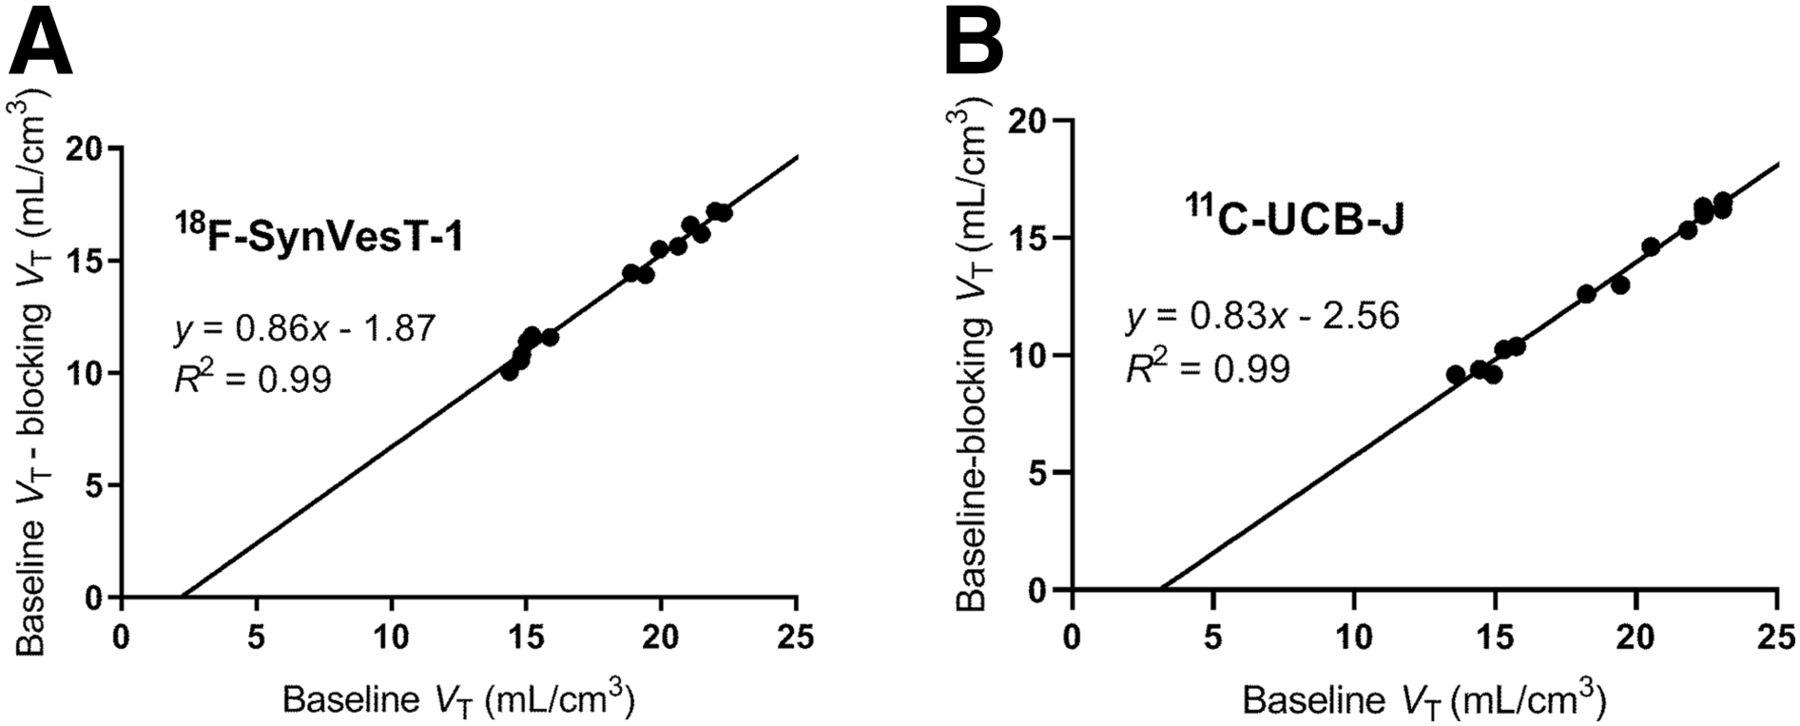
Occupancy plots for blocking scans with levetiracetam, 20 mg/kg, measured with 18F-SynVesT-1 (A) and 11C-UCB-J (B) in same subject. Estimated SV2A occupancy values were 86% in A and 83% in B.
Total Distribution Volumes Derived with 1TC Model for 18F-SynVesT-1 and 11C-UCB-J Under Baseline and Levetiracetam Blocking Conditions
Regional BPND was compared between the 2 tracers using either baseline CS VT or Lassen plot VND as reference values (Supplemental Table 1; supplemental materials are available at http://jnm.snmjournals.org). By either reference method, 18F-SynVesT-1 had higher BPND than 11C-UCB-J, but the difference was not statistically significant.
Using the CS as a reference region for calculation of BPND from regional VT, the mean 1TC BPND ranged from 2.5 ± 0.5 in the globus pallidus to 4.5 ± 0.5 in the putamen for 18F-SynVesT-1 (Table 2). These values were then compared with SUVRs using different 30-min windows. Percentage differences between SUVR-1 and BPND are shown in Figure 5. The smallest percentage difference was seen when the window for SUVR-1 calculation was 60–90 min. The regression line was as follows: SUVR-1 (60–90 min) = 0.95 × BPND + 0.15 (R2 = 0.97).

Mean and SD of percentage differences between SUVR-1 from different time windows (30-min duration) and 1TC BPND. Each data point was plotted at beginning of each window for SUVR-1 computation.
DISCUSSION
This first-in-human study of the SV2A PET tracer 18F-SynVesT-1 included baseline PET scans to evaluate methods for kinetic analysis of imaging data, levetiracetam occupancy scans to assess nonspecific binding, and comparison with the established tracer 11C-UCB-J.
In choosing the best kinetic analysis method, we compared the 1TC and 2TC models. The 2TC model was preferred for analysis of 18F-SynVesT-1 imaging data based on the F test in 66% of fits. However, k3 and k4 were poorly estimated by the 2TC model, resulting in unreliable VT estimation. When such unreliable estimates were excluded, the 1TC and 2TC models provided almost an identical VT. Judged from visual inspection of the curve fitting, the 2TC model fitted better in the cerebellum than did the 1TC model, but the fitting results were similar in other regions. Similar results were reported for 11C-UCB-J (5); that is, the 2TC model was favored in 73% of fits, and a small lack of fit was seen in the cerebellum and hippocampus.
We then assessed the MA1 method with different t* settings. For tracers that require the use of the 2TC model (i.e., tracers for which 1TC-derived VT values differ from those by 2TC), MA1-derived VT values with early and late t* settings will be similar to those from the 1TC and 2TC models, respectively. In our study, however, the change in MA1 VT over different t* settings was small in all regions, with the largest change being in the cerebellum (4.6%). This observation supports the result that the 1TC and 2TC models provide similar VT estimates. Given the quality of curve fitting, the small difference in VT estimated by the 1TC and 2TC models, and the unreliable VT estimation by 2TC, we chose the 1TC model as best for analysis of 18F-SynVesT-1 imaging data.
Regional VT values derived from parametric images matched well with those from time–activity curve analysis. Because the statistical quality of VT images was similarly high for 18F-SynVesT-1 and 11C-UCB-J, no spatial smoothing was required for either tracer. For centers with the ability to produce 11C tracer, ultimately it will be of interest to assess which tracer provides the best image quality with matched radiation dose.
The CS has been proposed as a suitable reference region because of its negligible SV2A level in the baboon brain, as observed by Western blot analysis (4). Since CS has been used as a reference region to quantify 11C-UCB-J specific binding (6,22), we also evaluated the use of CS as a reference region to compute the BPND and SUVR of 18F-SynVesT-1. Rossano et al. (18) investigated the CS reference region for 11C-UCB-J quantification and optimized the location and size of the region of interest, which were adopted in the current study. As observed previously with 11C-UCB-J, a decrease in 18F-SynVesT-1 VT was seen in the CS after SV2A blockade with levetiracetam. For both tracers, the VND determined from the occupancy plot was about 30% lower than the CS VT. Thus, use of the CS as a reference region might lead to underestimation of BPND and SUVR. Nonetheless, the CS may still serve as a useful reference region if there is a consistent relationship between CS VT and VND, as was shown for 11C-UCB-J (18).
Overall, mean VT was slightly higher for 11C-UCB-J than for 18F-SynVesT-1 across all brain regions, including the CS (Table 3). When the CS was used as a reference region, 18F-SynVesT-1 gave a higher BPND than did 11C-UCB-J, with the ratio of BPND (11C-UCB-J)/BPND (18F-SynVesT-1) being 0.84 ± 0.16 (Supplemental Table 1). When the VND derived from the Lassen occupancy plots was used, a similar BPND ratio of 0.79 ± 0.36 was obtained. That is, the mean BPND of 18F-SynVesT-1 was about 20% higher than that of 11C-UCB-J. Note, however, that with the small size of this study (n = 4), these differences were not statistically significant. The lower logD of 18F-SynVesT-1 (2.32 vs. 2.53 for 11C-UCB-J) contributes to a higher free fraction of ligand in the nondisplaceable tissue compartment (fND) (0.130 vs. 0.086 for 11C-UCB-J) and a lower VND (2.38 vs. 3.13 for 11C-UCB-J). However, the relative values of BPND (=fNDBmax/KD) also depend on the in vivo KD. The average in vitro Ki was 3.3 nM for SynVesT-1 and 2.7 nM for UCB-J, taken from 2 sets of measurements published previously (Ki of 2.2 and 4.7 nM, respectively, for SynVesT-1 and 1.5 and 3.0 nM, respectively, for UCB-J) (23) and 1 set of our own measurements (Ki of 3.1 nM for SynVesT-1 and 3.7 nM for UCB-J; unpublished data, December 2019) using 3H-UCB-J and human cortex homogenates. Using these in vitro Ki averages as surrogates for in vivo KD, we found that [fND/KD] (11C-UCB-J)/[fND/KD] (18F-SynVesT-1) = 0.81, which matches well with the 0.79 found in the present study for BPND (11C-UCB-J)/BPND (18F-SynVesT-1).
Another way to compare specific binding between tracers is to use the graphical method of Guo et al. (Guo plot) (24), where the sign of the y-intercept predicts which tracer has a higher specific binding signal. However, when the Guo plot was applied to compare 18F-SynVesT-1 and 11C-UCB-J, the y-intercept could not be reliably estimated because all the data points were far from the origin.
Of the 4 subjects with both 11C-UCB-J and 18F-SynVesT-1 scans, 2 had their 11C-UCB-J scans conducted under a bolus-plus-infusion protocol, and the other 2 received a bolus injection of the radiotracer. This difference in tracer administration methods should not affect the results, since the outcome measure, VT, was based on kinetic analysis, which accounts for the difference in input function. Although the number of subjects with 11C-UCB-J scans was limited in this study, their regional VT values were close to those in the literature (5,18). For comparison of regional time–activity curves, input functions, and parent fraction curves between tracers, we used the data from the subjects receiving bolus injections of the radiotracers.
To simplify the imaging and analysis protocol for 18F-SynVesT-1, shorter scan times and simplified quantification method are desirable. By comparing VT values from different scan lengths to those derived from the 120-min scan data, we found that a scan time of 60 min was sufficient to provide stable VT estimates for 18F-SynVesT-1. For quantification without arterial sampling, we assessed the possibility of using SUVR-1 as a surrogate for BPND. The SUVR-1 underestimated BPND at early time windows, and the difference between SUVR-1 and BPND monotonically increased by shifting the time window. The best match was seen when the time window for SUVR-1 calculation was 60–90 min. Thus, SUVR-1 calculated from 60 to 90 min after injection of 18F-SynVesT-1 can be used as an appropriate substitute for BPND as a measure of specific binding signal, thus simplifying the imaging and quantification protocols for this SV2A radiotracer. Note, this result was obtained in healthy control baseline scans and could be affected by disease or drug administration. Indeed, SUVR-1 from 60 to 90 min was about 20% lower than BPND in the levetiracetam blocking scans.
CONCLUSION
This study showed that 18F-SynVesT-1 is an excellent PET tracer for SV2A. 18F-SynVesT-1 exhibited properties as good as those of the existing radiotracer 11C-UCB-J: high brain uptake, fast and reversible kinetics, and high specific binding. The 1TC model was chosen as best for quantitative kinetic analysis of 18F-SynVesT-1 imaging data. Regional BPND levels of 18F-SynVesT-1 were higher than those of 11C-UCB-J. SUVR-1 from 60 to 90 min after injection provided an excellent match with the 1TC BPND of 18F-SynVesT-1 and thus can serve as a surrogate quantitative measurement of specific binding in a short scan time without invasive arterial sampling. The longer half-life of this tracer will facilitate its broad application in studies of synaptic density in many neurodegenerative and neuropsychiatric populations.
DISCLOSURE
This publication was made possible by CTSA grant UL1 RR024139 jointly from the National Center for Research Resources (NCRR) and the National Center for Advancing Translational Sciences (NCATS), components of the National Institutes of Health (NIH). The contents of this article are solely the responsibility of the authors and do not necessarily represent the official view of NIH. Financial support was received from R01AG052560, the Michael J. Fox Foundation, and R01AG065474. The radioligand 18F-SynVesT-1 (formerly referred to as 18F-SDM-8) is the subject of international patent application PCT/US2018/018388, “Radiolabeled Pharmaceuticals and Methods of Making and Using Same,” filed on February 15, 2018 (inventors: Yiyun Huang, Zhengxin Cai, Songye Li, Nabeel Nabulsi, and Richard E. Carson). No other potential conflict of interest relevant to this article was reported.
KEY POINTS
QUESTION: Does 18F-SynVesT-1 show kinetic properties suitable for quantifying SV2A density in humans, in comparison with the existing SV2A tracer, 11C-UCB-J?
PERTINENT FINDINGS: 18F-SynVesT-1 showed excellent in vivo properties, with high brain uptake, reversible kinetics, and high specific binding, similar to 11C-UCB-J.
IMPLICATIONS FOR PATIENT CARE: This longer-half-life tracer will be more useful for clinical studies in terms of allowing off-site production and distribution.
Acknowledgments
We appreciate the excellent technical assistance of the staff at the Yale University PET Center.
Footnotes
- © 2021 by the Society of Nuclear Medicine and Molecular Imaging.
REFERENCES
- Received for publication May 8, 2020.
- Accepted for publication July 29, 2020.


Jump to section
Related Articles
Cited By...
- Imaging Synaptic Density in Aging and Alzheimer Disease with [18F]SynVesT-1
- Quantitative Accuracy Assessment of the NeuroEXPLORER for Diverse Imaging Applications: Moving Beyond Standard Evaluations
- Imaging synaptic density in ageing and Alzheimers Disease with [18F]-SynVesT-1
- An In Vivo High-Resolution Human Brain Atlas of Synaptic Density
- First-in-Human Study of 18F-SynVesT-2: An SV2A PET Imaging Probe with Fast Brain Kinetics and High Specific Binding
- Lower synaptic density associated with gaming disorder: an 18F-SynVesT-1 PET imaging study
- Reduced SV2A and GABAA receptor levels in the brains of type 2 diabetic rats revealed by [18F]SDM-8 and [18F]flumazenil PET
- Uncovering the link between synaptic density and mental illness through in vivo imaging
- Imaging of Synaptic Density in Neurodegenerative Disorders
- A metabolically stable PET tracer for imaging synaptic vesicle protein 2A: Synthesis and preclinical characterization of [18F]SDM-16