


Abstract
Quantitative analysis has been applied extensively to image processing and interpretation in nuclear cardiology to improve disease diagnosis and risk stratification. This is Part 2 of a two-part continuing medical education article, which will review the potential clinical role for emerging quantitative analysis tools. The article will describe advanced methods for quantifying dyssynchrony, ventricular function and perfusion, and hybrid imaging analysis. This article discusses evolving methods to measure myocardial blood flow with positron emission tomography and single-photon emission computed tomography. Novel quantitative assessments of myocardial viability, microcalcification and in patients with cardiac sarcoidosis and cardiac amyloidosis will also be described. Lastly, we will review the potential role for artificial intelligence to improve image analysis, disease diagnosis, and risk prediction. The potential clinical role for all these novel techniques will be highlighted as well as methods to optimize their implementation. (J Nucl Cardiol 2020)
INTRODUCTION
Nuclear cardiology, including single-photon emission computed tomography (SPECT) and positron emission tomography (PET), have been a key non-invasive imaging modality for patients with known or suspected cardiovascular disease. Quantitative analysis has been applied extensively to image processing and interpretation in nuclear cardiology. This article provides an update on the current state of quantitative nuclear cardiology and is Part 2 of a two-part continuing medical education article. In Part 1, we discussed clinically established quantitative tools and how to best incorporate them into clinical practice.1,2 In Part 2, we will review the potential clinical role for emerging and evolving quantitative analysis tools. The emerging and evolving tools described in this article do not yet have as clearly established clinical roles as the tools described in Part 1, and thus our rationale for dividing the articles into two parts. The article will review advanced methods for quantifying ventricular perfusion and function, including myocardial perfusion imaging (MPI), phase analysis, right ventricular analysis, motion correction and hybrid imaging analysis. This article also will discuss evolving methods to measure absolute myocardial blood flow (MBF), including the mounting evidence for SPECT MBF quantitation. Novel imaging methods to quantify microcalcification will also be reviewed. This article will not only focus on recent advances in CAD but will discuss quantitative analysis in patients with cardiac sarcoidosis (CS) and cardiac amyloidosis (CA). Lastly, we will review the potential role for artificial intelligence (AI)-based methods to improve image analysis, disease diagnosis, and risk prediction. The potential clinical role for these techniques will be highlighted as well as methods to optimize implementation.
QUANTITATION OF REGIONAL VENTRICULAR PERFUSION
Quantitation of Change in Ventricular Perfusion
Quantitative analysis of regional myocardial perfusion has been well-established as a method to evaluate perfusion which can complement visual interpretation. Quantitative assessment of perfusion has similar diagnostic accuracy as expert visual interpretation, but with lower interobserver variability.3 Quantitation of myocardial perfusion provides more precise risk stratification, even for cases with normal perfusion by visual interpretation.4 Automatic quantification of myocardial perfusion is typically performed by comparison to a normal limit database and is more fully detailed in Part 1. However, it can also be performed by comparing two sets of images from a single patient to identify subtle changes in ventricular perfusion, termed ‘‘change analysis’’. One such method for comparing rest-stress images was assessed in 204 patients undergoing dual-isotope SPECT MPI.5 Ischemia, quantified as the ratio of the total stress perfusion deficit to the total rest LV counts, had higher diagnostic accuracy for obstructive CAD compared to quantitation using a normal limits database (area under the receiver operating characteristic curve 0.88 vs 0.82).5 Quantification of myocardial ischemia may identify patients who derive a major adverse cardiovascular event benefit from early revascularization,6 and change analysis may provide more accurate estimation of ischemic burden. A patient example is shown in Figure 1.

Patient example outlining the potential utility of change analysis. Stress and rest SPECT MPI images from a 49-year-old woman. Quantitative analysis with total perfusion deficit (TPD), which relies on comparison to a normal limit database, demonstrated minimal stress defect (stress TPD 2%, rest TPD 0%). However, stress-rest change analysis, using the patients rest imaging as the reference, demonstrated 10% left ventricular myocardial ischemia. The patient had 80% left anterior descending stenosis at invasive coronary angiography. This research was originally published in JNM. Prasad et al ©SNMMI77.
A review of motion-corrected quantification of relative myocardial perfusion and myocardial blood flow are available in the supplement.
Fusion of Imaging Modalities: Hybrid SPECT/CT Analysis
The number of patients undergoing coronary computed tomography angiography (CCTA) for known or suspected CAD is increasing. The information obtained with CCTA can be combined with SPECT or PET MPI to improve diagnostic accuracy. One such technique extracts three-dimensional coronary vessels from CCTA and fuses them with quantitative SPECT MPI results mapped on the LV surface.7 The co-registered images were used to correct MPI contours and adjust vascular regions with a 96% success rate,7 and improved detection of significant CAD compared to standard image interpretation.7 Yoneyama et al demonstrated similar improvements in the diagnostic accuracy for right coronary artery defects using hybrid images generated with a different software system.8
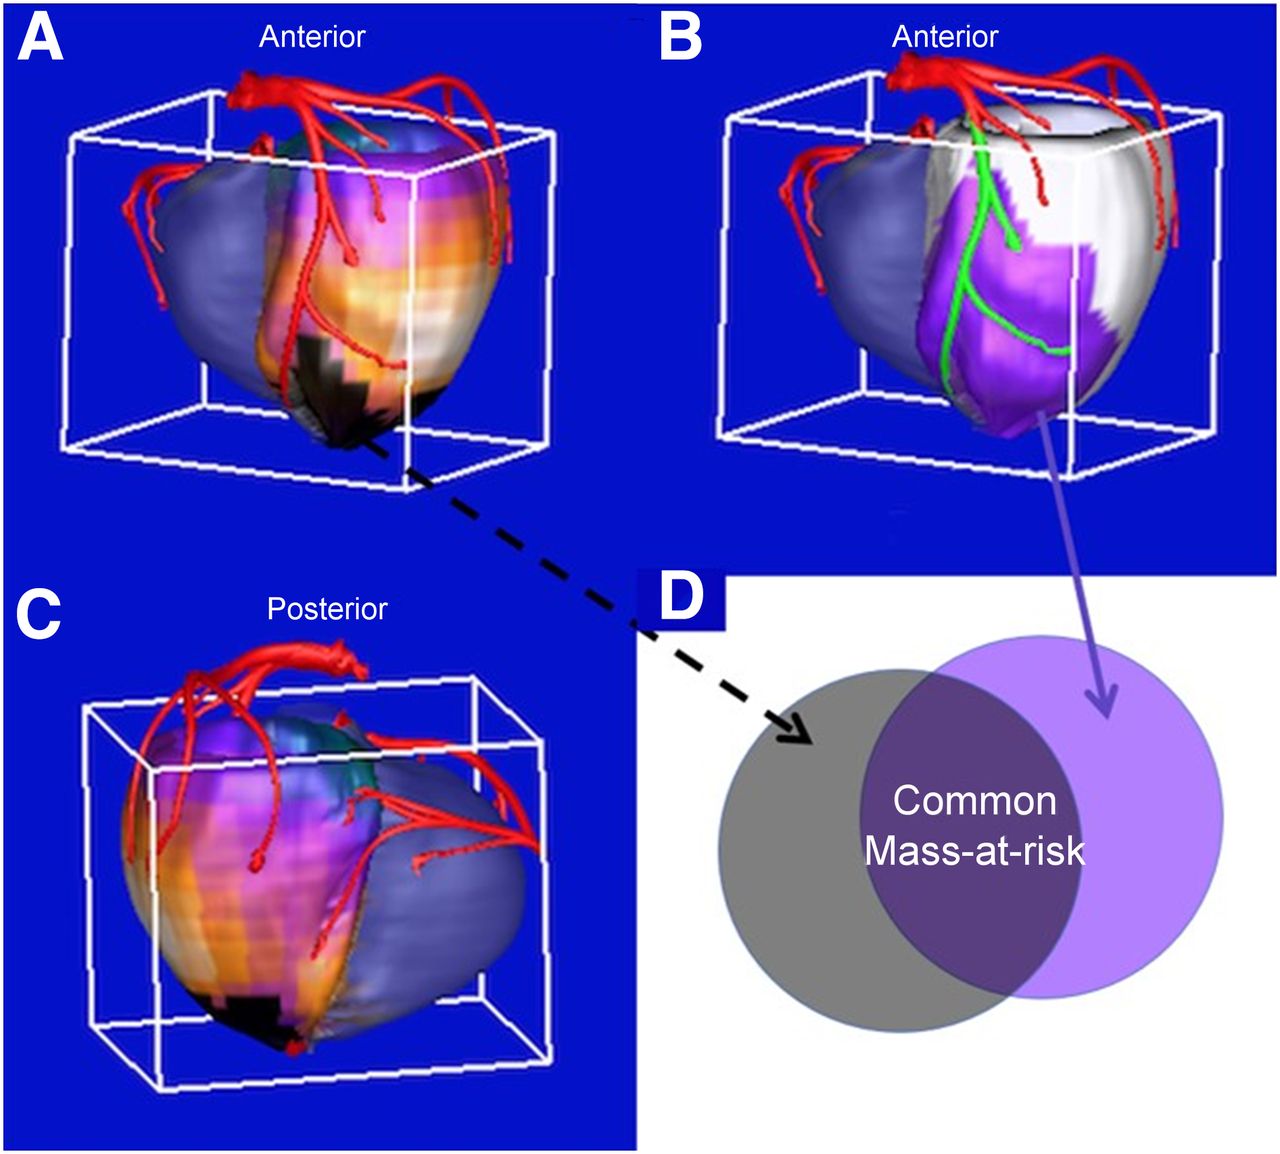
Relative quantification of SPECT MPI/CCTA fused imagery has also been developed, as shown in Figure 2. Myocardium at risk is assessed anatomically, by stenosis on CCTA, and physiologically, by perfusion defect on MPI.9 Piccinelli et al demonstrated that quantitation of common myocardium at risk, ie. myocardium involved anatomically and physiologically, had higher diagnostic accuracy for obstructive CAD compared to CCTA or MPI assessment alone.9 CCTA can also be fused with dynamic PET perfusion imagery to quantify MBF and MFR using patient-specific vascular distributions.10 Fused imaging data sets may be particularly useful for patients with equivocal CCTA or MPI findings, since fusion imaging leads to similar decisions regarding the need for revascularization as invasive coronary angiography.11

Quantitative 3D SPECT/CTA Fusion. Coronary arteries extracted from CT angiography are fused with the patient’s 3D quantitative SPECT MPI to measure mass at risk and increase diagnostic performance for detection of CAD. (A) Physiological myocardium at risk. The 3D perfusion distribution is compared to normal database and abnormal regions are highlighted in black in both the anterior (A) and posterior (C) views to identify the physiologic myocardium at risk. (B) Anatomic myocardium at risk. The portion of the LAD vessel distal to the anatomic lesion identified in the CTA is highlighted in green and the myocardium at risk subtended by this portion of the vessel is shown in purple. (D) Common mass at risk is measured as the region overlapping the anatomic and physiologic mass at risk.
ABSOLUTE MYOCARDIAL BLOOD FLOW
PET Blood Flow
PET is well-established for noninvasive assessment of absolute MBF in humans. Improvements in PET scanner technology and the availability of dedicated clinical software have enabled dynamic PET and MBF assessment to transition from a research tool to broader routine clinical use.12 The value of absolute MBF quantification is its ability to recover the true underlying perfusion defect contrast (e.g., see Figure 2 of Ref.12). The clinical importance of MBF assessment derives from its capability to evaluate the entire coronary system, integrating the effects of microvascular, diffuse, and focal CAD.12,13 Regional MBF at rest and peak hyperemia are used to calculate absolute myocardial flow reserve (MFR), as the ratio of stress MBF divided by rest MBF. Similarly, relative MFR (also known as RFR) is determined by the ratio of hyperemic MBF within a specific perfusion defect divided by hyperemic MBF in remote, normally perfused myocardium. Like invasive fractional flow reserve, RFR is a regional measure associated with a particular coronary distribution and takes on values between 0.0 to 1.0. However, RFR may show discordance with fractional flow reserve as these measures are affected differently by diffuse atherosclerotic or microvascular disease.12
Each of these PET-derived quantities (MBF, MFR, and RFR), as well as relative perfusion, provide complementary information about coronary physiology.12,13 Global MFR provides a measure of diffuse coronary atherosclerosis and microvascular dysfunction, and can supply noninvasive evidence to support the diagnosis of microvascular angina.14 PET-derived flow parameters are best interpreted in combination.12,13 For example, tracer uptake provides the relative severity and extent of perfusion defects, while joint interpretation of stress MBF and MFR as ‘‘coronary flow capacity’’ integrates additional complementary information on the physiological severity of flow limitation.13 According to current consensus guidelines12:
Preserved global hyperemic MBF (> 2 mL·min−1·g−1) and global MFR (> 2) reliably exclude high-risk angiographic CAD;
Severely reduced global MFR (< 1.5) is associated with an increased likelihood of multivessel obstructive disease and should be considered a high-risk feature on PET MPI for which angiographic evaluation may be necessary;
Flow-limiting CAD should be considered in patients with normal PET MPI and severely reduced regional hyperemic MBF (< 1.5 mL·min−1·g−1) and/or MFR (< 1.5) in a single vascular territory.
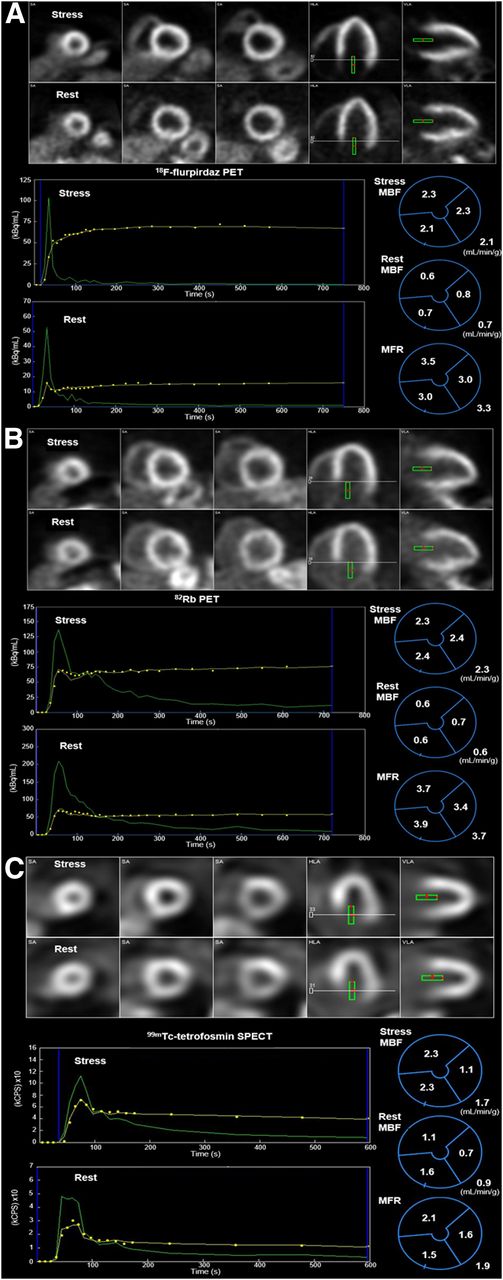
Figure 3A, B provide examples of PET MBF quantification.

Examples of absolute myocardial blood flow quantification. Dynamic images and MBF results for (A) 18F-flurpiridaz PET, (B) 82Rb PET and (C) 99mTc-tetrofosmin SPECT rest-stress studies in three separate patients. The top rows show the summed images. The sampled blood pool region is indicated with the green rectangle. The bottom left rows show the time-activity curves derived from the blood pool region (green) and the total LV myocardium (yellow). On the bottom right are the polar maps of vascular and global MBF and MFR resulting from kinetic modeling. In (A) and (B), vascular and global hyperemic MBF (> 2 mL·min−1·g−1) and MFR (> 2) are within the normal range, whereas reduced values of hyperemic MBF in the LCx (1.1 mL·min−1·g−1), MFR in the LCx (1.6) and RCA (1.5), and global MFR (1.9) are observed in (C).
Clinical dynamic PET presents several technical challenges that can influence the precision and reliability of flow measurement. These include the choice of flow tracer and infusion system, count rate capability of the PET scanner, image reconstruction and post-filtering techniques, correction for patient motion, appropriate temporal sampling and tracer kinetic models.12,15 Several of these hurdles are being addressed by ongoing developments. Automated correction of patient motion during dynamic PET including the blood pool phase has been recently introduced.16-19 Test-retest MBF repeatability of 82Rb PET, which is the most commonly used flow tracer due to its convenient generator production, was improved using a constant-activity rate infusion protocol rather than the more common constant-flowrate protocol.20 The clinical accessibility of 13N-ammonia, an established FDA-approved tracer with better flow characteristics, is increasing with new on-demand dosing using a superconducting mini-cyclotron.21 The investigational perfusion tracer 18F-flurpiridaz, currently in clinical development, also has favorable properties for MBF measurement.22 A recent substudy from the first phase 3 multicenter trial of 18F-flurpiridaz confirmed these benefits and demonstrated added diagnostic value of MBF and MFR against quantitative coronary angiography.22 Significant progress has been made in myocardial image generation for the freely diffusible tracer 15O-water, which has ideal flow characteristics, but its use currently remains limited to specialized research settings.23 Technical improvements in clinical dynamic PET implementation may even facilitate simultaneous routine assessment of myocardial viability using the same model of 82Rb kinetics that is used for MBF estimation.24 In tandem with these technical advances, increased standardization of MBF methodology remains an important goal to help refine abnormal flow thresholds and improve interpretive certainty.
SPECT Blood Flow
Absolute quantification of MBF and MFR by dynamic SPECT with conventional Anger cameras has been explored since the 1990s. However, the recently introduced solid-state, cardiac-centered, cadmium zinc telluride (CZT) SPECT cameras, with improved spatial, temporal, and energy resolution, as well as improved detector sensitivity and count rate performance,25 have motivated wider interest in the development of clinical SPECT MBF estimation. The dynamic imaging capabilities of such cameras enable quantification of absolute MBF using both compartmental modeling,26-28 and a simplified retention model.29,30 Figure 3C provides an example of SPECT MBF quantification.
The well-known limitations of common SPECT perfusion tracers have led to an approach similar to that used for 82Rb PET, which corrects the flow-dependent tracer extraction with an empirical Renkin-Crone extraction model calibrated to independent PET MBF measurements.28 Although the utility of this approach for 82Rb PET is well-established,12,13 its application to SPECT faces several unique challenges. First, the extraction of 99mTc-based tracers at hyperemic flows is much lower than PET tracers,28 and the Renkin-Crone correction induces correspondingly greater MBF variability.15 Thallium-201 has more favorable extraction properties but has additional limitations, including substantial blood-binding.28 While compensation is possible with either a population-based blood-binding correction or suitably calibrated Renkin-Crone model,28 these corrections may also increase MBF variability. Second, the common lack of attenuation correction (AC) for CZT SPECT cameras may impair regional MBF accuracy and precision,28,30 although recent results indicated that global MFR and patient classification using an MFR threshold of 2 were unaffected by the absence of AC.31 Another factor affecting the accuracy of SPECT MFR is appropriate correction of residual tracer activity resulting from a positioning scan prior to the dynamic imaging or from the first study in a one-day imaging protocol.32 Finally, the increased MBF variability contributes to elevated MFR variability that does not cancel in the MFR ratio. Short-term test-retest studies are necessary to establish the repeatability of clinical SPECT MFR. In the only such study reported to-date,33 SPECT MBF and MFR test-retest precision and inter-operator variability were found to be worse compared to PET, likely influenced by the inherently low extraction of 99mTc-based perfusion tracers. Despite these challenges, promising SPECT MFR results have been shown in small single-center human studies compared to PET as the gold standard,26-30 and ongoing prospective clinical studies are aiming to better establish the accuracy and reproducibility (https://clinicaltrials.gov/ct2/show/NCT02280941) and the diagnostic and prognostic utility of SPECT MFR (https://clinicaltrials.gov/ct2/show/NCT03637725, https://clinicaltrials.gov/ct2/show/NCT02697760).
QUANTITATION OF VENTRICULAR FUNCTION
Phase Analysis to Measure Left Ventricular Systolic Dyssynchrony
Many patients with heart failure have dyssynchrony of left ventricular (LV) contraction. Cardiac resynchronization therapy (CRT) can improve LV function and clinical outcomes. The extent of cardiomyopathy, scar burden, and QRS duration are three important determinants of mechanical dyssynchrony; however, the correlation between mechanical dyssynchrony and each of these parameters is far from perfect (r = − 0.49, 0.50-0.65, 0.25-0.50, respectively),34 suggesting that mechanical dyssynchrony may provide incremental value. Therefore, quantification of LV systolic dyssynchrony is potentially important for predicting which patients benefit from resynchronization. LV systolic dyssynchrony is quantified from gated myocardial studies as the regional time delays in the onset of mechanical contraction (OMC) over the LV myocardium.35
Phase histogram, phase standard deviation (SD), histogram bandwidth and phase entropy are the most significant quantitative indices of LV dyssynchrony. Phase SD measures the extent of the deviation of the onset of mechanical contraction in the LV and thus, the larger the SD the more dyssynchronous the LV. Phase SD in normal patients have been shown to range between 5.1° and 31.4° with a mean of 14.2° in males and 11.8° in females. Phase histogram bandwidth is the range of phases (onsets of contraction) encompassing 95% of the phase distribution, the larger the bandwidth the more dyssynchronous the LV. Phase entropy is a measure of ‘‘disorder’’ showing a range between 0 and 1 (0%-100%), the more disordered the LV the more dyssynchronous.36 Quantitation of LV dyssynchrony is fully automated, but processing should be quality controlled and overridden if not conforming to reported recommendations.37 The technique has been shown to have inter and intra-observer reproducibility of ∼ 99%,38 and high repeatability.39 LV dyssynchrony parameters also correlate well with those by tissue Doppler imaging.40 As with other applications, specific algorithms for measuring dyssynchrony vary and practitioners should be aware of potential differences in measurements and clinical thresholds.
Assessment of diastolic dyssynchrony is available in the supplement.
Phase Analysis in CRT Response and Guidance
The role of measuring LV mechanical dyssynchrony to predict which HF patients with LBBB might respond to CRT has been studied extensively. In a retrospective study of 42 patients, a cut-off value for phase SD of 43° was 74% sensitive and 81% specific for clinical response to CRT.41 Changes in dyssynchrony parameters occur immediately after CRT implantation and may predict long-term LV reverse remodeling.42 Similarly, improvement in LV dyssynchrony at six months post-CRT (but not phase SD at baseline) is associated with clinical outcomes.43 Figure 4 illustrates phase analysis in three patient examples and how it could be used to evaluate a patient’s suitability for CRT. Patients with LBBB, in heart failure with LVEF < 35%, a wide QRS (> 130msec) and a dyssynchronous LV (Phase SD > 43°) are expected to benefit from resynchronization.

Examples of phase analysis. (A) A patient with a narrow phase histogram (SD = 7.5°) corresponding to synchronous LV contraction. The open red arrow shows the darker color in the phase polar map and histogram indicating the LV region with the earliest contraction, with the brightest colors being the last regions to contract. The open green arrows show the path of onset of contraction. (B) A patient with LBBB but no HF. The phase histogram is wider (SD = 16.8°) than that of the normal patient. The earliest onset has migrated to the septum and the wave of contraction travels from septum to lateral wall. This LBBB patient is not a candidate for CRT as the LVEF > 35% and the phase SD < 43°. Panel C shows a patient with both LBBB and heart failure (HF). Note the very wide phase histogram indicating a very dyssynchronous LV. This patient is a good candidate for CRT as the LVEF < 35% and the phase SD > 43°.
Software tools have been developed to fuse myocardial OMC activation and viability images to identify the latest viable activation site, which is potentially the optimal LV lead position.44 Promising results from retrospective studies led to efforts at automating this method to guide CRT LV lead position. The VISION-CRT prospective, multicenter, international clinical trial was performed in 195 consecutive patients.43 The trial was designed to determine differences in outcomes between placing the LV CRT lead in the segment recommended by automated phase analysis (on-target) compared to other segments.43 Neither baseline dyssynchrony nor the on-target lead placement predicted CRT response. However, improvement in phase SD between baseline and 6 months was associated with CRT response. This study shows that predicting response to CRT is a complicated process, requiring improvements in software and methodology prior to routine clinical implementation.
APPLICATIONS IN CARDIAC SARCOIDOSIS AND AMYLOIDOSIS
Sarcoidosis and amyloidosis of the heart belong to a broad class of restrictive cardiomyopathies, resulting from increased myocardial stiffness.45 Impaired diastolic function and symptoms of heart failure may affect either or both ventricles, and arrhythmias and conduction abnormalities are frequently observed.45 Cardiac sarcoidosis (CS) is characterized by focal myocardial inflammation and fibrosis.45 There is currently no gold standard for diagnosis, and a complex multimodality imaging approach including CMR and radionuclide imaging is often necessary to both exclude the presence of significant CAD, and identify sarcoidosis activity.46 FDG-PET combined with MPI assessment plays an important role in detecting myocardial inflammation; however, intensive patient preparation to suppress physiologic myocardial FDG uptake is essential for diagnostic accuracy.46 In a recent meta-analysis47 FDG-PET demonstrated good sensitivity and specificity (89% and 78%, respectively) for detecting CS in patients with systemic sarcoidosis by the Japanese Ministry of Health, Labor, and Welfare (JMHW) criteria. While visual assessment of normalized FDG-PET images has been widely utilized, there is some evidence that various quantitative SUV-based metrics may be more reliable, especially for serial FDG-PET to assess treatment response.46 An example of FDG-PET quantitation in a patient with suspected CS is shown in Figure 5. In addition to quantitative FDG-PET, initial investigations suggest that quantitation of perfusion images may be useful. A recent study demonstrated that quantitative assessment of perfusion had higher diagnostic accuracy for CS compared to visual interpretation.48 Similarly, an ongoing randomized multicenter clinical trial aims to determine the optimal treatment strategy for patients with clinically active CS using semi-quantitative assessment of summed rest scores of perfusion images as a measure of myocardial fibrosis.49 Retrospective studies have suggested that quantitative FDG-PET analysis may be useful for prognosis,50 and for serial PET to guide immunosuppression.51 More recently in a larger study, the incremental prognostic value of quantitative measures of both perfusion-metabolism mismatch and heterogeneity of FDG metabolism was demonstrated.52 Further multicenter studies are required to verify the clinical usefulness of these methods to provide prognostic information or guide treatment decisions for patients with CS.

Example of quantitation of abnormal metabolic activity in a patient with biopsy proven sarcoidosis. Background activity in the left ventricular blood pool (LVBP) is quantified using a region of interest (white). Abnormal myocardial activity (cardiometabolic activity), green region of interest, was quantified using a patient-specific threshold based on background activity. LVBP, left ventricular blood pool; SUVmax, maximal standardized uptake value. Reprinted by permission from Springer Nature: JNC, Miller et al, © 2020 ASNC48.
Cardiac amyloidosis (CA) is characterized by myocardial extracellular deposition of misfolded proteins as amyloid, the most common of which are immunoglobulin light chain-associated (AL) and transthyretin (ATTR), with each having distinct prognosis and treatment options.45 Reliable diagnosis of ATTR CA can be performed with planar imaging of bone-avid tracers such as 99mTc-pyrophosphate (99mTc-PYP), 99mTc-3,3-diphosphono-1,2-propanedicarboxylic acid (99mTc-DPD), and 99mTc-hydroxydiphosphonate (HDP) and either visual analysis or heart-to-contralateral (H/CL) ratios.53 In two recent multicenter trials, planar radionuclide imaging demonstrated a sensitivity of 91%-99% and specificity of 86%-92% for ATTR in patients with suspected CA,54,55 and H/CL ≥ 1.6 was predictive of all-cause mortality.54 In addition, the regional distribution of 99mTc-PYP as quantified by SPECT in patients with ATTR CA was shown to be associated with increased risk of mortality.56 However, binding of bone-avid SPECT tracers is not specific for CA and cannot reliably detect AL CA. As such, there is an increased interest in developing PET radiotracers that may be more sensitive for detection of CA, specific for differentiation of AL from ATTR, and capable of quantifying disease burden and treatment response.57 Further investigation is required to elucidate the clinical utility of these PET radiotracers in CA diagnosis, prognosis and therapy monitoring.
QUANTIFICATION OF ACTIVE MICROCALCIFICATION AND INFLAMMATION
Originally used for imaging bone malignancies, FDA-approved 18F-NaF tracer is also taken up during the calcification process during atherogenesis, providing information about formation and progression of atherosclerosis. Dweck et al et al demonstrated higher 18F-NaF activity in patients with coronary atherosclerosis, which correlated with the coronary artery calcium score.58 Novel techniques for the quantification of coronary 18F-NaF activity have recently been developed. Coronary 18F-NaF PET quantification can be applied to separately acquired PET and CCTA scans, facilitating a role for 18F-NaF risk assessment for CCTA scans with equivocal stenosis.59 The use of cardiac, respiratory, and patient motion correction is key to achieving good reproducibility and a high signal-to-noise ratio.60,61 Quantification of whole-vessel coronary 18F-NaF burden is possible, termed coronary microcalcification activity (CMA), providing an overall measure of coronary atherosclerosis analogous to the approach for CT coronary artery calcium scoring. In a cohort of 293 patients, CMA demonstrated higher prognostic accuracy compared to both CT coronary artery calcium score and extent of CAD.62 An example of whole-vessel quantitation of 18F-NaF activity in a patient with multi-vessel CAD is shown in Figure 6. Coronary 18F-NaF quantification will likely become an important test to improve risk prediction and identification of high-risk plaques in patients with established CAD.
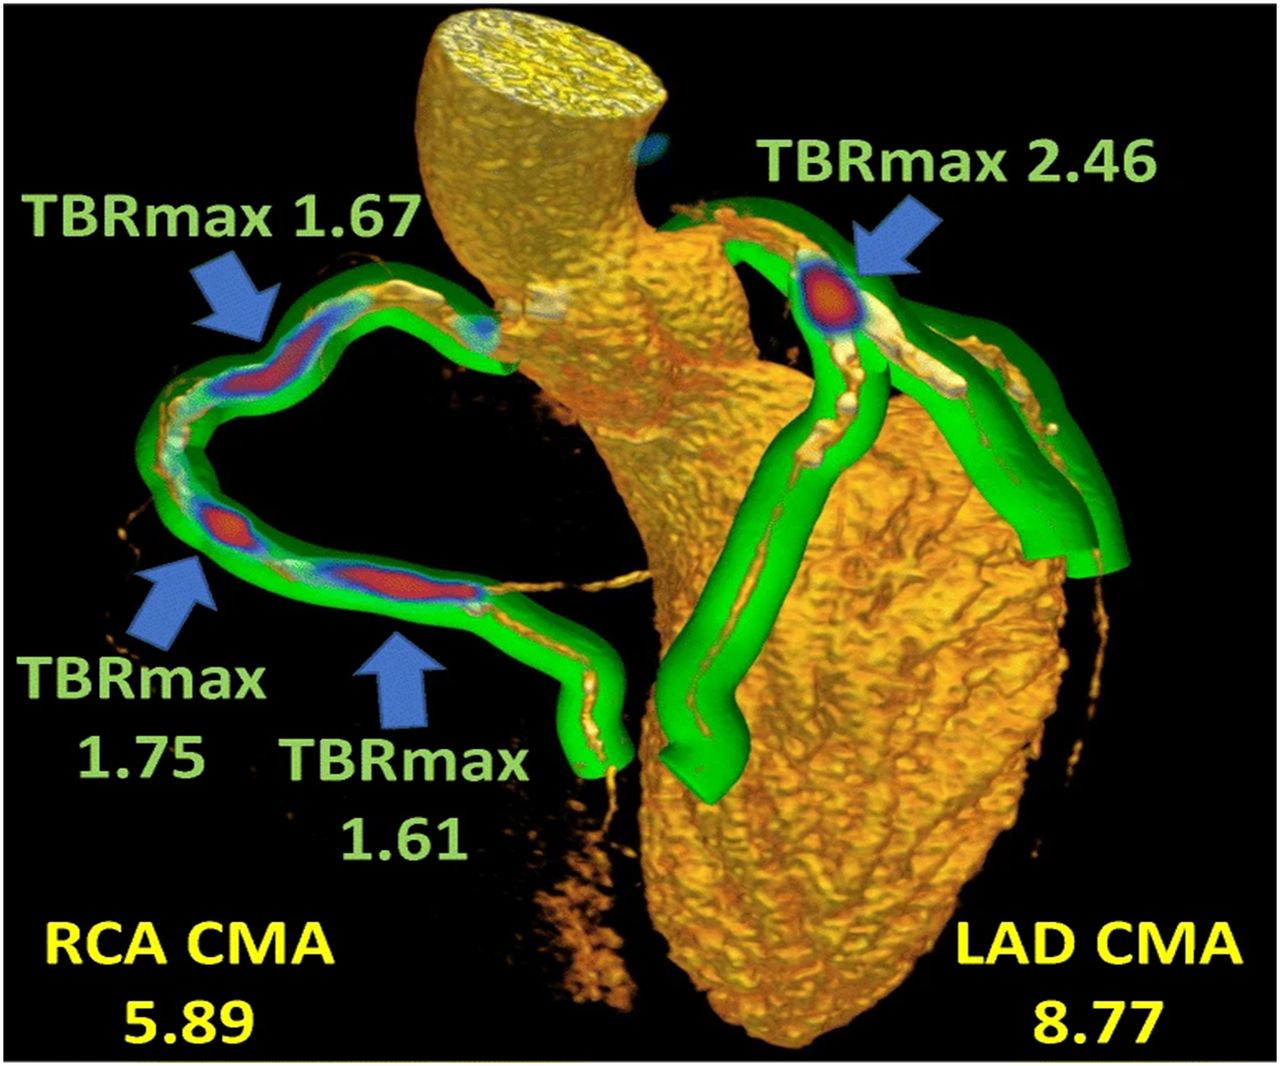
Example of 18F-sodium quantitation. Maximal target to background ratio (TBRmax) and coronary microcalcification activity (CMA) are automatically quantified for each coronary distribution. CMA measures the total volume and intensity of abnormal activity. Summary measures of activity, such as CMA, could potentially be used for risk stratification in a manner analogous to the use of coronary artery calcium scores. Green volumes represent areas adjacent to the coronary arteries, red-blue indicates 18F-sodium activity. Reprinted by permission from Springer Nature: EJNMMI, Kwiecinski et al, © 2020 Springer78.
ARTIFICIAL INTELLIGENCE IN NUCLEAR CARDIOLOGY
AI refers broadly to computer systems which are designed to perform tasks which normally require human intelligence. While there are many different AI techniques, most techniques can be categorized as either ‘‘machine learning’’ (ML) based on feature analysis or image-based deep-learning (DL) techniques.63 ML algorithms build a mathematical model, using pre-defined features but no other specific rules, to make predictions. DL algorithms make predictions directly from imaging data, without being programmed to detect specific features. For all AI approaches, it is critical to ensure a large, diverse data set are used for training and that predictions are tested using data that were not used in any way during model training.
AI Approaches to Myocardial Segmentation
DL has been applied to improve SPECT and PET MPI image segmentation, which is the foundation of all myocardial perfusion and function quantitation techniques. Conventional image processing approaches exhibit high accuracy for image segmentation, with only a small percentage of cases requiring manual corrections. However, the mitral valve plane is frequently problematic. Classical ML, with support vector machines, has been proposed to improve valve plane placement allowing full automation.64 Very recently, preliminary DL methods have also been proposed for the segmentation of the left ventricle for SPECT MPI.65 It remains to be seen if such approaches can outperform classical image processing techniques currently used in available clinical tools. AI could also be used to improve image quality in studies obtained with lower radiation doses or with shorter acquisition times. Shiri et al implemented a DL algorithms, using a convolutional neural network, to improve image quality in SPECT MPI studies using either half the acquisition time per projection or half the number of projections.66 The predicted full-acquisition time images had improved image quality and signal-to-noise ratio compared to half-acquisition images.66
AI Approaches to Disease Prediction and Outcomes
AI-based techniques are well suited to objectively integrate the large number of clinical variables from nuclear cardiology studies. Arsanjani et al demonstrated improvement in diagnostic accuracy for obstructive CAD on angiography with a ML approach compared to quantitative perfusion analysis (86% vs 81%; P < .01).67 DL-based techniques have also been applied to predict obstructive CAD directly from polar maps. In a study including 1638 patients from 9 centers from a large solid-state SPECT MPI registry,68 the DL approach outperformed quantitative analysis of perfusion for identifying CAD on a regional and per patient basis.69 In a subsequent refinement incorporating imaging data from upright and supine acquisitions in 1,160 patients, the DL model demonstrated improved diagnostic accuracy for obstructive CAD compared to combined quantitative analysis of images with accuracy similar to expert clinical reading.70 Spier et al developed a separate DL-based algorithm, which achieved agreement of ∼90% with expert visual interpretation.71 These studies demonstrate the potential for AI-based techniques to augment physician interpretation to improve diagnosis of obstructive CAD.
In addition to disease diagnosis, recent studies demonstrated that AI-based techniques could improve prediction of cardiac events. Betancur et al applied feature-based ML to determine the benefit of combining clinical and imaging SPECT MPI features.72 ML with tenfold cross-validation had higher AUC for major adverse cardiovascular event (MACE) compared to expert visual interpretation, stress TPD, and ischemic TPD.72 Additionally, almost 20% of patients in the highest percentile (95th) of MACE risk by the ML score had ‘‘normal’’ expert visual interpretation of perfusion. Classical ML predicts revascularization after SPECT MPI with similar accuracy to expert readers,73 and can outperform quantitative analysis of perfusion for predicting revascularization on a per-vessel and per patient basis.74
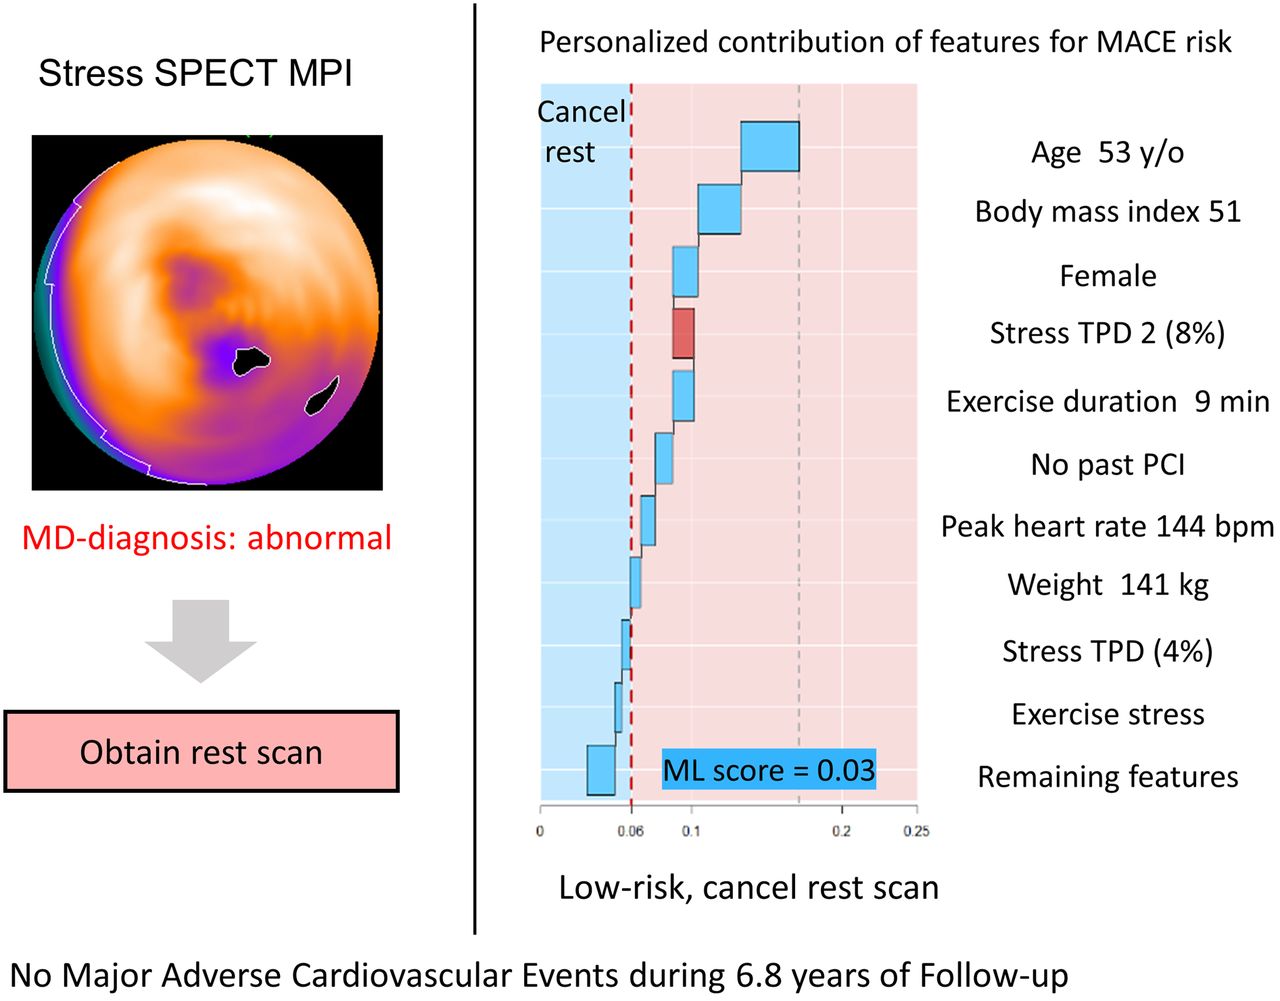
While the potential for improvement in disease diagnosis or risk prediction with AI-based techniques is clear, methods to implement them into clinical practice still require delineation. One potential implementation is generating automated structured reports. Garcia et al demonstrated that an AI algorithm could generate an automated structured report with comparable diagnostic accuracy to expert interpretation.75 In 20,414 patients, Hu et al demonstrated that an ML-based algorithm could be used to identify patients for rest scan cancelation at low risk of MACE from stress-only imaging.76 Automatic, AI-based rest scan cancellation selected 60% of patients for rest cancellation with 1.4% annual MACE risk compared to 2.1% annual risk based on visual analysis.76 Lastly, methods for patient-specific explainability of risk predictions are critical for clinical implementation. For some ML approaches, individual features contributing to the ML-derived risk score for a given subject can be displayed (Figure 7).

Example of explainable AI and possible implementation showing prediction of major adverse cardiovascular events (MACE) from stress-only data with machine learning (ML). Algorithms like this could be implemented to facilitate decisions regarding rest scan cancellation without the need for an on-site physician and with a high degree of safety. Reprinted from EHJCI, Hu et al, 2020, by permission of Oxford University Press76.
CONCLUSIONS
Methods to improve disease diagnosis or risk prediction with quantitative analysis of perfusion and dyssynchrony will continue to be refined and should be considered for clinical implementation. This may be particularly important for diseases with a lower prevalence such as cardiac sarcoidosis and cardiac amyloidosis. PET MBF can be estimated reliably, used to identify significant CAD, improves prognostication and is ready for routine clinical implementation. In parallel to the evolution of established techniques, novel techniques such as SPECT MBF and radiotracers such as 18F-NaF have emerged and show potential clinical utility. AI-based techniques can potentially improve disease diagnosis and risk prediction as a supplement to physician interpretation. Methods to efficiently integrate AI into clinical practice still require further validation and refinement. The field of nuclear cardiology will keep advancing and physicians should continually assess how to integrate new techniques into clinical practice.
Disclosures
Dr. Slomka receives grants from the National Institutes of Health and Siemens Medical Systems and receives software royalties from Cedars-Sinai Medical Center. Dr. Moody, Ms. Renaud, and Dr. Ficaro are employees of INVIA. Ms. Renaud is a consultant to Jubilant DraxImage Inc. and receives royalties from the sales of FlowQuant® software. Dr. Miller has no relevant disclosures. Dr. Garcia has a grant from the National Institutes of Health and receives royalties from and owns an equity position with Syntermed. He is also a consultant for GE Healthcare.
Footnotes
Electronic supplementary material The online version of this article (https://doi.org/10.1007/s12350-020-02337-4) contains supplementary material, which is available to authorized users.
This article is being jointly published in The Journal of Nuclear Medicine (https://doi.org/10.2967/jnumed.120.242537) and the Journal of Nuclear Cardiology (https://doi.org/10.1007/s12350-020-02337-4).
Reprint requests: Piotr J. Slomka, PhD, FACC, Department of Imaging (Division of Nuclear Medicine), Medicine, and Biomedical Sciences, Cedars-Sinai Medical Center, Los Angeles, CA; slomkap{at}cshs.org
Published online Oct. 16, 2020.
- © 2021 by the Society of Nuclear Medicine and Molecular Imaging, and American Society of Nuclear Cardiology.
References
- 1.↵
- 2.↵
- 3.↵
- 4.↵
- 5.↵
- 6.↵
- 7.↵
- 8.↵
- 9.↵
- 10.↵
- 11.↵
- 12.↵
- 13.↵
- 14.↵
- 15.↵
- 16.↵
- 17.
- 18.↵
- 19.↵
- 20.↵
- 21.↵
- 22.↵
- 23.↵
- 24.↵
- 25.↵
- 26.↵
- 27.
- 28.↵
- 29.↵
- 30.↵
- 31.↵
- 32.↵
- 33.↵
- 34.↵
- 35.↵
- 36.↵
- 37.↵
- 38.↵
- 39.↵
- 40.↵
- 41.↵
- 42.↵
- 43.↵
- 44.↵
- 45.↵
- 46.↵
- 47.↵
- 48.↵
- 49.↵
- 50.↵
- 51.↵
- 52.↵
- 53.↵
- 54.↵
- 55.↵
- 56.↵
- 57.↵
- 58.↵
- 59.↵
- 60.↵
- 61.↵
- 62.↵
- 63.↵
- 64.↵
- 65.↵
- 66.↵
- 67.↵
- 68.↵
- 69.↵
- 70.↵
- 71.↵
- 72.↵
- 73.↵
- 74.↵
- 75.↵
- 76.↵
- 77.↵
- 78.↵
- Received for publication June 12, 2020.
- Accepted for publication July 28, 2020.


Jump to section
- Article
- Abstract
- INTRODUCTION
- QUANTITATION OF REGIONAL VENTRICULAR PERFUSION
- ABSOLUTE MYOCARDIAL BLOOD FLOW
- QUANTITATION OF VENTRICULAR FUNCTION
- APPLICATIONS IN CARDIAC SARCOIDOSIS AND AMYLOIDOSIS
- QUANTIFICATION OF ACTIVE MICROCALCIFICATION AND INFLAMMATION
- ARTIFICIAL INTELLIGENCE IN NUCLEAR CARDIOLOGY
- CONCLUSIONS
- Footnotes
- References
- Figures & Data
- Supplemental
- Info & Metrics