


Abstract
The aim of this study was to evaluate the physical performance of the Vereos whole-body PET/CT system according to the National Electrical Manufacturers Association (NEMA) NU2-2012 standard and to compare it with other state-of-the-art PET/CT systems. Methods: Spatial resolution, sensitivity, count-rate performance, count rate accuracy, and image quality were assessed. Specifically, spatial resolution was measured using an 18F point-source. System sensitivity was calculated from acquisitions of an 18F line source inside aluminum tubes of varying thickness. Assessment of count rate performance and count rate accuracy was based on measurements of an 18F line source inside a 20-cm-diameter polyethylene cylinder. PET image quality was assessed using a NEMA IQ phantom. All measurements were performed according to the predefined and implemented NEMA NU2-2012 acquisition protocols at a clinical installation of a Vereos PET/CT system. Evaluation was performed using the software provided by the vendor. Results: The average (radial and tangential) transverse spatial resolution was 4.2, 4.5, and 5.5 mm in full width at half maximum for a 1-, 10-, and 20-cm radial offset, respectively, from the center of the field of view. Axial spatial resolution varied between 4.2 and 4.6 mm in full width at half maximum, depending on the radial source position. The average sensitivity was 5.2 cps/kBq. A peak noise-equivalent count (NEC) rate of 153.4 kcps was measured at an activity concentration of 54.9 kBq/mL. The scatter fraction at peak NEC rate was 33.9%, and the maximum count rate error at and below peak NEC rate was 6.8%. Contrast recovery coefficients varied from 54.3% (10-mm sphere) to 83.9% (22-mm sphere) for the hot spheres, and between 81.4% (28-mm sphere) and 87% (37-mm sphere) for the cold spheres for a given sphere-to-background ratio of 4:1. Conclusion: The overall performance characteristics of the Vereos PET/CT system are comparable to state-of-the-art whole-body PET/CT systems with the exception that the peak NEC rate occurs at a higher activity concentration, thus indicating the ability of the Vereos PET/CT system to cover a wider range of activities.
PET is a noninvasive imaging method to visualize and quantify functional biologic processes in living organisms. Through combination with CT, PET imaging has become a diagnostic tool in clinical routine for oncology, neurology, and cardiology patients (1).
Since its introduction in the 1970s (2), PET technology has advanced significantly (3,4). New scintillator materials have become available that provide a suitable balance of stopping power, light output, and short scintillation times (5). In addition, alternatives to standard photomultiplier tubes (PMTs) are now available, such as avalanche photodiodes or silicon photomultipliers (SiPM) (6,7). SiPMs have the benefit of providing a gain similar to PMTs (gain factor, ∼104) together with a good energy resolution and time resolution. In clinical PET systems using SiPMs, for example, an energy resolution of less than 10% in full width at half maximum (FWHM) and coincidence time resolutions of less than 400 ps FWHM can be achieved (8,9). In contrast, avalanche photodiodes offer only a relatively low gain (gain factor, ∼102) and a time resolution not suitable for time-of-flight (TOF) measurements (7).
SiPMs consist of an array of small photosensitive cells (with a cell size of between 10 and 100 μm (10)), which are operated in Geiger mode (11). Each time an optical photon hits one of these cells, a charge avalanche is produced resulting in a discrete signal. Because of the high number of cells within the SiPM (between 100 and 10,000 (10)), the number of scintillation photons can be counted. The energy of the incident γ-photon can be resolved in an SiPM by either summing the discrete signal from all cells on an SiPM (also known as analog SiPM) or by directly counting the number of arriving photons (also known as digital SiPM or digital photon counting) (12–15). To date, SiPMs are used in a comparably small number of clinical PET systems: the GE Healthcare Signa PET/MRI system (9), the GE Healthcare Discovery MI PET/CT system (8), the Siemens Vision PET/CT system, and the Philips Vereos PET/CT system.
With these new detector technologies, the performance of PET systems can be substantially improved (16). Nonetheless, the performance of a PET system is dependent not only on the photon detectors applied but also on factors such as the detector arrangement, the electronics and signal processing, and the image reconstruction software. To characterize a PET system, standardized procedures are needed such as published by the National Electrical Manufacturers Association (NEMA) in the NEMA NU2 standards (17). However, such standardized performance evaluations of systems using SiPMs have been published only for the Signa PET/MRI system (9) and the Discovery MI PET/CT system (8). For the Vereos PET/CT system, data on system performance are available only from a prototype installation and published as an abstract (18). Therefore, the aim of this study was to evaluate the performance of a clinical installation of the Vereos PET/CT system according to NEMA NU2-2012 and to compare it with other state-of-the-art PET/CT systems.
MATERIALS AND METHODS
Ethical Approval
All procedures performed in studies involving human participants were approved by the local ethics committee and were in accordance with the 1964 Helsinki declaration. All subjects gave their written informed consent.
PET/CT System
The PET component of the whole-body Vereos PET/CT system consists of 18 detector modules arranged cylindrically with a ring diameter of 764 mm and covering an axial length of 164 mm. Each detector module consists of an array of 40 × 32 lutetium-yttrium oxyorthosilicate (LYSO) crystals (4 × 4 × 19 mm each), which are individually coupled to SiPM detectors (1:1 coupling). Each SiPM consist of 3,200 avalanche photodiodes operated in Geiger mode. The arriving scintillation photons are counted individually (also known as digital SiPM or digital photon counting) thanks to an application-specific circuit that is integrated within the SiPM chip.
Before the NEMA NU2-2012 measurements, the energy resolution and timing resolution were assessed following the standard procedure implemented in the daily quality control protocol. A 14.4-MBq 22Na point source (Eckert and Ziegler Isotope Products) was positioned in the center of the PET field of view (FOV), and the daily quality control procedure was started. The energy resolution and timing resolution are calculated automatically as part of the daily quality control protocol from histograms of the measured photon energies and differences in the arrival time of coincidence photons.
NEMA NU 2-2012 Measurements
The Vereos PET/CT system that was used for these measurements was manufactured in September 2017 and installed in December 2017 at the Department of Nuclear Medicine, Hospital Sant Pau, Barcelona, Spain. The measurements were performed at the site of the clinical installation between January 9 and 10, 2018.
All measurements were performed using the NEMA NU2-2012 acquisition protocols implemented in the system and evaluated using the NEMA NU2-2012 evaluation tools provided by the vendor. The default energy window was set to 450–613 keV, and the transaxial FOV was set to 576 mm. The coincidence timing window was 4 ns.
Spatial Resolution
For the evaluation of spatial resolution, a point source with an axial extent of less than 1 mm was prepared inside a capillary tube (Pyrex capillary tubes, catalog number 9530-1; Corning Life Science) provided by the vendor. The point source consisted of an aqueous solution of 18F-FDG of a total activity of 1.95 MBq at the start of the first acquisition. The measurements were conducted with the point source in the central plane of the FOV and three eighths of the FOV off the central plane in the axial direction. The transaxial placement of the point source was at a 1-, 10-, and 20-cm radial distance in the vertical direction from the transaxial center of the FOV.
For each point source position, an emission scan was performed according to the implemented NEMA resolution protocol collecting 3 × 10⁶ counts for each measurement. Images were reconstructed using the implemented NEMA resolution reconstruction protocol (NEMA-resolution.xml) without attenuation and scatter correction. The reconstruction method was based on a 3-dimensional Fourier reprojection algorithm (19) and resulted in 163 axial images (slice thickness, 1 mm) with a matrix size of 576 × 576 (1 × 1 mm pixel spacing). No postreconstruction filtering was applied.
The images were evaluated according to NEMA NU2-2012, section 3. For each radial offset of the point source, the axial, radial, and tangential resolutions (in FWHM and full width at tenth maximum) were calculated as the average of the measurements at the central and three-eighths-offset axial positions.
Sensitivity
Volume sensitivity was measured using the NEMA PET sensitivity phantom (Data Spectrum Corp.), consisting of 5 concentric aluminum sleeves of 70-cm length each. A 702-mm-long line source made of a polyethylene tube filled with an aqueous solution of 18F-FDG was placed inside the aluminum sleeves with an activity of 4.68 MBq at the start of scanning. The phantom was placed parallel to the main axis of the tomograph, in the center of the transaxial FOV and at a 10-cm radial distance. Five measurements were taken at both radial positions, successively removing 1 aluminum sleeve after each acquisition. The implemented acquisition protocol for NEMA sensitivity was used (NEMA-sensitivity.xml), comprising a 2-min acquisition for each measurement and randoms subtraction from a delayed coincidence window. System sensitivity was calculated according to NEMA NU2-2012, section 5, as the rate in counts per second that true coincidence events are detected for a given source strength.
Scatter Fraction and Count Rate Performance
Scatter fraction and count rate performance were measured using a NEMA PET scatter phantom (Data Spectrum Corp.). This phantom consisted of a 70-cm-long polyethylene cylinder of 20-cm diameter with a 70-cm line source inserted parallel to the long axis of the phantom 45 mm radially from the center. The phantom was centered within the FOV, with its long axis parallel to the axis of the tomograph and with the line source oriented toward the lower end of the phantom on a vertical line through the phantom center. The line source was filled with an aqueous solution of 18F-FDG, with a filling length of 700 mm and an activity of 1,425.6 MBq at the start of scanning. Acquisitions where performed using the implemented protocol for the NEMA count rate performance test (NEMA-scatter.xml). The protocol consists of a 15-h 50-min dynamic (list mode) acquisition followed by histogramming of the PET raw data into 30 frames of varying duration. System total, true, random, scatter, and noise equivalent count (NEC) rates were calculated according to NEMA NU2-2012, section 4.
Accuracy of Count Losses and Randoms Corrections
To calculate the accuracy of count losses and randoms corrections, the PET raw data acquired for the count rate evaluation were reconstructed using a dedicated implemented reconstruction protocol (NEMA-Count-Loss.xml). Randoms were estimated from a delayed coincidence timing window, and scatter correction was performed using single-scatter simulation. Reconstruction was based on an ordered-subsets expectation-maximization algorithm with 3 iterations and 15 subsets, resulting in 41 axial images (slice thickness, 4 mm) with a matrix size of 144 × 144 (4 × 4 mm pixel spacing). No postreconstruction filtering was applied. The relative count rate error was calculated according to NEMA NU2-2012, section 6. The axial end slices (first and last axial slices) have been excluded from this analysis as permitted by the NEMA NU2-2012 standard.
Image Quality
To assess image quality, a NEMA International Electrotechnical Commission body phantom (Data Spectrum Corp.) was used. The phantom consists of a background compartment with a measured volume of 9.8 L, a low-density lung insert (density of ∼0.3 g/mL) in the center, and 6 fillable spheres arranged circumferentially around the lung insert, with internal diameters of 10, 13, 17, 22, 28, and 37 mm. The background compartment of the phantom was filled with an aqueous solution of 18F-FDG with a concentration of approximately 5.3 kBq/mL. The 37- and 28-mm spheres were filled with nonradioactive water (cold). The remaining spheres were filled with an aqueous solution of 18F-FDG with an activity concentration of 8 times (first set of measurements) and 4 times (second set of measurements) the background concentration.
The phantom was centered in the FOV of the PET system with all spheres located in the central transaxial plane. To mimic contributions of radiation arising from outside the FOV, the NEMA PET scatter phantom was placed at the head end of the image-quality phantom as requested by NEMA NU2-2012, section 7. For both sphere-to-background concentrations (8:1 and 4:1), 3 subsequent measurements with 3-min acquisition times were performed using the vendor-provided image-quality acquisition protocol (NEMA-imagequaltiy.xml).
A low-dose CT scan (120-kVp tube voltage, 50-mAs exposure, 0.83 pitch) was part of the acquisition protocol and acquired before the PET measurements for the purpose of CT-based attenuation correction. Reconstructions of all measurements were performed using the implemented NEMA image-quality reconstruction protocol (NEMA-imagequaltiy.xml). The protocol applies an ordered-subsets expectation-maximization algorithm with point-spread function correction (PSF I; iterations, 1; regularization, 6) using 3 iterations and 17 subsets and including TOF information. Images are reconstructed into 82 axial slices (slice thickness, 2 mm) with a matrix size of 288 × 288 (2 × 2 mm pixel spacing). No postreconstruction filtering was applied. Average contrast recovery coefficients and the corresponding background variability were calculated for all spheres, together with the relative error in the lung insert.
To present the clinical image quality of the Vereos PET/CT system, an example of a clinical patient undergoing a routine 18F-FDG PET/CT examination was added. A whole-body PET/CT examination was performed 69 and 156 min after injection of 260 MBq of 18F-FDG on the Vereos PET/CT system and a Philips Gemini PET/CT system, respectively. The on-site standard protocols where used for both examinations, consisting of an acquisition time of 2 min/bed position followed by an ordered-subsets expectation-maximization reconstruction (2 iterations, 10 subsets) using a 288 × 288 matrix for the Vereos PET/CT system and a blob ordered-subsets TOF reconstruction (3 iterations, 33 subsets) using a 144 × 144 matrix for the Gemini PET/CT system.
RESULTS
Energy and Timing Resolution
The measured energy resolution was 11.2% FWHM and the timing resolution 310 ps FWHM.
Spatial Resolution
The measured axial and transaxial spatial resolutions were 4.2 mm FWHM at a 1-cm radial offset (Table 1). At a 20-cm radial offset, the spatial resolution degraded to a FWHM of 4.6, 4.9, and 5.8 mm in the axial, transverse tangential, and transverse radial directions, respectively. All values are summarized in Table 1.
Spatial Resolution Measured for PET Component of Vereos PET/CT System (NEMA NU2-2012)
Sensitivity
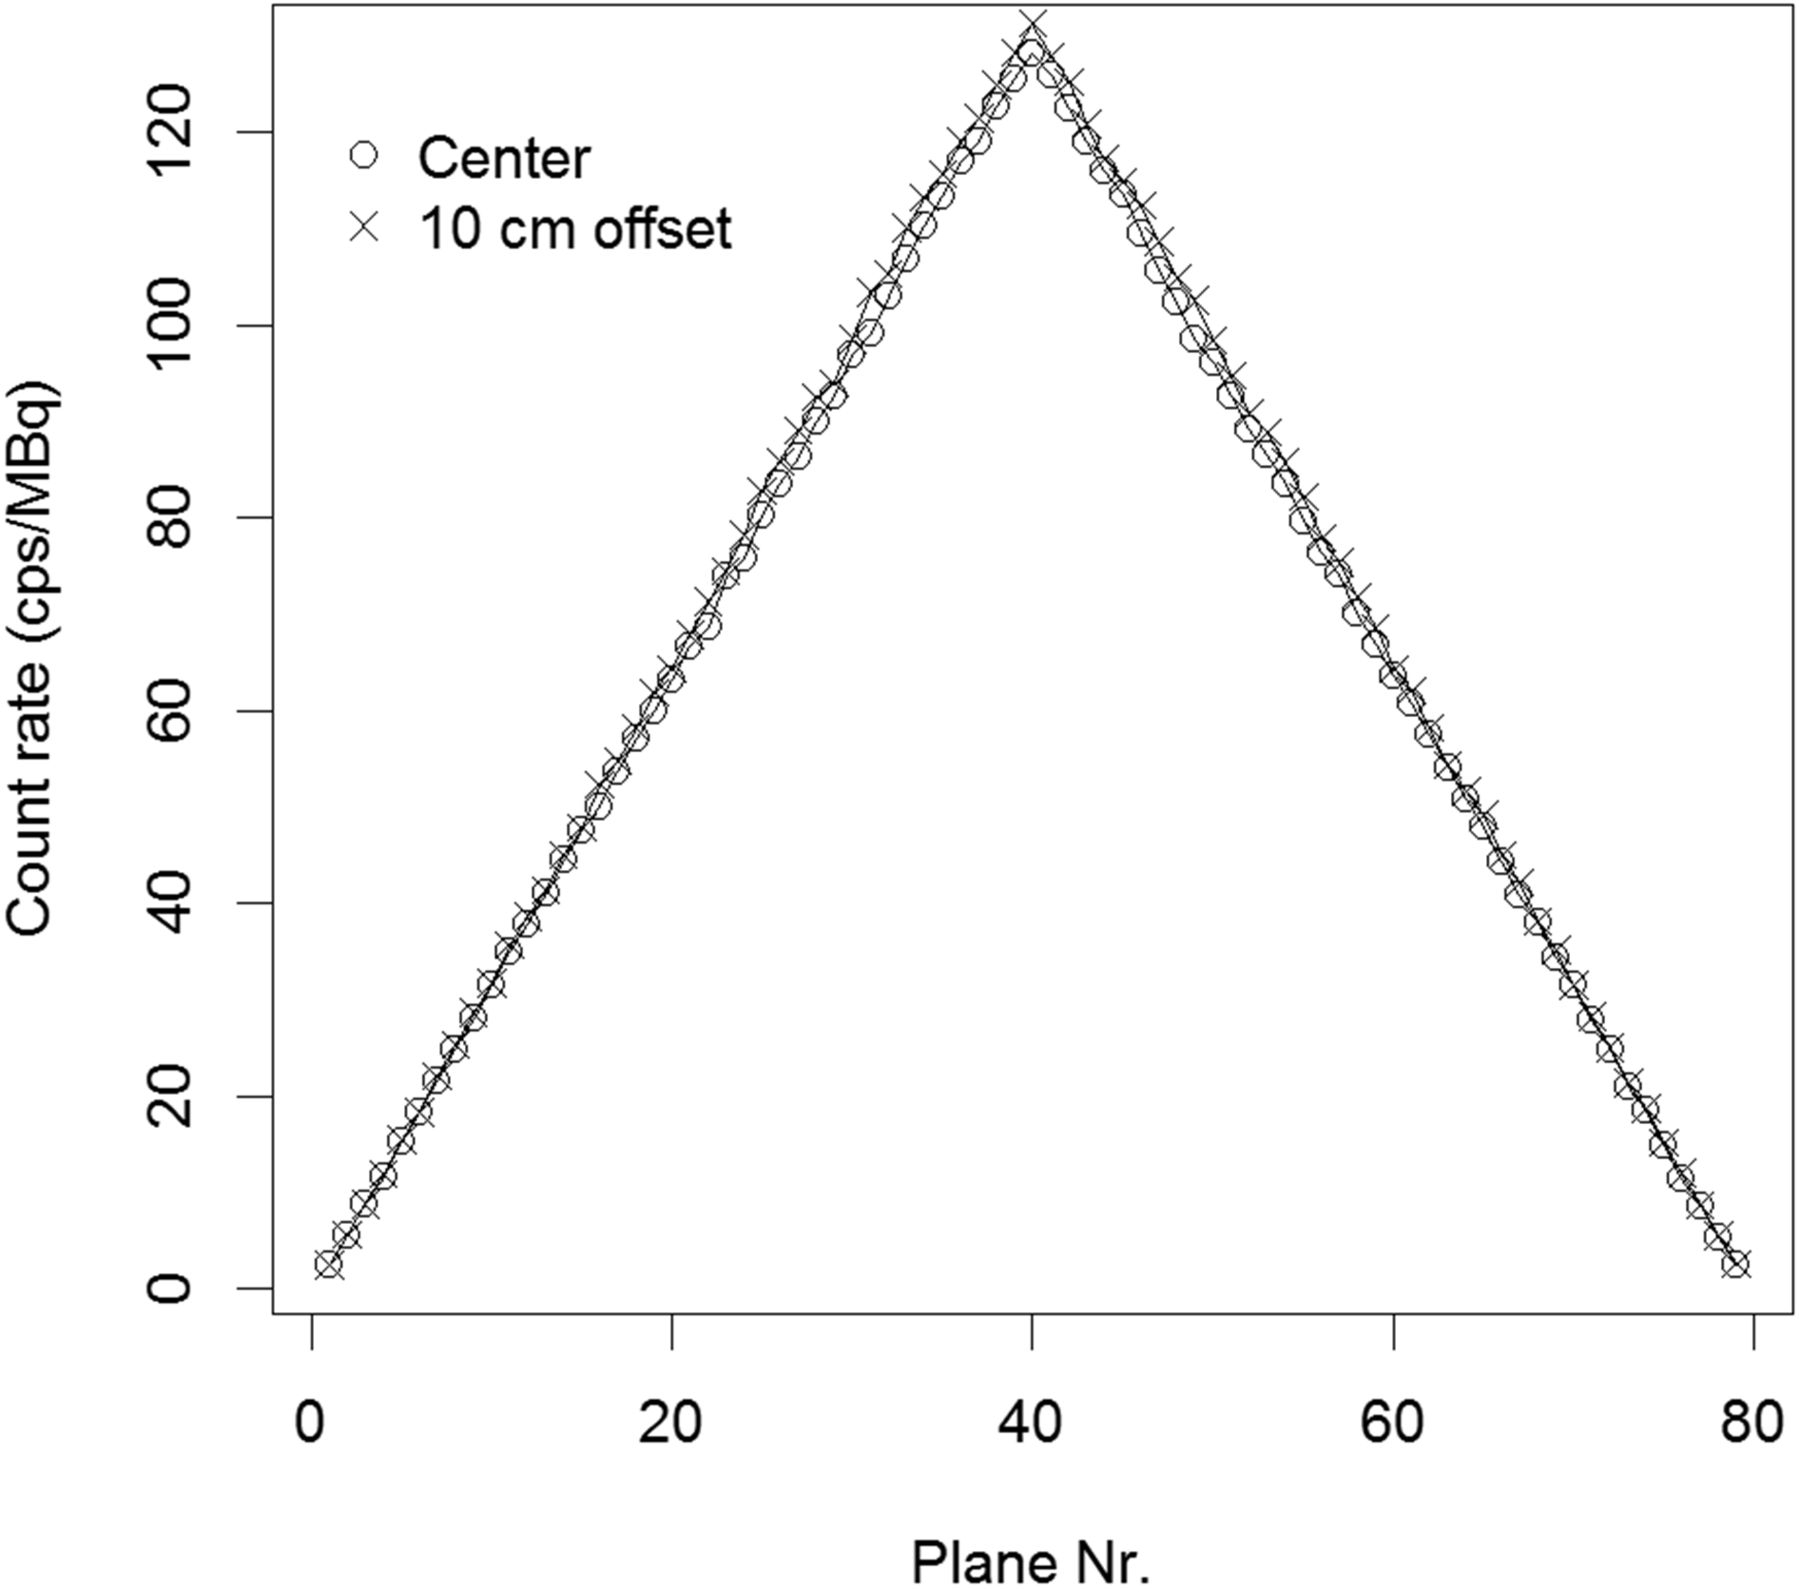
Average system sensitivity was 5.2 cps/kBq (Table 2). The axial sensitivity profiles with the line source placed at the center of the FOV and at a 10-cm radial offset are shown in Figure 1, which depicts the sensitivity change along the long axes of the PET system.
System Sensitivity Measured for Vereos PET/CT System (NEMA NU2-2012)

Vereos sensitivity: axial sensitivity profile for measurements with line source in center of FOV and at 10-cm radial offset.
Scatter Fraction and Count Rate Performance
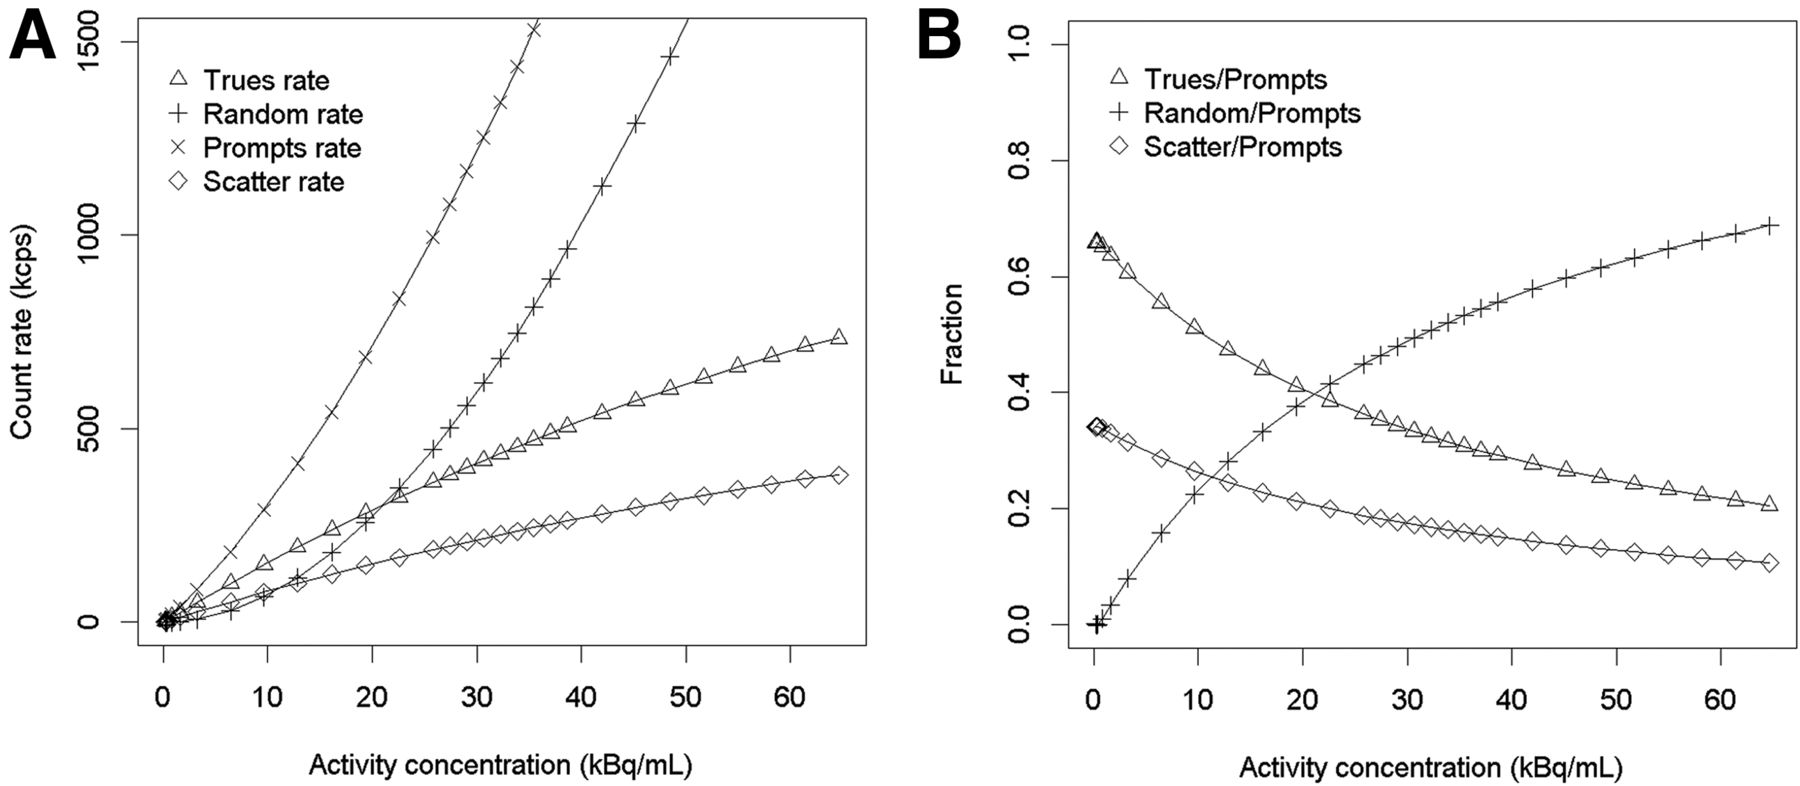
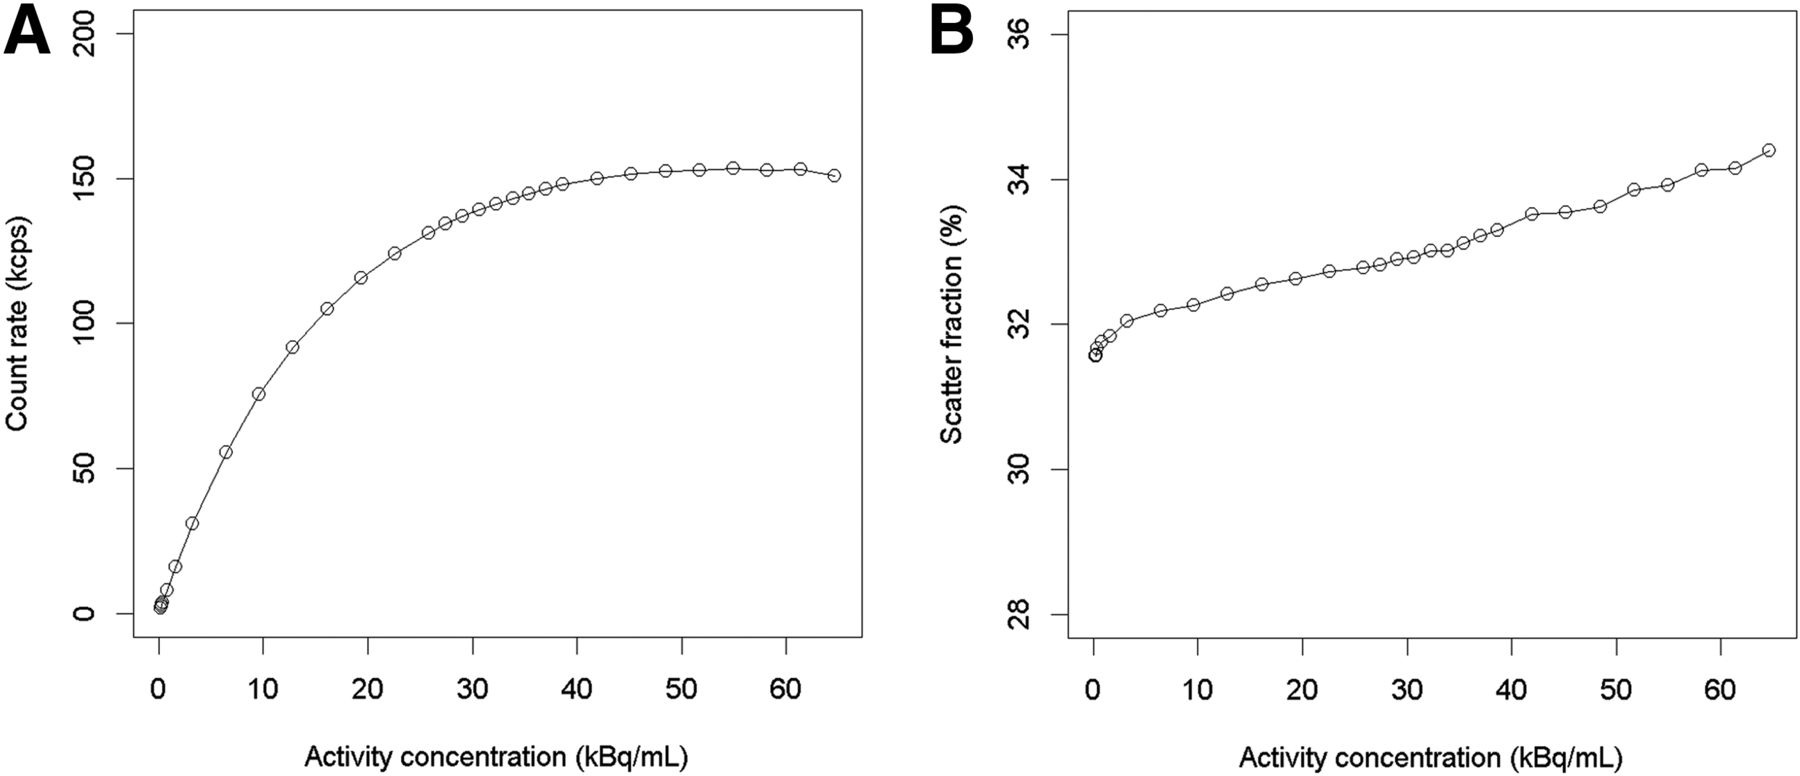
The peak NEC rate was 153.4 kcps at a 54.9 kBq/mL activity concentration. The corresponding scatter fraction at the peak NEC rate was 33.9%. At a clinically relevant activity concentration of 5.3 kBq/mL, a NEC rate of 47.2 kcps and a scatter fraction of 32.1% were observed. Measured peak trues rate and scatter fraction at low count rates are summarized in Table 3. Plots of the prompts, trues, randoms, and scatter count rates for the different activity concentrations are shown in Figure 2. Figure 3 illustrates the NEC rate and the scatter fraction at different activity concentrations.
Measured Count Rates and Scatter Fractions for Vereos PET/CT System (NEMA NU2-2012)

Vereos count rate performance: prompts, trues, randoms, and scatter count rates (A); trues, randoms, and scatter counts as function of total number of coincidences recorded (B).

Vereos NEC rate. (A) NEC rate as function of activity concentration in phantom calculated according to NEMA NU2-2012. Peak NEC rate was 153.4 kcps at 54.9 kBq/mL. (B) Scatter fraction for same range of activities. Scatter fraction at peak NEC rate was 33.9%.
Count Rate Accuracy
The maximum count rate error at and below NEC peak was 6.8%. Figure 4 depicts the maximum and minimum count rate error calculated for different activity concentrations.

Vereos count rate accuracy: maximum and minimum relative count rate errors for different activity distributions. First and last slices of acquisitions were excluded from this evaluation.
Image Quality
The calculated activity concentration for both sphere-to-background concentrations was 5.4 kBq/mL at the start of the second acquisition. Contrast recovery coefficients ranged from 54.3% (10-mm sphere; sphere-to-background ratio, 4:1) to 86.5% (22-mm sphere; sphere-to-background ratio, 8:1) for the hot spheres. The average lung residual was measured to be 6.4% for both the 4:1 and the 8:1 measurements. All contrast recovery coefficients and corresponding background variability are summarized in Table 4. The central slice of the image-quality phantom for the 4:1 and 8:1 measurements is shown in Figure 5.
Image Quality Results for 4:1 and 8:1 Sphere-to-Background Ratios for Vereos PET/CT System (NEMA NU2-2012)
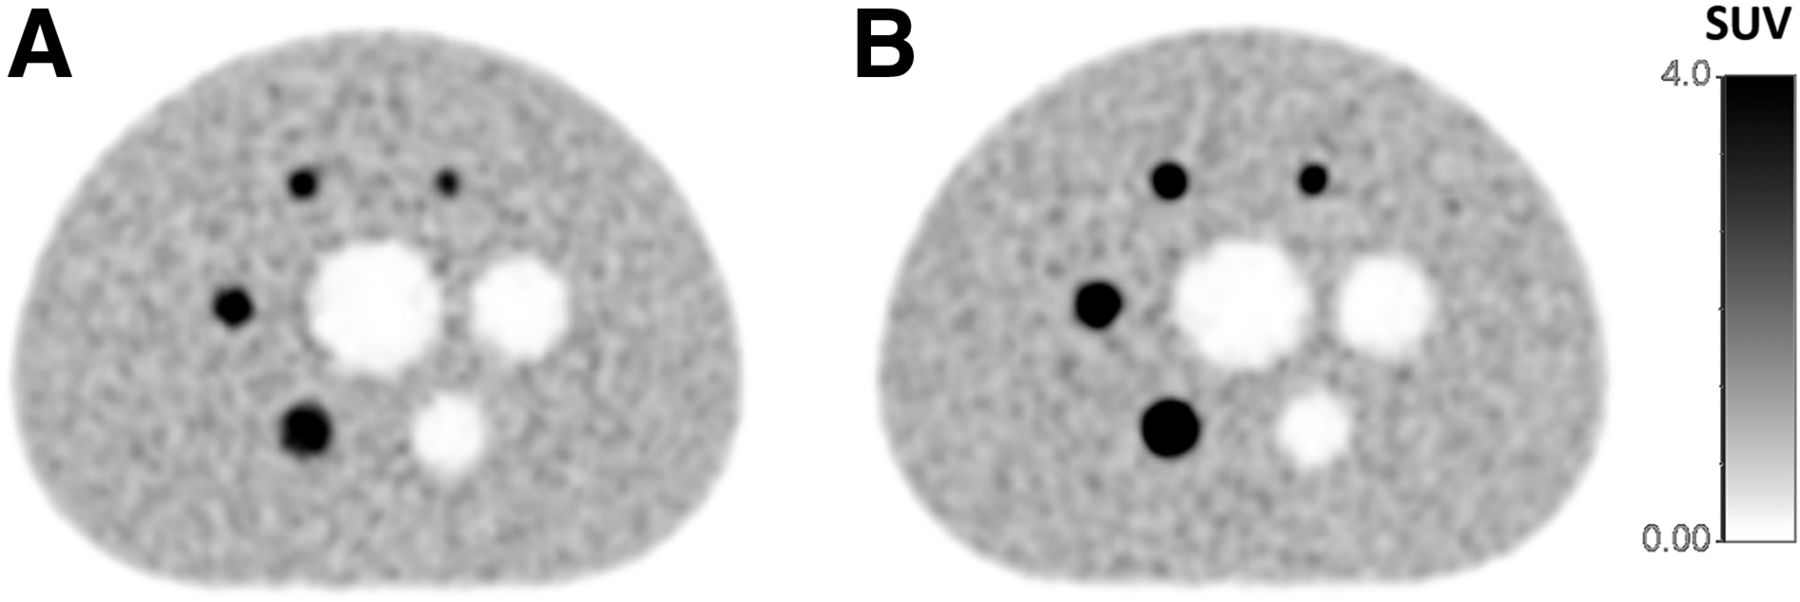
Vereos image quality: central slice of image-quality phantom for 4:1 (A) and 8:1 (B) sphere-to-background ratio.
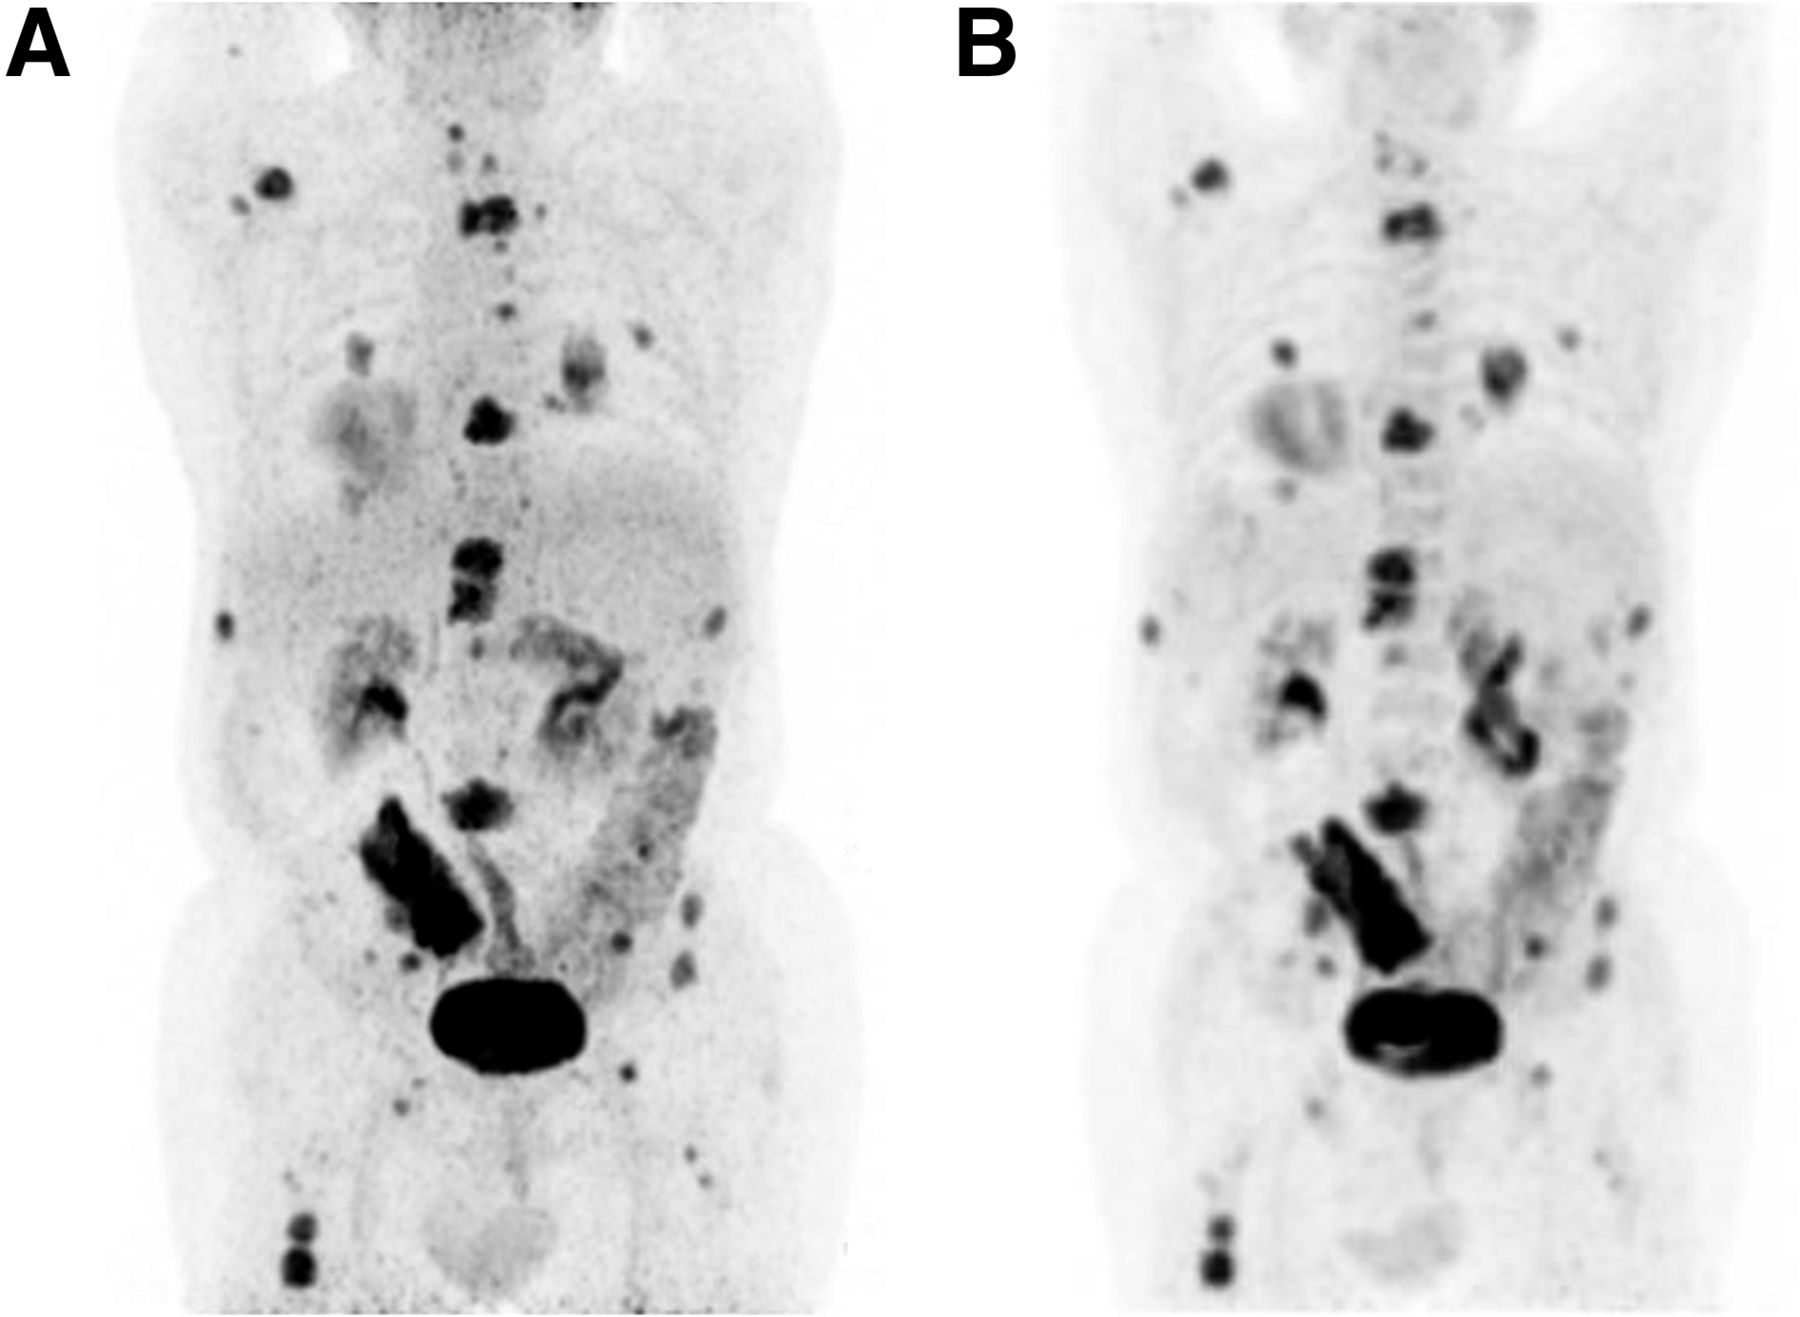
The comparison with a clinical 18F-FDG PET/CT examination showed an improved resolution on the Vereos PET/CT system when compared with the Gemini PET/CT system (Fig. 6).

Maximum-intensity projection of 18F-FDG PET/CT examination of 68-y-old patient. Imaging was performed first on Vereos PET/CT system (at 69 min) (A) and subsequently on Gemini PET/CT system (at 156 min) (B) after injection of 260 MBq of 18F-FDG. Both examinations were performed using clinical standard acquisition parameters: blob ordered-subsets TOF reconstruction using 3 iterations and 33 subsets into a 144 × 144 matrix on Vereos PET/CT system, and ordered-subsets expectation-maximization reconstruction using 2 iterations and 10 subsets into a 288 × 288 matrix on Gemini system. Better image contrast was observed in Vereos images. However, objective comparison of imaging capabilities of the two systems is not possible because of differences in reconstruction protocols as predetermined by acquisition software.
DISCUSSION
Here, we evaluate a clinical installation of the whole-body Vereos PET/CT system according to the NEMA NU2-2012 standard. In general, such performance evaluations provide important knowledge about the imaging system properties and enable a comparison with other imaging systems. Most importantly, they serve as reference values for acceptance testing and routine quality control for the specific system on-site. In general, the investigated Vereos PET/CT system provides a performance that in most aspects is comparable to other state-of-the-art PET/CT systems based on lutetium oxyorthosilicate (LSO) or LYSO scintillators (Tables 1–3). However, some performance parameters differ from previous systems because of the novel detector architecture. These are discussed in the following.
Spatial Resolution
The measured resolution is similar to that of other state-of-the-art systems (Table 1) (8,20) except that the axial resolution of the Vereos PET camera varied less with the radial offset (Table 1). The spatial resolution of a PET system depends on the detector size, the ring diameter (acollinearity), the decoding of the scintillating crystal, the penetration depth of the initial photon, the positron range, and the nonuniform sampling throughout the FOV (sampling error) (21). When compared with other LSO- or LYSO-based whole-body PET systems, the Vereos PET/CT system comes with a 1:1 coupling of the photodetectors to the scintillation crystals, thus eliminating spatial encoding errors. Nonetheless, only the off-center axial resolution showed improved values compared with other systems—an improvement that likely originates from the image reconstruction algorithm used rather than from an improved decoding. For example, the resolution measurements for the Siemens mCT Flow were based on Fourier rebinned data, which affects the axial resolution (20). Therefore, the contribution of an encoding error in whole-body PET/CT systems can be expected to be low (on the order of tenths of a millimeter FWHM). In light of the considerable variability of image reconstruction settings used in clinical practice (22) and their effect on image resolution (23), such an encoding error can be regarded as irrelevant for clinical studies.
Sensitivity
The measured sensitivity of the Vereos PET/CT system was 5.2 cps/kBq and, thus, similar to that of other LYSO-based PET systems with similar detector arrangements (16.2-cm axial FOV and a ring diameter of 742 mm) (Table 2) (24–26). The somewhat higher sensitivity found for systems with similar axial FOVs using LSO as the scintillator of choice can be explained by the larger length or the higher density of the LSO crystals (24–26). For example, the Discovery MI PET/CT system is based on LYSO crystals of 25-mm length (8), which is 32% more than the crystal length in the Vereos PET/CT system (19-mm length).
However, given the TOF capability of the Vereos PET/CT system with a timing resolution of 310 ps, a 4.2 times improved signal-to-noise ratio (SNR) can be expected for an object with a 20-cm diameter (e.g., approximately the diameter of a human head) compared with systems without TOF capability (27). Therefore, the lower sensitivity of the Vereos PET/CT system than of systems with an approximately 20-cm axial FOV and PMT-based detectors is partly compensated by the improved TOF capability. For example, the Vereos PET/CT system is expected to provide approximately the same SNR for a 20-cm-diameter object as the mCT Flow with a sensitivity of 9.6 cps/kBq and a time resolution of 555 ps (20), given a similar injected activity and acquisition time.
Count Rate Performance
The NEC rate (Fig. 3A) is the most relevant parameter for characterizing the count rate performance. In short, it describes the true coincidence count rate that would be needed in an ideal-case scenario (without random and scatter events) to obtain the same SNR as in a real-case scenario for a given activity concentration (28). In other words, the SNR can be improved by using a higher injected activity up to the point where peak NEC rate is reached. Above the peak NEC rate, any further increase in activity will lead to a degradation of SNR due to a prevalence of random events and to the dead time of the system.
The peak NEC rate measured in the Vereos PET/CT system is about 50% higher than for comparable systems with an axial FOV of about 16 cm (Table 3) (8,24) and is found at an activity concentration (55 kBq/mL) about twice as high as in comparable systems. Except for the Vereos PET/CT system, clinical PET systems are based on a block detector design, which typically consists of 5 × 5 cm scintillator crystals coupled to 4 PMTs (20). The decoding of the active scintillator crystal is calculated from the different signal intensities in the PMTs following Anger logic (29). Using such a design, the entire block is set to dead time when scintillation is induced by an arriving photon. In the case of 1:1 coupling (Vereos), only a single crystal is occupied by an event, thus leaving the remaining detectors active. Therefore, the Vereos PET/CT system is able to handle approximately twice the activity concentration within the FOV than other available PET/CT systems, with peak NEC rates occurring at activity concentrations of between 20 and 30 kBq/mL (8,9,20,24,30,31). However, in most clinical standard examinations (e.g., using 18F-FDG), activity concentrations of about 5 kBq/mL are present. Here, the capability of the Vereos PET/CT system to handle high count rates is not expected to provide an advantage over other PET/CT systems. On the contrary, the Vereos PET/CT system could be of value for examinations with isotopes such as 15O, 82Rb, or 13N, for which high activities need to be injected because of their short half-lives. For example, a recent study by Renaud et al. showed that no more than 14.4 MBq/kg body weight of 82Rb-Cl (for a PET system with a peak NEC rate occurring at ∼30 kBq/mL) should be injected for accurate dynamic, quantitative myocardial blood flow imaging (32). This concentration corresponds to 1,152 MBq for a patient of 80 kg. Taking into account the activity concentration at the peak NEC rate of the Vereos PET/CT system, it is expected that up to 2,190 MBq of injected 82Rb-Cl can be handled in this system in a standard patient. However, it is not assumed that such high activities are necessary in clinical practice for sufficient image quality, given the possibility of improving SNR by incorporating TOF information into the reconstruction (27).
Accuracy of Corrections and Image Quality
The measured relative count rate errors are comparable to other systems and show a proper correction of dead-time losses and random events (8,20). The contrast recovery coefficients are typical for state-of-the-art PET systems (8,20), with a notable good recovery of the cold spheres. This is attributed to the timing resolution and, thus, comparably good TOF capability of the PET system, which is known to improve the recovery of cold objects (33). The clinical image quality is demonstrated in Figure 6, showing an improved resolution in the Vereos PET/CT system compared with a Gemini PET/CT system. However, an objective comparison of the imaging capabilities of the two systems is not possible because of the differences in reconstruction settings, which were predetermined by the set protocols in the acquisition software.
Limitations
The clinical installation of the Vereos PET/CT system did not provide a function to export PET raw data. Therefore, the vendor’s NEMA evaluation tools implemented in the Vereos PET/CT system had to be used. Further, the PET raw data would enable additional evaluations, such as assessment of the dependency of the timing resolution on the count rate from the performance measurements (34). Thus, we recommend the implementation of a raw data export function in the standard software.
The comparison of the clinical image quality (Fig. 6) is hampered by the different pixel sizes used for the 2 reconstructions. The protocols implemented in the used systems did not allow a matrix size other than 144 × 144 for the Gemini PET/CT system or below 288 × 288 for the Vereos PET/CT system for a whole-body examination.
CONCLUSION
The whole-body Vereos PET/CT system shows a good overall performance, with a spatial resolution at 4.2–5.5 mm depending on the radial position, and an average sensitivity of 5.2 cps/kBq. With the new detector design based on SiPMs and a 1:1 coupling of the detectors (digital photon counting) and the scintillator crystals, the Vereos PET/CT system provides an excellent TOF resolution of 310 ps and a peak NEC rate of 153 kcps at an activity concentration of as high as 55 kBq/mL.
DISCLOSURE
No potential conflict of interest relevant to this article was reported.
Acknowledgments
We thank Sandra Maymó and Albert Salip for their help with preparing the radioisotopes and Hunor Kertesz for his help during the revision of the manuscript. Further, we thank Fernando Fernández and Carles Macian for their help with the acquisition protocols and with operating the PET/CT system.
Footnotes
Published online Oct. 25, 2018.
- © 2019 by the Society of Nuclear Medicine and Molecular Imaging.
REFERENCES
- Received for publication June 4, 2018.
- Accepted for publication September 17, 2018.


Jump to section
Related Articles
Cited By...
- Performance Characteristics of a New Generation 148-cm Axial Field-of-View uMI Panorama GS PET/CT System with Extended NEMA NU 2-2018 and EARL Standards
- SNMMI Procedure Standard/EANM Practice Guideline for Brain [18F]FDG PET Imaging, Version 2.0
- Performance Characteristics of a New-Generation Digital Bismuth Germanium Oxide PET/CT System, Omni Legend 32, According to NEMA NU 2-2018 Standards
- Long Versus Short Axial Field of View Immuno-PET/CT: Semiquantitative Evaluation for 89Zr-Trastuzumab
- High-Resolution Silicon Photomultiplier Time-of-Flight Dedicated Head PET System for Clinical Brain Studies
- Continuous Bed Motion in a Silicon Photomultiplier-Based Scanner Provides Equivalent Spatial Resolution and Image Quality in Whole-Body PET Images at Similar Acquisition Times Using the Step-and-Shoot Method
- Performance Evaluation of the uEXPLORER Total-Body PET/CT Scanner Based on NEMA NU 2-2018 with Additional Tests to Characterize PET Scanners with a Long Axial Field of View
- Performance of Digital PET Compared with High-Resolution Conventional PET in Patients with Cancer
- Image Quality and Activity Optimization in Oncologic 18F-FDG PET Using the Digital Biograph Vision PET/CT System
- PennPET Explorer: Design and Preliminary Performance of a Whole-Body Imager
- Image Quality and Semiquantitative Measurements on the Biograph Vision PET/CT System: Initial Experiences and Comparison with the Biograph mCT
- PennPET Explorer: Human Imaging on a Whole-Body Imager
- Performance Evaluation of a High-Resolution Nonhuman Primate PET/CT System
- Limits for Reduction of Acquisition Time and Administered Activity in 18F-FDG PET Studies of Alzheimer Dementia and Frontotemporal Dementia