


Abstract
Dosimetric calculations are performed with an increasing frequency before or after treatment in targeted radionuclide therapy, as well as for radiation protection purposes in diagnostic nuclear medicine. According to the MIRD committee formalism, the mean absorbed dose to a target is given by the product of the cumulated activity and a dose-conversion factor, known as the S factor. Standard S factors have been published for mathematic phantoms and for unit-density spheres. The accuracy of the results from the use of these S factors is questionable, because patient morphology can vary significantly. The aim of this work was to investigate differences between patient-specific dosimetric results obtained using Monte Carlo methodology and results obtained using S factors calculated on standard models. Methods: The CT images of 9 patients, who ranged in size, were used. Patient-specific S factors for 131I were calculated with the MCNPX2.5.0 Monte Carlo code using a tool for personalized internal dose assessment, OEDIPE; standard S factors from OLINDA/EXM were compared against the patient-specific S factors. Furthermore, realistic biodistributions and cumulated activities for normal organs and tumors were used, and mean organ- and tumor-absorbed doses calculated with OEDIPE and OLINDA/EXM were compared. Results: The ratio of the standard and the patient-specific S factors were between 0.49 and 1.84 for a target distant from the source for 4 organs and 2 tumors studied as source and targets. For the case of self-irradiation, the equivalent ratio ranged between 0.45 and 2.47 and between 1.00 and 1.06 when mass correction was applied. Differences in mean absorbed doses were as high as 140% when realistic cumulated activity values were used. These values decreased to less than 26% in all cases studied when mass correction was applied to the self-irradiation given by OLINDA/EXM. Conclusion: Standard S factors can yield mean absorbed doses for normal organs or tumors with a reasonable accuracy (26% for the cases studied) as compared with absorbed doses calculated with Monte Carlo, provided that they have been corrected for mass.
Dosimetric calculations are performed in diagnostic nuclear medicine for radiation protection purposes, but they are also performed with increasing frequency in targeted radionuclide therapy (TRT). The aim of these calculations is to assess the energy delivered to normal and malignant tissues from a targeted agent and to relate it to the treatment outcome, such as the toxicity to normal organs or tissue. However, widespread variability exists in published dosimetric results, which could be attributed to a lack of accuracy, a lack of standardization in the methodology used by different centers, patient variability, or a combination of these factors.
Dosimetric calculations are based on the MIRD committee formalism (1) described by Equation 1. Eq. 1
Eq. 1
In Equation 1,  (Gy) is the mean absorbed dose delivered to the target k,
  (Bq·s) is the cumulated activity in the source h, and
  (Gy·Bq−1·s−1) is the mean absorbed dose delivered to the target k per unit cumulated activity in the source h, commonly referred to as the S factor. The cumulated activity is the integral of the time–activity curve for the source volume, the total number of decays that occur in the source, and it is usually obtained from scintigraphic imaging. The cumulated activity calculation requires quantitative imaging for the absolute determination of activity uptake with time, and hence accuracy is dependent on the magnitude of the quantification errors and uncertainties related to the determination of the biokinetics. This work focused on the impact of S factor assessment on absorbed dose calculations. Cumulated activity has been assumed as either 1 or a fixed value.
The S factor is given by Equation 2. Eq. 2where
  is the mean energy emitted per particle of type
  radiation and
  is the number of particles of radiation
  per nuclear transition.
  is the absorbed fraction expressing how much of the emitted energy is absorbed by the target. The S factor depends on the physical properties of the radioisotope—in addition to the geometry (shape and relative position) and density of the source and target regions—and on the intermediate tissues. If the source and target are the same, the S factor reflects the dose delivered from self-irradiation (
 ) and will be referred to as self S factor; if the source and target are different, the S factor will be referred to as cross S factor (
 ).
).
The most commonly used approach for patient dosimetry when the mean absorbed dose to an organ or tumor is of interest is to use standard S factors calculated for standard models (2,3). If the source and the target are the same, a given value calculated on a standard model can be scaled to account for differences in mass according to Equation 3 (4). Eq. 3
Eq. 3
In Equation 3,  and
and  are the self S factors for the patient and the standard model, respectively, and
  and
and  are the organ masses for the patient and the standard model, respectively. The importance of this 1/mh correction has been discussed in the past (5); 1/mh corrects for the electron energy deposition under the assumption that no electron escapes from the source. The proposed correction factor from the γ-rays if the source and the target are the same is 1/mh2/3 (4); however, this factor is negligible as a first-order correction as most of the γ-rays escape the source. S factors representing cross-irradiation mainly account for γ-irradiation of targets distant from the source, and correcting them is a complex problem related largely to the geometry. At present, there is no solution to the problem, as has been discussed by Petoussi-Hens et al. (6).
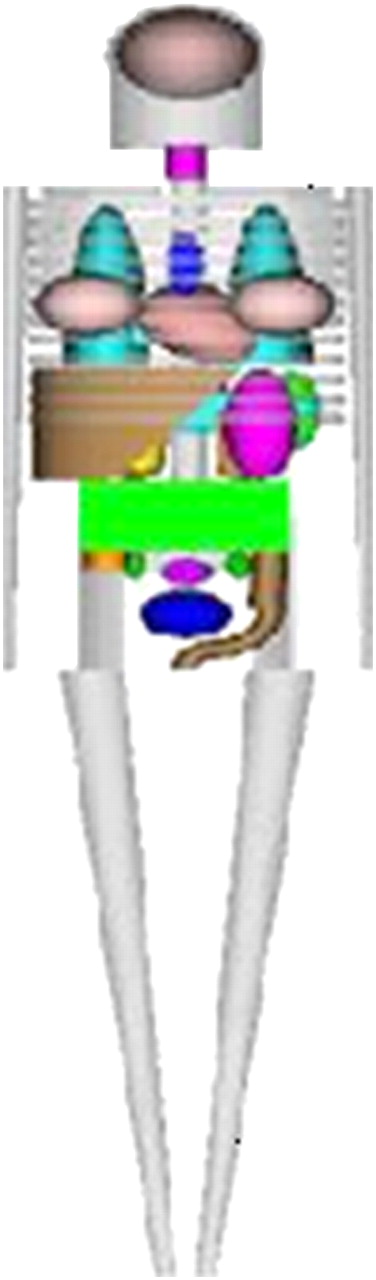
The software OLINDA/EXM (7) is often used for dosimetric calculations. OLINDA/EXM provides S factors for over 800 radioelements calculated via the Monte Carlo method, using standard models for 10 whole-body phantoms representing reference adults, children, and pregnant women. The Oak Ridge National Laboratories (ORNL) mathematic phantom shown in Figure 1 is the model for the adult man used by OLINDA/EXM. The 1/mh and 1/mh2/3 corrections have been implemented in OLINDA/EXM. For tumor dosimetry, a sphere model is used by OLINDA/EXM, which assumes that tumors are isolated unit-density spheres and have a uniform activity distribution. Any cross dose from a tumor to an organ or from an organ to a tumor is not provided by OLINDA/EXM. The precalculated S factors incorporated into OLINDA/EXM are accurate, but the models they refer to are simplistic. Furthermore, patient morphology varies substantially, and the application of reference S factors can potentially be a source of large error (8). These concerns were the motivation of this work.

ORNL reference adult male mathematic phantom. Image was obtained from http://www.doseinfo-radar.com/RADARphan.html (accessed July 8, 2008).
An alternative approach to dosimetric calculations is to use convolution of the cumulated activity distribution with a dose point kernel (DPK). DPKs correspond to the energy deposited at a distance from a point source in spheric shells (9) and can be calculated analytically or more often using Monte Carlo methods (10). The convolution approach is fast and takes into account the geometry of a given patient (11–13). However, this approach is prone to errors if applied to varying tissue densities, as DPKs are calculated for particles propagating in uniform medium, usually assumed to be water or soft tissue. A quantitative analysis of the impact of this assumption remains to be performed.
Patient-specific Monte Carlo–based dosimetric methodologies have been investigated by several groups (14–17). These methods have been proposed as being the most accurate, incorporating minimal assumptions because S factors can be calculated for each patient, taking into account both the morphology of the radionuclide and its physical properties. The anatomy, composition, and density of tissues can be obtained by CT; 1 or more sources can be defined; and the energy deposited in a volume can be recorded by simulating interactions of all emitted particles with matter using Monte Carlo techniques (18). However, Monte Carlo–based dosimetry is still limited to the research domain because of the high burden in computational power, time, and human resources required. For this reason, optimization of the use of these techniques is desirable.
A user-friendly interface tool called OEDIPE, dedicated to patient-specific dosimetry with the Monte Carlo method, has been developed and evaluated by our group (19,20). OEDIPE segments CT scans, assigns density values to the identified organs, and creates input files for the MCNPX2.5.0 code (21). After the calculations, OEDIPE recovers the output files and produces tables of mean absorbed doses in the defined organs. OEDIPE can also calculate absorbed doses at the voxel level, but this feature was beyond the scope of the current study. The Monte Carlo approach is especially relevant when studying radioisotopes that emit penetrating radiation, which travel through a medium and deposit energy at a distance from the source targets. Such is the case with 131I, a commonly used radioisotope in TRT that emits a significant amount of γ-rays (primary photopeak at 364 keV, with 81% abundance).
Standard S factors for 131I obtained with OLINDA/EXM were compared against patient-specific S factors obtained with OEDIPE for 9 patients. Furthermore, realistic cumulated activity values were considered, and mean organ- and tumor-absorbed doses calculated with OEDIPE and with OLINDA/EXM were compared. The significance of cross-irradiation to the liver was studied by altering the cumulated activity to the lungs and the pulmonary tumor. Finally, possible errors from compromising the density but not the geometry were addressed.
MATERIALS AND METHODS
Patient Data
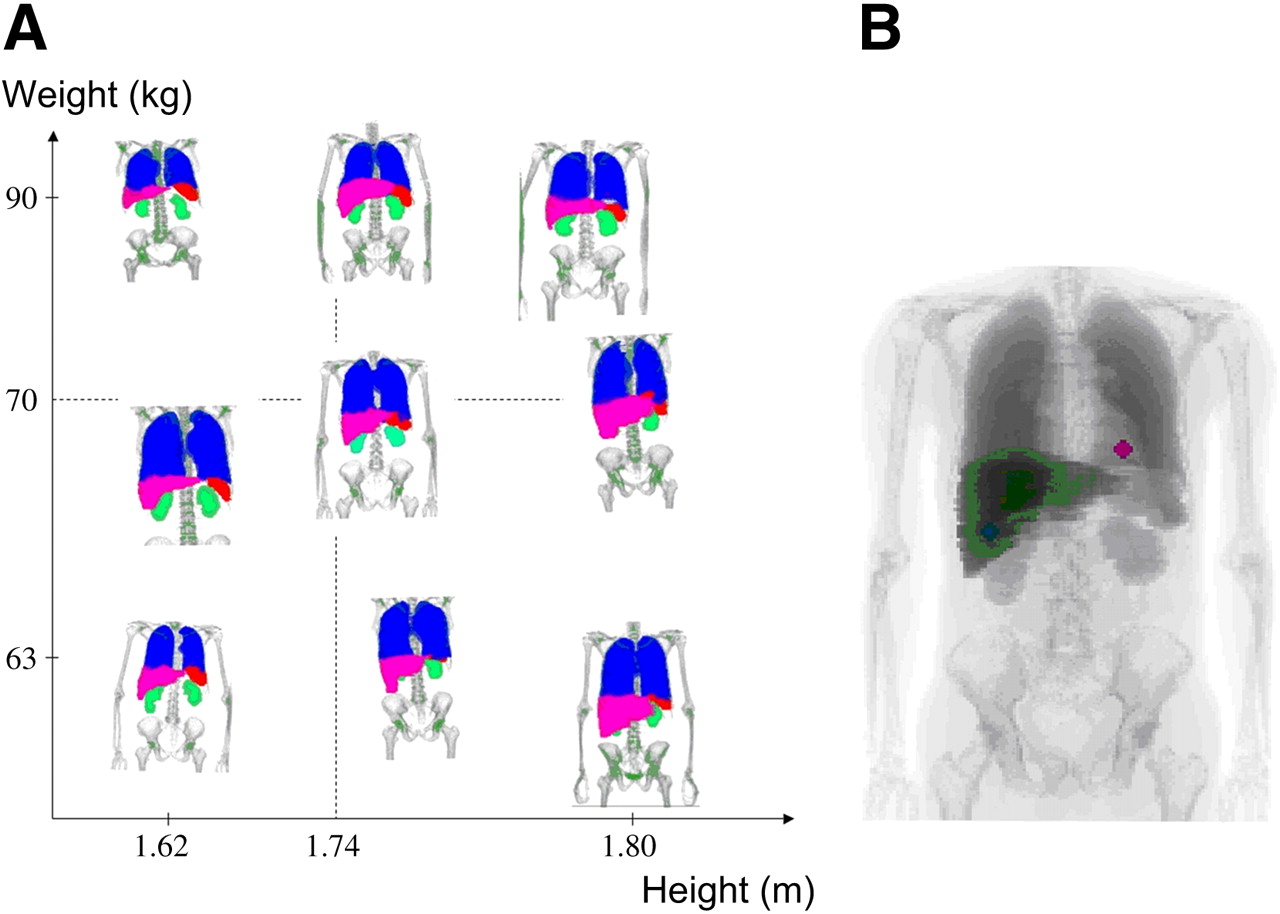
The CT images of 9 patients (P1–P9) used in this study were obtained with the Discovery LS PET/CT scanner (GE Healthcare). The CT scans were obtained with the standard protocol of operating this dual scanner for attenuation-correction purposes and were chosen from the available database (i.e., were not obtained specifically for this study). All subjects were men selected according to their height and weight, to cover a range of sizes (from 162 to 180 cm in height and from 59 to 90 kg in mass); the patient characteristics are listed in Table 1. The CT scans were segmented automatically by OEDIPE on the basis of the Hounsfield units for air, lung, and bone; manual segmentation was performed for the liver, kidneys, and spleen on the basis of external contours. The resulting images were 128 × 128 in the transaxial plane, with a voxel size of 3.9 × 3.9 × 5 mm. Additionally, 2 spheric tumors (mass, 7 g each) were artificially placed in the liver and the lower part of the left lung of each patient. Figure 2A shows coronal slices of the geometric representation of the 9 patients.

(A) Coronal slices through segmented images for 9 patients studied shown in order of increasing height and weight. (B) Coronal slice through patient indicating 2 spheric lesions. Position of lesions was kept as close as possible for all patients.
Details of 9 Patients and Mathematic Phantom ORNL
S Factor Calculations
Input files for the MCNPX2.5.0 Monte Carlo code were created with OEDIPE for all patients. Tissue densities were assigned according to the International Commission on Radiation Units and Measurements (ICRU) report 44 (22) (1.92 g cm−3 for bone, 0.26 g cm−3 for lung, 1.06 g cm−3 for liver and spleen, and 1.05 g cm−3 for soft tissue, kidneys, and tumors). Each organ and tumor was considered in turn as a source of homogeneously distributed activity of 131I. All radiation emissions for 131I (γ, e−, and β) as listed in International Commission on Radiological Protection publication 38 (23) were included, and the energy deposited in each organ was recorded. The statistical uncertainty of the results was below 8% for all cases.
Standard S factors for 131I were obtained from OLINDA/EXM for the adult male model. The self S factors were adjusted for each patient to account for differences in organ mass between the model and the patient by invoking the mass-correction algorithm provided by OLINDA/EXM.
Mean Absorbed Doses Based on Realistic Cumulated Activity Values
The impact of S factors on the total absorbed dose was put in perspective by considering a biodistribution of the radiopharmaceutical. As the patients chosen for this study were selected according to their height and weight and were not undergoing 131I therapy, published biodistribution data were obtained on the basis of a 131I-labeled antibody for the treatment of non-Hodgkin lymphoma (24). Cumulated activity concentrations were derived from the reported doses to lungs, kidneys, liver, spleen, and tumors and used to assign cumulated activities to the organs and tumors of each patient. This study was used only to derive the biodistributions, and the results presented here do not relate to the findings of Rizziery et al. (24).
Organ and tumor doses were calculated in the following 3 ways: by using the patient-specific S factors calculated with OEDIPE, using the standard self and cross S factors obtained by OLINDA/EXM, and using the latter with mass correction for the self S factors.
To study the cross-irradiation to the liver, 5 more hypothetical biodistributions were generated by gradually increasing the cumulated activity concentration in the lungs and in the hepatic tumor (by factors of 2, 4, 8, 16, and 32). Table 2 lists the cumulated activity concentrations for the source organs and tumors considered. Biodistribution A was derived from Rizzieri et al. (24), and B–F were obtained by the multiplication of the lung and hepatic tumor cumulated activity concentrations as explained above.
Cumulated Activity Concentrations
For patient P1, absorbed doses were calculated using OEDIPE by assuming a density of water for all tissues and were compared with absorbed doses obtained with OEDIPE with the realistic density of the tissues. Because geometry and calculation methods were kept identical, any differences would reflect the impact of the homogeneous medium hypothesis used implicitly in DPK convolution.
In all cases, the doses calculated by OLINDA/EXM were compared against the patient-specific doses obtained with OEDIPE, and the percentage difference was calculated as ((DOEDIPE − DOLINDA/EXM)/DOEDIPE) × 100%.
RESULTS
Patient Morphology
Table 1 lists the patient characteristics and the organ masses as calculated from the CT images for the 9 patients and the ORNL phantom. The table shows that the organ masses vary greatly among patients and phantom, with no correlation to height or weight. For example, the height and weight for patient P1 were close to those for the ORNL phantom, but the organ masses were different. This result is obvious but is often ignored when dosimetric results, especially for radiation-protection studies, are obtained using directly the reference man.
Comparison of S Factors
The ratio of the standard self S factors over the patient-specific values ranged from 0.45 up to 2.47. The same ratio ranged from 1.00 to 1.06 when the standard S factors were corrected for mass.
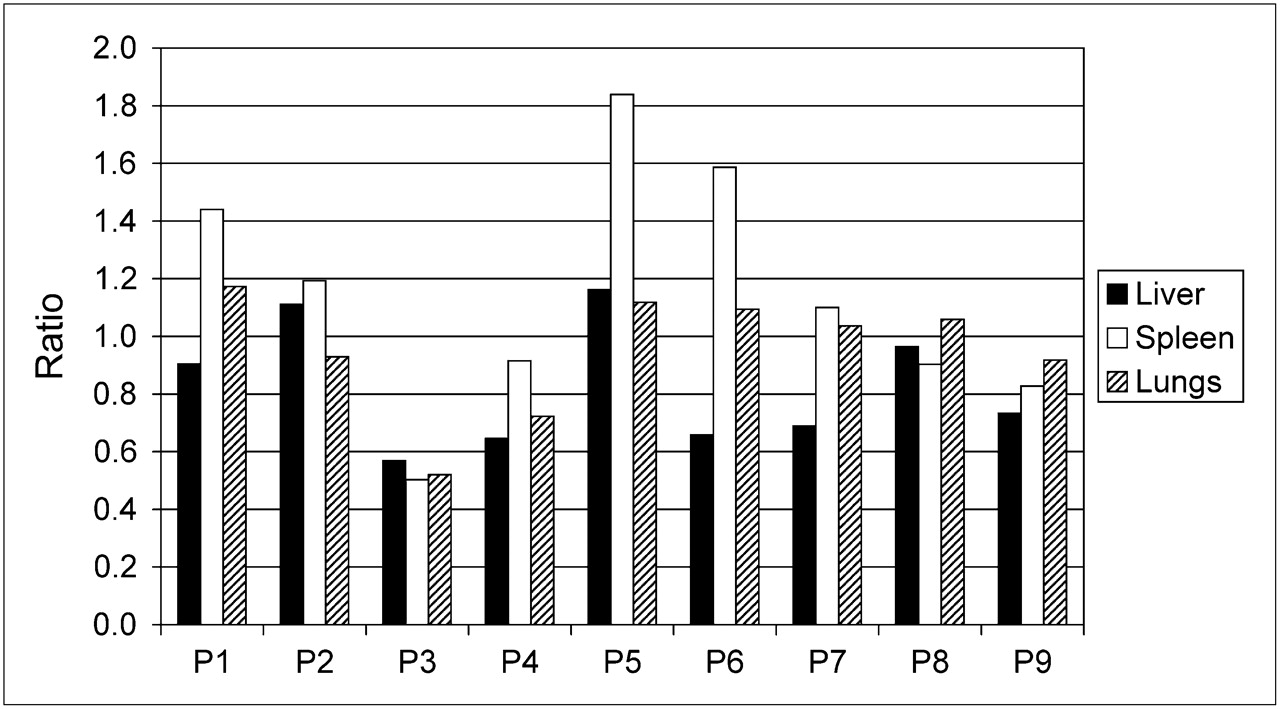
The ratio of the standard over the patient-specific cross S factors was between 0.49 and 1.84. Figure 3 shows a plot of the ratio of standard over patient-specific S factors with the source being the kidneys and the target the liver, spleen, and lungs. These ratios show that the difference of standard versus patient-specific values can be large, demonstrating interpatient variation for a given source–target pair and variation for different source–target combinations for any given patient.

Ratio (SOLINDA/EXM/SOEDIPE) of cross S factors from source kidneys to targets (liver, spleen, and lungs).
Table 3 lists standard and patient-specific S factors for patient P1 when the self S factors have been mass-corrected. The contributions of cross-irradiation to the total dose per unit cumulated activity for patient P1 were 0.2% for the hepatic and lung tumors and were 18%, 6%, 8%, and 31% for the lungs, spleen, kidneys, and liver, respectively. These figures were obtained with the Monte Carlo calculations and indicate that the dominant contribution to the total dose per unit cumulated activity is the self-irradiation.
OLINDA/EXM and Patient-Specific 131I S Factors (mGy·MBq−1·s−1) Calculated with MCNPX2.5.0 for Patient P1
Mean Absorbed Doses Based on Realistic Cumulated Activity Values
Table 4 lists differences in the calculated organ doses by OLINDA/EXM against the patient-specific doses when no mass correction was applied and when mass correction was performed to self-irradiating organs.
Percentage Difference in Organ Doses Calculated with OLINDA/EXM from Doses Calculated with OEDIPE
Differences between tumor doses calculated using the sphere model, which takes into account only the self-irradiation, and those calculated using OEDIPE, which takes into account both self- and cross-irradiation, were between 1.4% and 4.4%.
Table 5 shows the percentage contribution to the liver dose from the lungs and from the hepatic tumor for all 6 biodistributions studied for patient P1. In the same table, the total dose to the liver for the 6 biodistributions for patient P1 as calculated using OEDIPE and OLINDA/EXM is shown. The OLINDA/EXM calculations incorporate the mass correction for the self-irradiation of the liver, but for the cross-irradiation the standard cross S factors for the reference man were used. The percentage differences between the liver doses calculated using OLINDA/EXM and OEDIPE for all 6 biodistributions studied and for all patients are shown in Table 6.
Cross-Irradiation Contribution from Lungs and Hepatic Tumor to Total Liver Dose for 6 Biodistributions Studied for Patient P1
Percentage Difference of Liver Doses Calculated Using OLINDA/EXM* and OEDIPE for Biodistributions A–F
Figure 4 shows the difference in the dose to organs and tumors when adopting soft-tissue densities as given in ICRU report 44 (22), compared with the assumption that all soft tissue has a density equal to water. Biodistributions A–F were investigated for patient P1. The differences did not change significantly between biodistributions, and there was approximately a 60% error in the dose to the lungs and less than 20% error to the other organs.
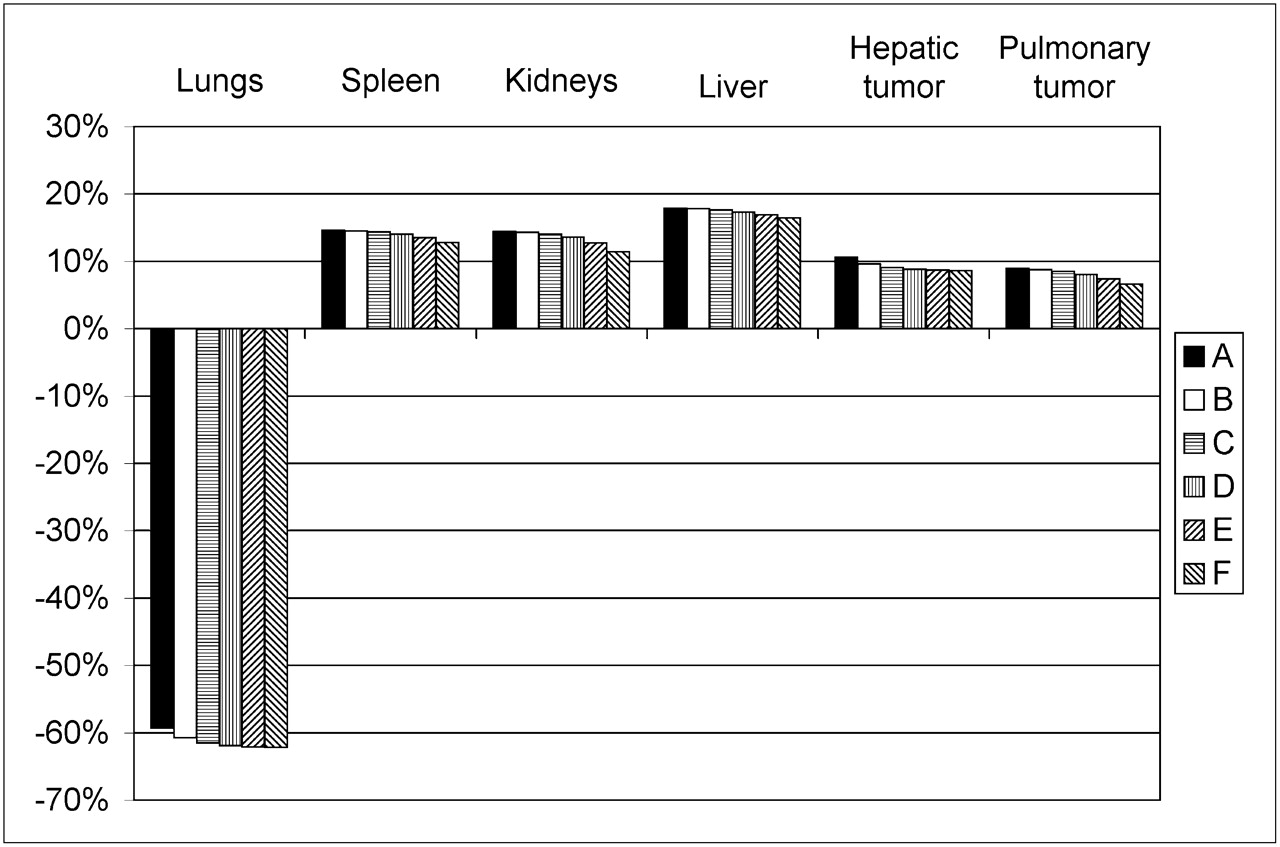
For patient P1 and for 6 biodistributions studied (A–F; Table 2), error to doses when density of 1 g cm−3 was used for all tissues, compared with doses obtained with densities from ICRU report 44.
DISCUSSION
The objective of this study was to compare patient-specific dosimetric results with results obtained using precalculated S factors based on standard models. The motivation behind the study was that the mathematic models are simplistic but also that patients vary significantly. The CT scans of 9 patients, covering a wide range of height and weight, were used. As shown in Table 1 and Figure 2, the segmented CT scans exhibited wide variations in the patient morphology.
At first, the comparison was performed on the S factors and then on the absorbed dose, using cumulated activity values to address both parts of Equation 1. The large differences observed between the patient-specific and standard self S factors were minimized with mass corrections. The self-irradiation is mainly attributed to local absorption of the energy deposited by the β-particles. The 1/mh scaling for the differences in mass between the organs of the standard model and of the patient was adequate, but the 1/mh2/3 correction was also included in our calculations for completion as both corrections are implemented in OLINDA/EXM automatically.
However, significant differences between the patient-specific and the standard cross S factors cannot be accounted for. Table 3 shows an example of the patient-specific and standard S factors for patient P1. This patient was of particular interest, because his height and weight were close to those of the ORNL phantom; however, the cross S factors vary greatly between the patient and the model. Figure 3 plots ratios of standard to patient-specific cross S factors for all 9 patients. These ratios vary between patients and between different source–target pairs for a given patient. However, self-irradiation is the dominant contribution to the total dose per unit of cumulated activity. For patient P1, as shown from the Monte Carlo study, the only organ that received significant cross-irradiation per unit of cumulated activity was the liver, with 31% contribution from distant sources. This cross dose originated mainly from the hepatic tumor (21%), with only a 2% contribution from the lungs.
Cumulated activity values were used to investigate how differences in S factors would be reflected in absorbed doses to organs. Table 4 shows large differences between calculated doses with OLINDA/EXM and with OEDIPE when mass correction was omitted. These differences decreased dramatically with mass correction of the self-irradiation despite cross-irradiation calculations being based on substantially different dose conversion factors between the 2 calculation methods. The main contribution to the dose comes from the self-irradiation, and because mass correction is adequate for OLINDA/EXM self S factors, the resulting doses were at an acceptable level of accuracy as compared with the patient-specific doses calculated with OEDIPE. The differences between tumor doses calculated using the sphere model with OLINDA/EXM and tumor doses calculated with OEDIPE (accounting for all sources simultaneously) were less than 5%, indicating that the sphere model could lead to accurate results for tumor dosimetry. However, this result is related to the small volumes of the spheric tumors studied; larger tumors would have a larger probability of receiving cross-irradiation, and the sphere model does not take cross-irradiation into account (which could underestimate the tumor doses). The accuracy of the sphere model for tumor dosimetry as a function of tumor size, shape, density, and location should be studied in detail as part of future work.
When cumulated activity values were used, the hepatic tumor itself was a negligible source of cross dose to the liver. The lungs, however, were a significant source as shown in Table 5. In the same table, it is shown that the liver dose as calculated by OLINDA/EXM was underestimated for patient P1, but overestimation was observed for other patients. Table 6 shows the comparison results for all patients. The possible biodistributions that can be observed among patients in general are broad. Still, our results give an indication of the magnitude of the errors to be expected, and it was shown that these errors were less than 26% in all cases studied. If one considers that the uncertainty in the calculation of the cumulated activity has been estimated to be much greater than 26% (8) and that the produced biodistribution F (which indicated this large error) is an extreme case of cross-irradiation, the level of accuracy obtained with OLINDA/EXM can be considered acceptable.
The effect of considering the morphology of the patient but not the realistic tissue density was studied by calculating doses for patient P1 for the 6 biodistributions, assuming the density of all organs and tumors to be equal to water. The errors to the doses to all organs except for the lungs were less than 20% and were not sensitive to the change in biodistributions (Fig. 4). Lung dose errors were between 59% and 62% because of their significantly lower density than that of water. The results of this study are relevant to convolution-based methods that use the actual patient morphology but are performed with point kernels calculated in water. Results from convolution methods would be relatively accurate for the abdominal region but prone to large errors for the thoracic area.
This study was based on 131I, but the results would apply to TRT with β-emitters of similar maximum energy (Eβmax = 0.6 MeV) that also emit γ-rays. For pure β-emitters, the cross-irradiation to distant targets is negligible; for example, for the pure β-emitter 90Y (Eβmax = 2.2 MeV) there would be no irradiation (e.g., from the liver to the kidneys). Liu et al. (25) compared MIRD and patient-specific organ doses based on convolution for 90Y for several organs and reported agreement within 15% if adjustment for mass was used. The energy of the emitted β-particles from 90Y is significantly higher than that from 131I, and the β-particles can travel through greater distances in matter. A cross dose from, for example, a pulmonary tumor to the lung or a hepatic tumor to the liver can be significant, and it is ignored in the sphere model.
In this work, the activity uptake was assumed uniform; however, heterogeneous uptake is often observed. Patient-specific dosimetry would be the only way to derive spatial dose distributions and to take into account heterogeneous uptake of activity in an organ or tumor. The conclusions drawn in this work refer to mean absorbed doses to normal organs or tumors from uniform activity distributions.
CONCLUSION
When the mean absorbed dose to a normal organ or tumor is of interest, reference S factors can lead to accurate results within 26% for the cases studied, if mass scaling is performed, compared with patient-specific results obtained with the Monte Carlo method. The realistic tissue density, if ignored, can lead to errors greater than 60% for the thorax but to less than 20% for the other regions.
Acknowledgments
This work was supported by the National Translational Cancer Research Network grant C21768/A7021, funded jointly by the Department of Health, U.K., and the Institute National de Cancer, France, and managed by Cancer Research U.K. Jacques Barbet, Glenn D. Flux, and Manuel Bardiés are members of the European Cooperation in the field of Scientific and Technical Research, Action BM0607.
Footnotes
-
COPYRIGHT © 2009 by the Society of Nuclear Medicine, Inc.
References
- Received for publication September 5, 2008.
- Accepted for publication October 21, 2008.


