
Main menu

  • Home
  • Content
    • Current
    • Ahead of print
    • Past Issues
    • JNM Supplement
    • SNMMI Annual Meeting Abstracts
    • Continuing Education
    • JNM Podcasts
  • Subscriptions
    • Subscribers
    • Institutional and Non-member
    • Rates
    • Journal Claims
    • Corporate & Special Sales
  • Authors
    • Submit to JNM
    • Information for Authors
    • Assignment of Copyright
    • AQARA requirements
  • Info
    • Reviewers
    • Permissions
    • Advertisers
  • About
    • About Us
    • Editorial Board
    • Contact Information
  • More
    • Alerts
    • Feedback
    • Help
    • SNMMI Journals
  • SNMMI
    • JNM
    • JNMT
    • SNMMI Journals
    • SNMMI

User menu

  • Subscribe
  • My alerts
  • Log in
  • My Cart

Search

  • Advanced search
Journal of Nuclear Medicine
  • SNMMI
    • JNM
    • JNMT
    • SNMMI Journals
    • SNMMI
  • Subscribe
  • My alerts
  • Log in
  • My Cart
Journal of Nuclear Medicine

Advanced Search

  • Home
  • Content
    • Current
    • Ahead of print
    • Past Issues
    • JNM Supplement
    • SNMMI Annual Meeting Abstracts
    • Continuing Education
    • JNM Podcasts
  • Subscriptions
    • Subscribers
    • Institutional and Non-member
    • Rates
    • Journal Claims
    • Corporate & Special Sales
  • Authors
    • Submit to JNM
    • Information for Authors
    • Assignment of Copyright
    • AQARA requirements
  • Info
    • Reviewers
    • Permissions
    • Advertisers
  • About
    • About Us
    • Editorial Board
    • Contact Information
  • More
    • Alerts
    • Feedback
    • Help
    • SNMMI Journals
  • View or Listen to JNM Podcast
  • Visit JNM on Facebook
  • Join JNM on LinkedIn
  • Follow JNM on Twitter
  • Subscribe to our RSS feeds
OtherBASIC SCIENCE INVESTIGATIONS

Effect of Patient Morphology on Dosimetric Calculations for Internal Irradiation as Assessed by Comparisons of Monte Carlo Versus Conventional Methodologies

Antigoni Divoli, Sophie Chiavassa, Ludovic Ferrer, Jacques Barbet, Glenn D Flux and Manuel Bardiès
Journal of Nuclear Medicine February 2009, 50 (2) 316-323; DOI: https://doi.org/10.2967/jnumed.108.056705
Antigoni Divoli
  • Find this author on Google Scholar
  • Find this author on PubMed
  • Search for this author on this site
Sophie Chiavassa
  • Find this author on Google Scholar
  • Find this author on PubMed
  • Search for this author on this site
Ludovic Ferrer
  • Find this author on Google Scholar
  • Find this author on PubMed
  • Search for this author on this site
Jacques Barbet
  • Find this author on Google Scholar
  • Find this author on PubMed
  • Search for this author on this site
Glenn D Flux
  • Find this author on Google Scholar
  • Find this author on PubMed
  • Search for this author on this site
Manuel Bardiès
  • Find this author on Google Scholar
  • Find this author on PubMed
  • Search for this author on this site
  • Article
  • Figures & Data
  • Info & Metrics
  • PDF
Loading

Article Figures & Data

Figures

  • Tables
  • FIGURE 1. 
    • Download figure
    • Open in new tab
    • Download powerpoint
    FIGURE 1. 

    ORNL reference adult male mathematic phantom. Image was obtained from http://www.doseinfo-radar.com/RADARphan.html (accessed July 8, 2008).

  • FIGURE 2. 
    • Download figure
    • Open in new tab
    • Download powerpoint
    FIGURE 2. 

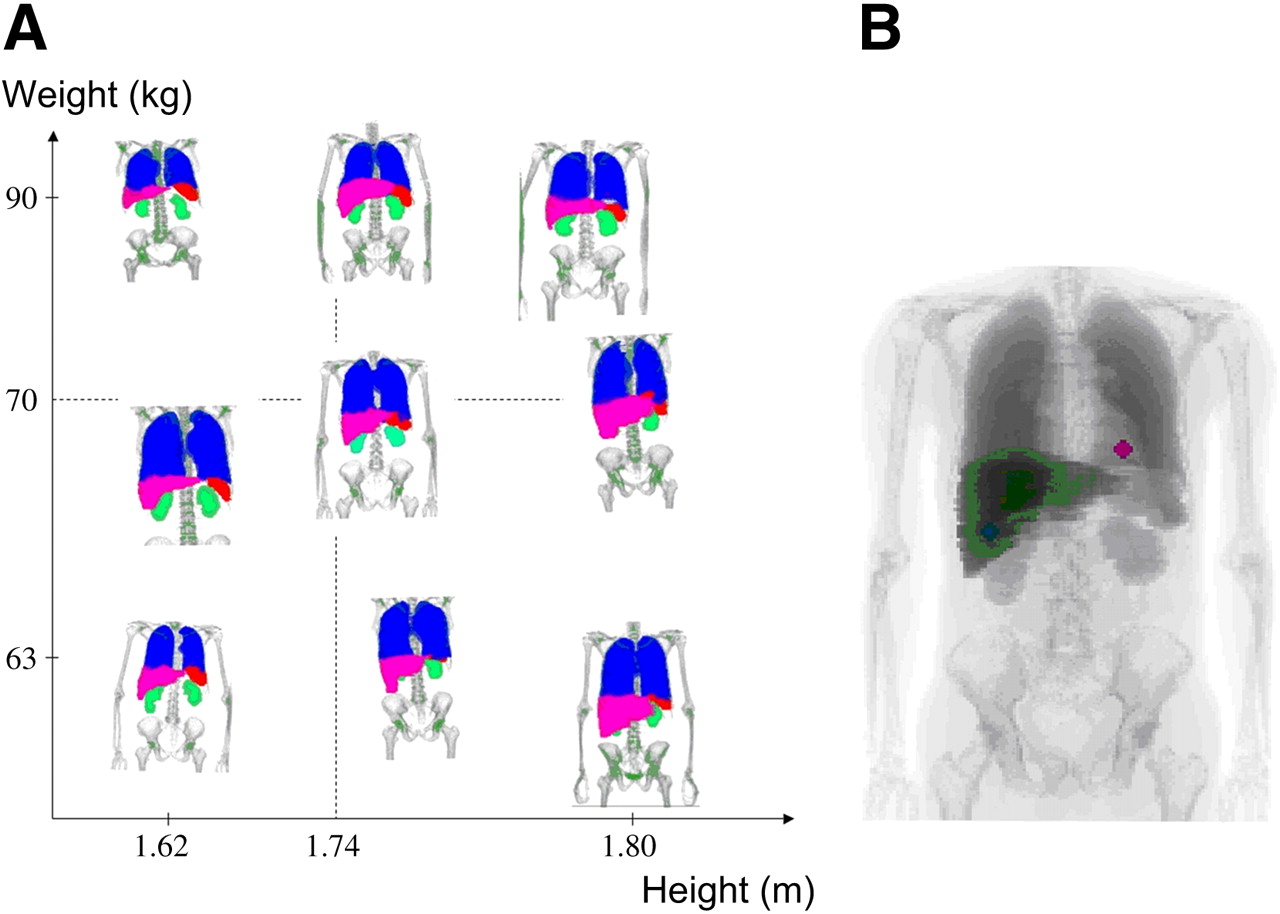
    (A) Coronal slices through segmented images for 9 patients studied shown in order of increasing height and weight. (B) Coronal slice through patient indicating 2 spheric lesions. Position of lesions was kept as close as possible for all patients.
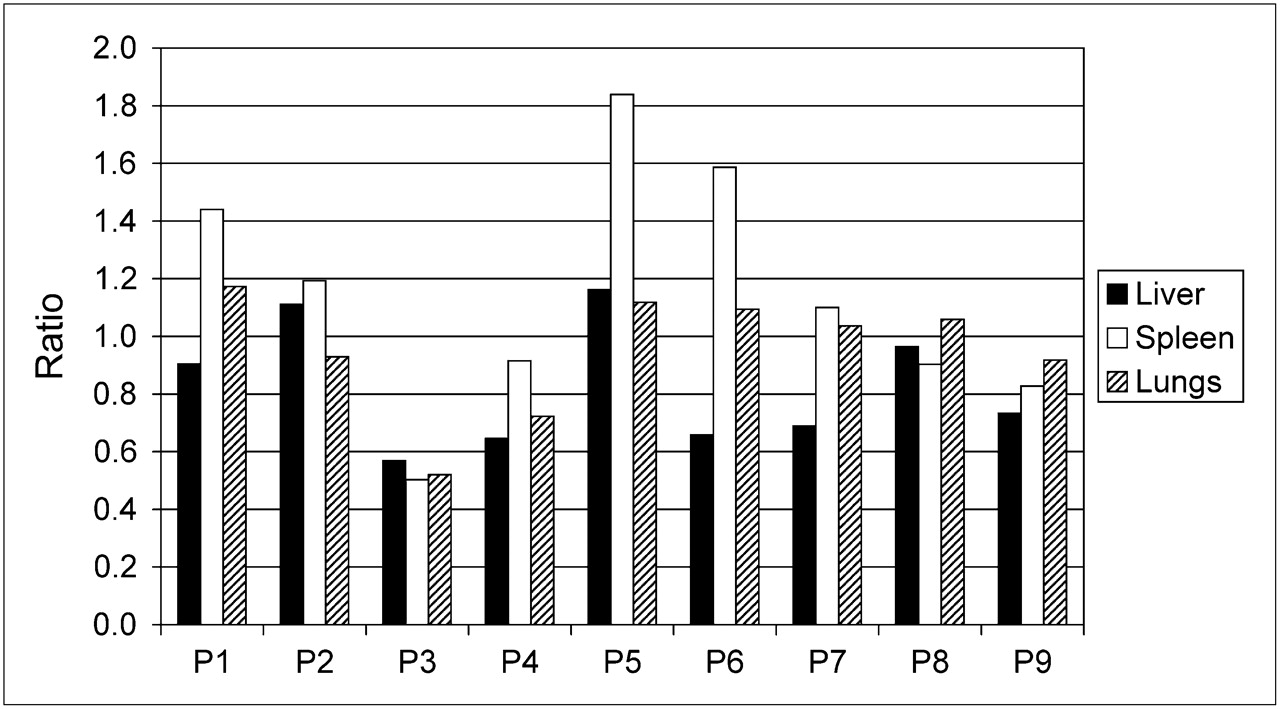
  • FIGURE 3. 
    • Download figure
    • Open in new tab
    • Download powerpoint
    FIGURE 3. 

    Ratio (SOLINDA/EXM/SOEDIPE) of cross S factors from source kidneys to targets (liver, spleen, and lungs).

  • FIGURE 4. 
    • Download figure
    • Open in new tab
    • Download powerpoint
    FIGURE 4. 

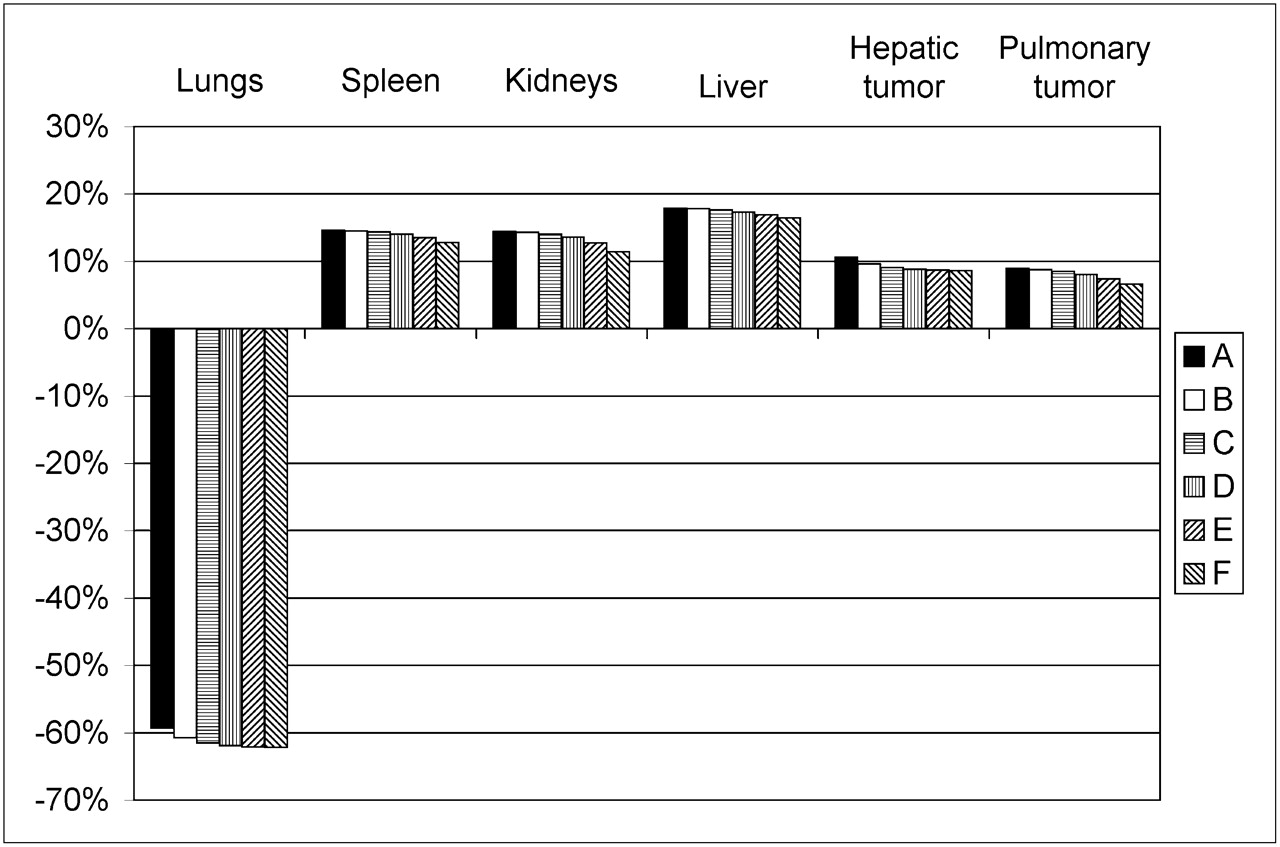
    For patient P1 and for 6 biodistributions studied (A–F; Table 2), error to doses when density of 1 g cm−3 was used for all tissues, compared with doses obtained with densities from ICRU report 44.

Tables

  • Figures
    • View popup
    TABLE 1

    Details of 9 Patients and Mathematic Phantom ORNL

    Age (y)Weight (kg)Height (m)Organ mass (g)
    SubjectLungsSpleenKidneysLiver
    ORNLNA701.741,0001832991,910
     P145681.751,5404656112,408
     P254901.751,8154386973,104
     P352631.761,6007745301,809
     P466661.631,2261454211,319
     P576901.621,0804425281,707
     P657611.627552615961659
     P741701.801,2303507132,685
     P843871.7810672147462361
     P938591.801,5201805642,700
    Mean*52.472.71.721,314.8363.2600.72,194.7
     SD*12.512.70.1329.6195.3104.3595.4
    • ↵* Mean and SD values exclude ORNL phantom.

    • NA = not applicable.

    • View popup
    TABLE 2

    Cumulated Activity Concentrations

    Activity concentration (MBq·s·mL−1)
    AreaA*BCDEF
    Lungs2.01 × 1044.02 × 1048.04 × 1041.61 × 1053.22 × 1056.43 × 105
    Kidneys5.92 × 1045.92 × 1045.92 × 1045.92 × 1045.92 × 1045.92 × 104
    Liver4.20 × 1044.20 × 1044.20 × 1044.20 × 1044.20 × 1044.20 × 104
    Spleen1.26 × 1051.26 × 1051.26 × 1051.26 × 1051.26 × 1051.26 × 105
    Tumor in liver3.09 × 1056.19 × 1051.24 × 1062.48 × 1064.95 × 1069.90 × 106
    Tumor in lung3.34 × 1053.34 × 1053.34 × 1053.34 × 1053.34 × 1053.34 × 105
    • ↵* Distribution A was derived from Rizzieri et al. (24).

    • View popup
    TABLE 3

    OLINDA/EXM and Patient-Specific 131I S Factors (mGy·MBq−1·s−1) Calculated with MCNPX2.5.0 for Patient P1

    Source
    TargetLungsSpleenKidneysLiverTumor in lungTumor in liver
    Lungs
     OLINDA/EXM2.19 × 10−54.55 × 10−71.97 × 10−75.49 × 10⁻⁷NANA
     OEDIPE2.14 × 10−57.26 × 10−71.68 × 10−76.00 × 10−72.28 × 10−72.88 × 10⁻⁶
     Ratio1.020.631.170.92NANA
    Spleen
     OLINDA/EXM4.54 × 10−78.09 × 10−51.87 × 10−62.16 × 10⁻⁷NANA
     OEDIPE7.29 × 10−77.93 × 10−51.30 × 10−63.84 × 10−72.30 × 10−72.65 × 10⁻⁶
     Ratio0.621.021.440.56NANA
    Kidneys
     OLINDA/EXM1.97 × 10−71.87 × 10−65.99 × 10−58.19 × 10⁻⁷NANA
     OEDIPE1.72 × 10−71.30 × 10−65.91 × 10−59.07 × 10−72.22 × 10−63.57 × 10⁻⁷
     Ratio1.151.441.010.90NANA
    Liver
     OLINDA/EXM5.48 × 10−72.16 × 10−78.19 × 10−71.74 × 10⁻⁵NANA
     OEDIPE5.94 × 10−73.80 × 10−79.06 × 10−71.73 × 10−55.21 × 10−65.95 × 10⁻⁷
     Ratio0.920.560.901.01NANA
    Tumor in lung
     OLINDA/EXMNANANANA4.51 × 10−3NA
     OEDIPE2.29 × 10−72.15 × 10−62.18 × 10−65.06 × 10−64.41 × 10−32.23 × 10⁻⁷
    Tumor in liver
     OLINDA/EXMNANANANANA4.53 × 10−3
     OEDIPE2.96 × 10−62.72 × 10−63.57 × 10−75.95 × 10−72.20 × 10−74.41 × 10⁻³
    • OLINDA/EXM self values have been corrected for mass.

    • NA = not applicable.

    • View popup
    TABLE 4

    Percentage Difference in Organ Doses Calculated with OLINDA/EXM from Doses Calculated with OEDIPE

    Patient no.
    OrganP1P2P3P4P5P6P7P8P9
    Lungs
     No correction−55.2−81.7−62.6−26.0−11.420.3−27.9−11.9−54.9
     Mass corrected−3.3−3.7−4.0−2.7−3.7−4.0−5.2−5.2−4.3
    Spleen
     No correction−140.9−128.654.417.4−131.7−41.8−88.0−18.3−0.2
     Mass corrected−1.2−2.0−0.2−5.3−1.8−0.3−5.0−2.4−1.7
    Kidneys
     No correction−92.2−116.4−64.4−36.2−73.1−90.1−116.7−130.7−75.8
     Mass corrected−2.0−2.52.6−2.8−4.11.80.5−0.70.7
    Liver
     No correction−21.0−55.43.528.69.713.3−35.2−19.3−37.4
     Mass corrected1.0−2.1−1.20.20.51.2−0.80.9−1.8
    Tumor in lung
     No correctionNANANANANANANANANA
     Mass corrected3.44.12.12.03.32.22.51.41.9
    Tumor in liver
     No correctionNANANANANANANANANA
     Mass corrected4.04.12.83.42.73.14.43.54.5
    • Table refers to biodistribution A (Table 2).

    • NA = not applicable.

    • View popup
    TABLE 5

    Cross-Irradiation Contribution from Lungs and Hepatic Tumor to Total Liver Dose for 6 Biodistributions Studied for Patient P1

    Biodistribution% Contribution to total liver dose from lungs% Contribution to total liver dose from hepatic tumorTotal liver dose as calculated by OEDIPE (Gy)Total liver dose as calculated by OLINDA/EXM* (Gy)
    A4.00.61.781.76
    B7.61.21.861.79
    C14.02.12.031.92
    D24.13.72.352.18
    E37.75.73.002.70
    F52.68.04.313.73
    • ↵* Self-irradiation was corrected by OLINDA/EXM mass-correction algorithm, and cross-irradiation for reference man was used.

    • Distribution A was derived from Rizzieri et al. (24).

    • View popup
    TABLE 6

    Percentage Difference of Liver Doses Calculated Using OLINDA/EXM* and OEDIPE for Biodistributions A–F

    Patient no.
    BiodistributionP1P2P3P4P5P6P7P8P9
    A−1.02.11.2−1.6−0.5−1.80.8−0.91.8
    B−3.92.30.6−4.0−2.3−3.00.4−1.91.7
    C−5.32.60.5−7.4−5.5−5.3−0.2−3.82.3
    D−7.43.20.3−12.6−10.6−9.2−1.3−6.63.2
    E−10.34.00.1−19.4−17.3−14.8−2.9−10.64.5
    F−13.44.8−0.1−26.5−24.7−21.8−4.9−15.46.0
    • ↵* Self-irradiation was corrected by OLINDA/EXM mass-correction algorithm, and cross-irradiation for reference man was used.

    • Distribution A was derived from Rizzieri et al. (24).

PreviousNext
Back to top

In this issue

Journal of Nuclear Medicine: 50 (2)
Journal of Nuclear Medicine
Vol. 50, Issue 2
February 2009
  • Table of Contents
  • Table of Contents (PDF)
  • About the Cover
  • Index by author
Print
Download PDF
Article Alerts
Sign In to Email Alerts with your Email Address
Email Article

Thank you for your interest in spreading the word on Journal of Nuclear Medicine.

NOTE: We only request your email address so that the person you are recommending the page to knows that you wanted them to see it, and that it is not junk mail. We do not capture any email address.

Enter multiple addresses on separate lines or separate them with commas.
Effect of Patient Morphology on Dosimetric Calculations for Internal Irradiation as Assessed by Comparisons of Monte Carlo Versus Conventional Methodologies
(Your Name) has sent you a message from Journal of Nuclear Medicine
(Your Name) thought you would like to see the Journal of Nuclear Medicine web site.
Citation Tools
Effect of Patient Morphology on Dosimetric Calculations for Internal Irradiation as Assessed by Comparisons of Monte Carlo Versus Conventional Methodologies
Antigoni Divoli, Sophie Chiavassa, Ludovic Ferrer, Jacques Barbet, Glenn D Flux, Manuel Bardiès
Journal of Nuclear Medicine Feb 2009, 50 (2) 316-323; DOI: 10.2967/jnumed.108.056705

Citation Manager Formats

  • BibTeX
  • Bookends
  • EasyBib
  • EndNote (tagged)
  • EndNote 8 (xml)
  • Medlars
  • Mendeley
  • Papers
  • RefWorks Tagged
  • Ref Manager
  • RIS
  • Zotero
Share
Effect of Patient Morphology on Dosimetric Calculations for Internal Irradiation as Assessed by Comparisons of Monte Carlo Versus Conventional Methodologies
Antigoni Divoli, Sophie Chiavassa, Ludovic Ferrer, Jacques Barbet, Glenn D Flux, Manuel Bardiès
Journal of Nuclear Medicine Feb 2009, 50 (2) 316-323; DOI: 10.2967/jnumed.108.056705
Twitter logo Facebook logo LinkedIn logo Mendeley logo
  • Tweet Widget
  • Facebook Like
  • Google Plus One
Bookmark this article

Jump to section

  • Article
    • Abstract
    • MATERIALS AND METHODS
    • RESULTS
    • DISCUSSION
    • CONCLUSION
    • Acknowledgments
    • Footnotes
    • References
  • Figures & Data
  • Info & Metrics
  • PDF

Related Articles

  • This Month in JNM
  • PubMed
  • Google Scholar

Cited By...

  • OpenDose: Open-Access Resource for Nuclear Medicine Dosimetry
  • Study of the Impact of Tissue Density Heterogeneities on 3-Dimensional Abdominal Dosimetry: Comparison Between Dose Kernel Convolution and Direct Monte Carlo Methods
  • Google Scholar

More in this TOC Section

  • Tumor-Specific Binding of Radiolabeled PEGylated GIRLRG Peptide: A Novel Agent for Targeting Cancers
  • PET/MRI of Hypoxic Atherosclerosis Using 64Cu-ATSM in a Rabbit Model
  • Tumor Uptake of Anti-CD20 Fabs Depends on Tumor Perfusion
Show more Basic Science Investigations

Similar Articles

SNMMI

© 2025 SNMMI

Powered by HighWire