


Abstract
Data on the in vivo myocardial kinetics of 123I-metaiodobenzylguanidine (123I-MIBG) are scarce and have always been obtained using planar acquisitions. To clarify the normal kinetics of 123I-MIBG in vivo over time, we designed an experimental protocol using a 3-dimensional (3D) dynamic approach with a cadmium zinc telluride (CZT) camera. Methods: We studied 6 anesthetized pigs (mean body weight, 37 ± 4 kg). Left ventricular myocardial perfusion and sympathetic innervation were assessed using 99mTc-tetrofosmin (26 ± 6 MBq), 123I-MIBG (54 ± 14 MBq), and a CZT camera. A normal perfusion/function match on gated SPECT was the inclusion criterion. A dynamic acquisition in list mode started simultaneously with the bolus injection of 123I-MIBG, and data were collected every 5 min for the first 20 min and then at acquisition steps of 30, 60, 90, and 120 min. Each step was reconstructed using dedicate software and reframed (60 s/frame). On the reconstructed transaxial slice that best showed the left ventricular cavity, regions of interest were drawn to obtain myocardial and blood pool activities. Myocardial time–activity curves were generated by interpolating data between contiguous acquisition steps, corrected for radiotracer decay and injected dose, and fitted to a bicompartmental model. Time to myocardial maximum signal intensity (MSI), MSI value, radiotracer retention index (RI, myocardial activity/blood pool integral), and washout rate were calculated. The mediastinal signal was measured and fitted to a linear model. Results: The myocardial MSI of 123I-MIBG was reached within 5.57 ± 4.23 min (range, 2–12 min). The mean MSI was 0.426% ± 0.092%. Myocardial RI decreased over time and reached point zero at 176 ± 31 min (range, 140–229 min). The ratio between myocardial and mediastinal signal at 15 and 125 min and extrapolated at 176 and 4 h was 5.45% ± 0.61%, 4.33% ± 1.23% (not statistically significant vs. 15 min), 3.95% ± 1.46% (P < 0.03 vs. 125 min), and 3.63% ± 1.64% (P < 0.03 vs. 176 min), respectively. Mean global washout rate at 125 min was 15% ± 14% (range, 0%–34%), and extrapolated data at 176 min and 4 h were 18% ± 18% (range, 0.49%–45%) and 25% ± 23% (range, 1.7%–56.2%; not statistically significant vs. 176 min), respectively. Conclusion: 3D dynamic analysis of 123I-MIBG suggests that myocardial peak uptake is reached more quickly than previously described. Myocardial RI decreases over time and, on average, is null about 3 h after injection. The combination of an early peak and variations in delayed myocardial uptake could result in a wide physiologic range of washout rates. Mediastinal activity appears to be constant over time and significantly lower than previously described in planar studies, resulting in a higher heart-to-mediastinum ratio.
The myocardial sympathetic nervous system plays a major role in the regulation of cardiac function under physiologic and pathophysiologic conditions. Unfortunately, its investigation in vivo is complex and limited to the use of 11C-hydroxyephedrine and the radiolabeled analog of noradrenalin, 123I-metaiodobenzylguanidine (123I-MIBG). Myocardial innervation scintigraphy is a powerful prognostic marker in patients with left ventricular dysfunction and heart failure (1). Despite its unquestionable clinical utility, the use of 123I-MIBG cardiac scintigraphy is not proportional to the potential information that such a radiotracer could provide. A possible reason is the paucity of quantitative parameters provided to clinicians, confined to global indices such as heart-to-mediastinum (H/M) analysis and washout rate evaluation. In addition, to properly interpret the results of cardiac innervation studies, the basic kinetics of the radiotracer must be understood. Detailed kinetic analysis of 123I-MIBG has been performed on bovine adrenal chromaffin cells in vitro (2). Although these cells store catecholamines, they are morphologically and functionally distinct from cardiac sympathetic neurons, and in vitro results may not reflect behavior in an intact animal (3). To date, data on the myocardial kinetics of 123I-MIBG in vivo are scarce and have always been obtained using planar acquisitions (4).
Recently, we demonstrated the technologic feasibility of a 3-dimensional (3D) dynamic analysis of cardiac sympathetic innervation in vivo using a cadmium zinc telluride (CZT) camera (5). The tomographic dynamic approach offers some theoretic advantages. It can obtain time–activity curves of the radiotracer in the blood and myocardium, with the possibility of quantifying temporal changes in its kinetics. However, because our previous endpoint was methodologic and not clinical, the study suffered from some limitations, such as the small population and the short acquisition time (15 min). To clarify the normal in vivo kinetics of 123I-MIBG over a longer time, we designed an experimental protocol using a 3D-dynamic approach with a CZT camera.
MATERIALS AND METHODS
Animal Preparation
The principles of laboratory animal care outlined in European Directive 2010/63/UE and Italian Law 116/92 were followed. The study was approved by the Ethical Committee of the Experimental Biomedicine Center, National Research Council, Pisa, Italy.
Six young castrated farm pigs (weight range, 32–41 kg; mean, 37 ± 4 kg) were kept fasting for 12 h before the study, with free access to water. The animals were preanesthetized with an intramuscular injection of a solution of tiletamine hypochloride and zolazepam hypochloride (Zoletil [Virbac]; 10 mg/kg), atropine (0.1 mg/kg), and azaperone (Stresnil [Eli Lilly]; 2 mg/kg). Then, venous access was obtained by cannulating the marginal ear vein, and a 2 mg/kg bolus of propofol was administered. One of the carotid arteries was isolated, and a catheter was introduced to obtain arterial blood samples and to monitor arterial blood pressure. Each animal was intubated and ventilated with a volume-controlled ventilator with supplemental oxygen (respiratory rate, 15 cycles/min; tidal volume, 10–15 mL/kg). Anesthesia was maintained with a continuous infusion of propofol (5–8 mg/kg/h). The adequacy of ventilation was checked periodically by obtaining arterial blood gas measurements, and ventilator settings were adjusted to maintain a pH of 7.35–7.45, partial pressure of CO2 of 35–45 mm Hg, and partial pressure of O2 of more than 120 mm Hg. Four electrodes were used for monitoring cardiac rhythm and for the electrocardiography-gated acquisition. To ensure an appropriate depth of anesthesia, tail clamping, corneal reflex, lacrimation, and changes in hemodynamics and heart rate were continuously verified.
CZT Perfusion/Function SPECT Protocol
Left ventricular myocardial perfusion/function was assessed using 99mTc-tetrofosmin (26 ± 6 MBq) and a CZT camera (Discovery NM530c; GE Healthcare). The camera was equipped with a multiple-pinhole collimator and 19 stationary CZT detectors simultaneously imaging 19 cardiac views. This design allows high-quality imaging of a 3-dimensional volume imaged by all detectors (quality field of view). The animals were imaged supine with the forelegs placed over the head. Automated heart positioning in the quality field of view was assisted using real-time persistence imaging. Nuclear imaging was performed as a 10-min acquisition in list mode 15 min after radiotracer injection. Perfusion gated SPECT data were reconstructed with a dedicated, penalized iterative algorithm (maximum-likelihood expectation maximization [Myovation for Alcyon]; GE Healthcare). A Butterworth postprocessing filter (frequency, 0.37; order, 7) was applied to the reconstructed slices. The tomographic studies were also reprojected into 60 planar projections to emulate a standard SPECT layout. Images were reconstructed without scatter or attenuation correction. Two experienced nuclear cardiologists independently performed a semiquantitative analysis of regional myocardial perfusion using a 17-segment model of the left ventricle and a 5-point scale (0, normal uptake; 1, mild uptake; 2, moderate uptake; 3, severely reduced uptake; and 4, absence of detectable uptake), and in cases of disagreement, a consensus was reached. Regional myocardial left ventricular function was analyzed using Quantitative Gated SPECT software (6). Myocardial volume, left ventricular ejection fraction, summed motion score, and thickening score were also obtained.
CZT Innervation SPECT Protocol
Without moving the animal, we next imaged myocardial innervation with 123I-MIBG (54 ± 14 MBq). Before the start of the study, the radiotracer dose was counted under the camera for 60 s. Then, the acquired data were reconstructed and a spheric volume of interest was placed around the hot spot. The total count in the volume of interest was used for myocardial activity normalization. A dynamic acquisition in list mode started simultaneously with the bolus injection of radiotracer, and data were collected every 5 min for the first 20 min and then at acquisition steps of 30, 60, 90, and 120 min. At the end of the study, each step was reconstructed using dedicate software (Lister; GE Healthcare). Dynamic 3D volumes at each step were reframed, integrating 60-s time frames. Then, a temporal series of 3D axial volumes (70 × 70 × 50 voxels, 4 × 4 × 4 mm) was reconstructed from the acquired reframed data, using a dedicated, penalized iterative algorithm (maximum-likelihood expectation maximization; 50 iterations; regularization type: green one step late (OSL); maximum a posteriori parameters: green OSL α, 0.41, and green OSL β, 0.2) and a 10% energy window centered at the photopeak of 123I (159 keV ± 5%). On the reconstructed transaxial slice that best showed the left ventricular cavity, a region of interest (ROI) encompassing the whole myocardium was manually drawn (Fig. 1). To evaluate the reproducibility of the method, image data were analyzed by 2 observers, each masked to the results of the other. For all animals, the 2 observers drew a set of ROIs on the same midventricular myocardial slice obtained at the 5-, 30-, 60-, 90-, and 120-min steps. The first observer repeated the analysis 1 wk later to assess intraobserver reproducibility. Mean counts/pixel/s in the ROIs were used to assess the coefficient of variation.

On reconstructed transaxial slice with best visualization of left ventricular cavity, regions of interest encompassing whole myocardium (A) and cardiac cavity (B) were manually drawn. Circular regions of interest was drawn on mediastinal space, below plane encompassing thyroid gland and between apexes of lungs (C). A and B have been magnified to illustrate volume-of-interest positioning. Dedicated software generated corresponding time–activity curves (kilocounts/voxel/s).
A circular ROI was drawn on the left ventricular cavity to obtain the blood pool activity (Fig. 1). Blood and myocardial time–activity curves were generated by interpolating data between contiguous acquisition steps and were corrected for radiotracer decay and injected dose (Fig. 2A). Data were fitted to a bicompartmental model (Fig. 2B), as previously described (5). Because the mean transit time of the first compartment (<5 s) was expected to be low with respect to the sampling interval, myocardial time–activity curves were fitted to the second compartment only, and the time to myocardial maximum signal intensity (MSI) and MSI value were calculated on the second compartment. The fitting error was evaluated as the root mean square error normalized to the signal value and expressed as a percentage.
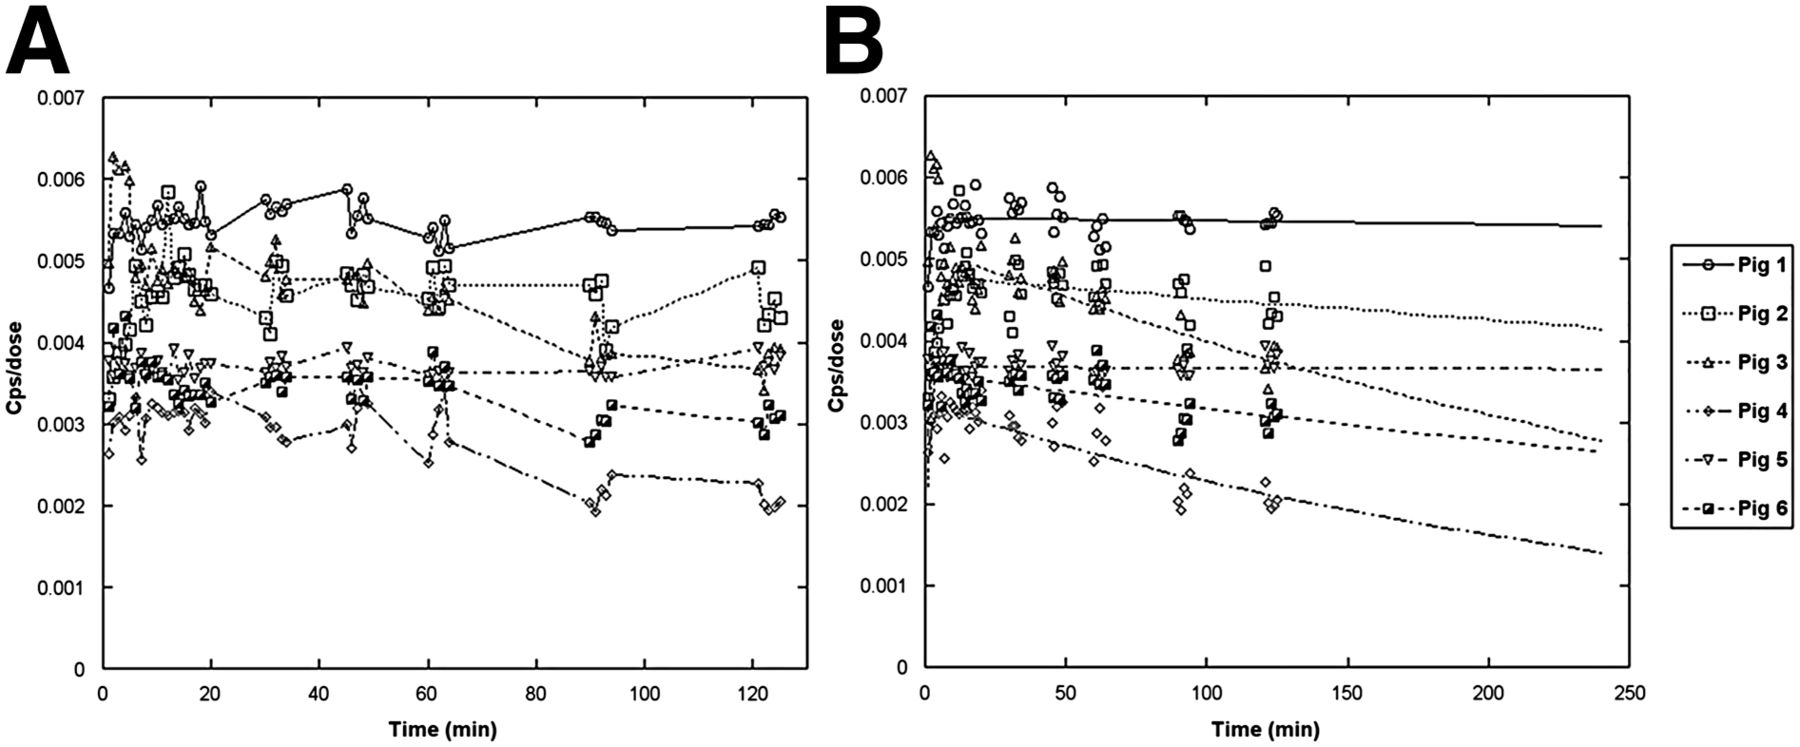
Myocardial time–activity curves obtained in experimental preparations as raw data corrected for 123I physical decay and normalized for injected dose (A) and fitted and extrapolated to 4 h using bicompartmental model (B).
In addition, a dynamic retention index (RI) of the radiotracer in each step was obtained (7): Eq. 1 where Ct is the average radiotracer tissue concentration in the ROI and Cp is the radiotracer blood concentration as a function of time.
Dynamic washout rate was obtained as follows (5): Eq. 2A circular ROI was drawn on the mediastinal space, below the plane encompassing the thyroid gland and between the apexes of the lungs. The mediastinal signal was measured and fitted to a linear model. The dynamic H/M value was obtained as follows:
 Eq. 3 where Ct and Mt are the myocardial and mediastinal concentrations, respectively, of the radiotracer as a function of time.
Statistical Analysis
Continuous variables are presented as mean ± SD. Where indicated, differences were assessed by the Student t test for paired or unpaired data. The fitting error was evaluated as the mean square error between the time–activity curve and the optimal fitting model normalized to the time–activity curves and expressed as a percentage. Reproducibility in manually drawing the ROIs was assessed using the coefficient of variation (CV). Analysis was performed using MedCalc software (version 12.4). Statistical significance for all analyses was assessed at a probability value of less than 0.05.
RESULTS
Left Ventricular Perfusion/Function
A normal perfusion/function match was used as the inclusion criterion before we proceeded to the innervation study. As showed in Table 1, the mean 99mTc-tetrofosmin summed rest score was 2.6 ± 1.5 (range, 0–4). All animals except pig 3 showed a mild reduction of radiotracer uptake in the apex. This phenomenon has been previously described in clinical studies on humans (8). In addition, and considering the smaller myocardial mass in pigs than in humans, it is likely that the physiologic thinning of the apex may determine, through the partial-volume effect, an apparent reduction in regional myocardial uptake of the radiotracer. Mean ejection fraction was 63% ± 4% (range, 57–69). All animals showed normal left ventricular volumes, summed motion scores, and thickening scores. After completion of the study, each animal was sacrificed with an injection of 10 mL (20 mEq) of potassium chloride and the heart was visually examined. All pigs showed complete integrity of the myocardial and pericardial structures.
Clinical and Scintigraphic Characteristics of 6 Experimental Preparations
Cardiac Innervation Study
Myocardial oxygen consumption remained stable during the dynamic innervation study (no statistically significant differences among baseline, mid-study, and end-of-study mean rate–pressure products, Table 1). Arterial blood gas measurements showed good control of acid–base balance during the study (Table 1). There was good reproducibility and concordance in manually drawn ROIs. Intraobserver and interobserver CVs were 4.84% and 5.08%, respectively.
The mean fitting error in myocardial signal assessment was 8.48% ± 5.78%, confirming agreement between the acquired data and the previously proposed model (5).
Uptake of 123I-MIBG in the myocardium reached 95% of MSI within 5.57 ± 4.23 min (range, 2–12 min). The mean MSI was 0.426% ± 0.092%. Mean signal at 15 min was 0.424% ± 0.094% (not statistically significant vs. MSI).
Mean radiotracer RI decreased over time and reached point zero at 176 ± 31 min (range, 140–229 min) (Fig. 3).
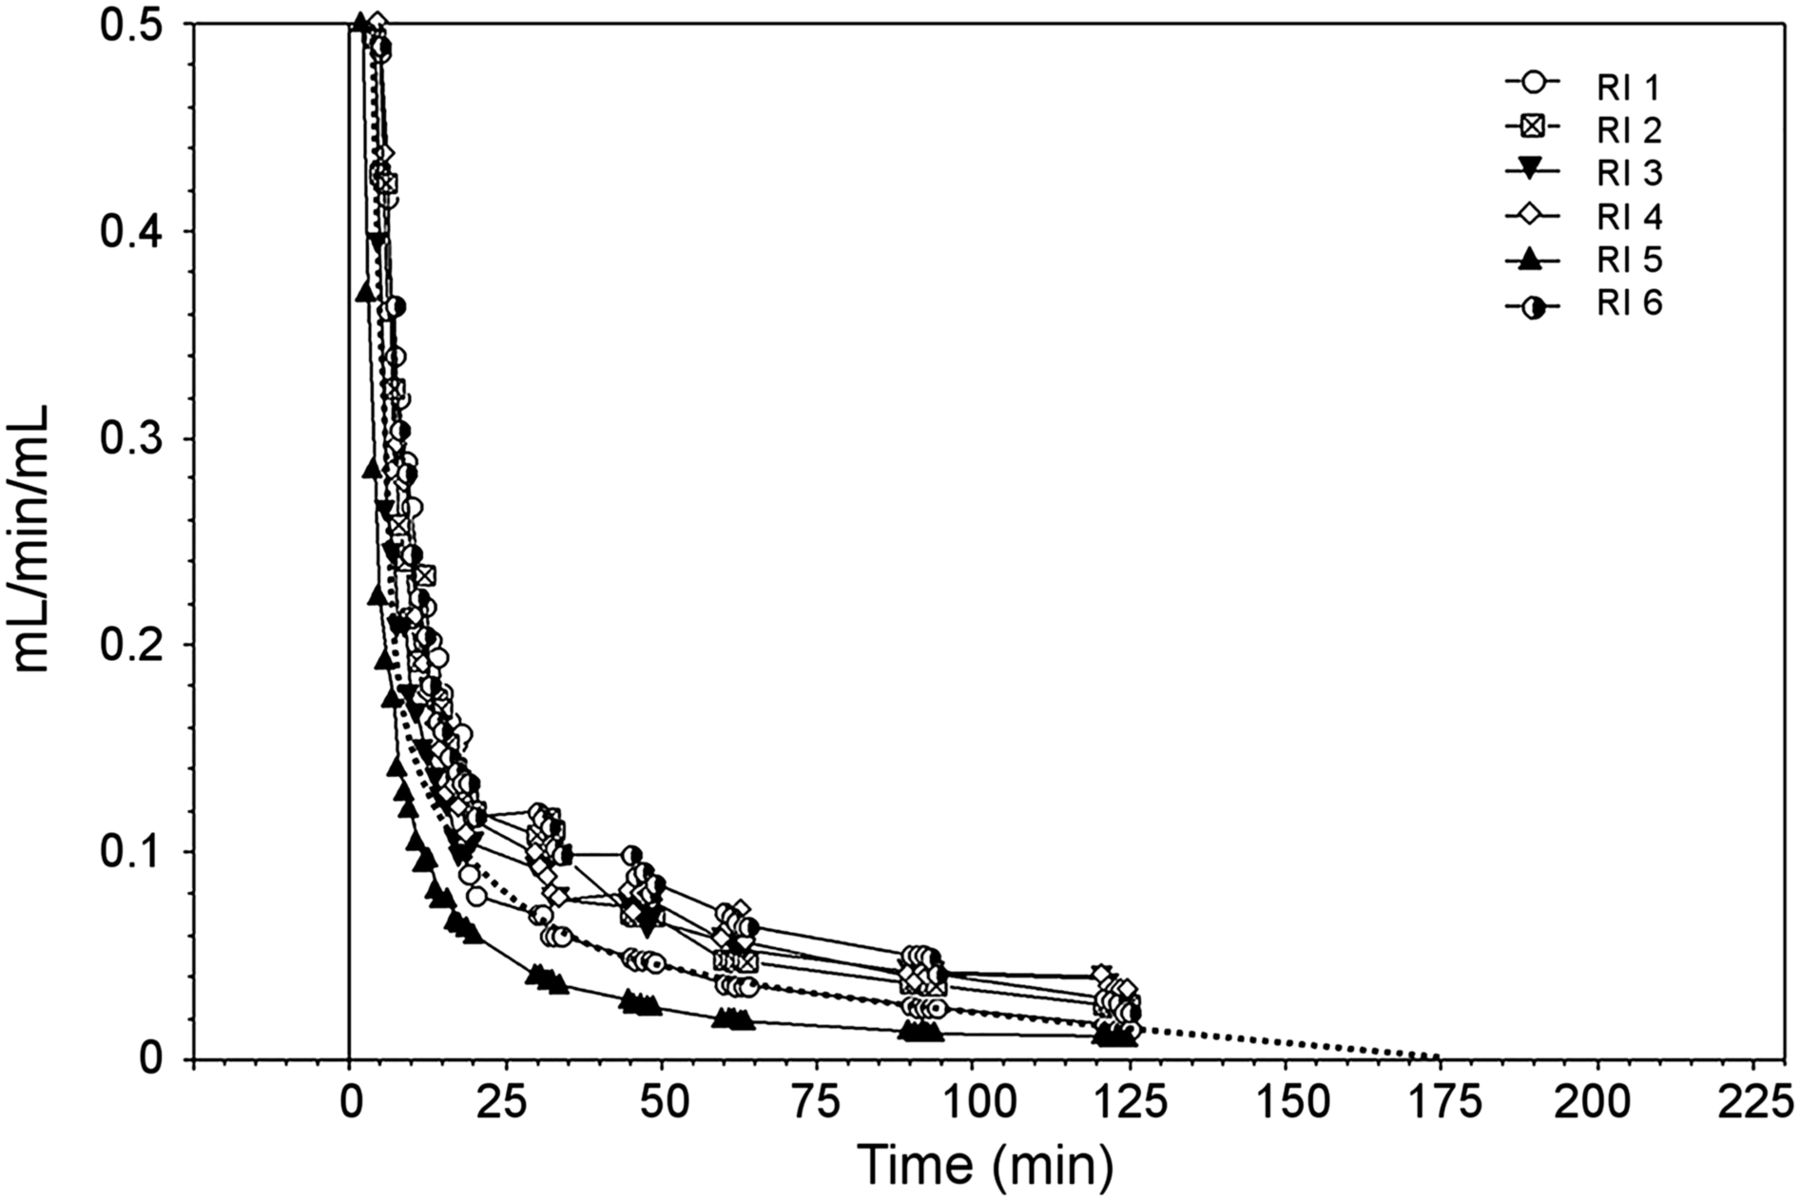
RI calculated as instant myocardial uptake of 123I-MIBG normalized for blood pool activity. RI is a function of time and therefore is null about 3 h, on average, after radiotracer injection (dotted line).
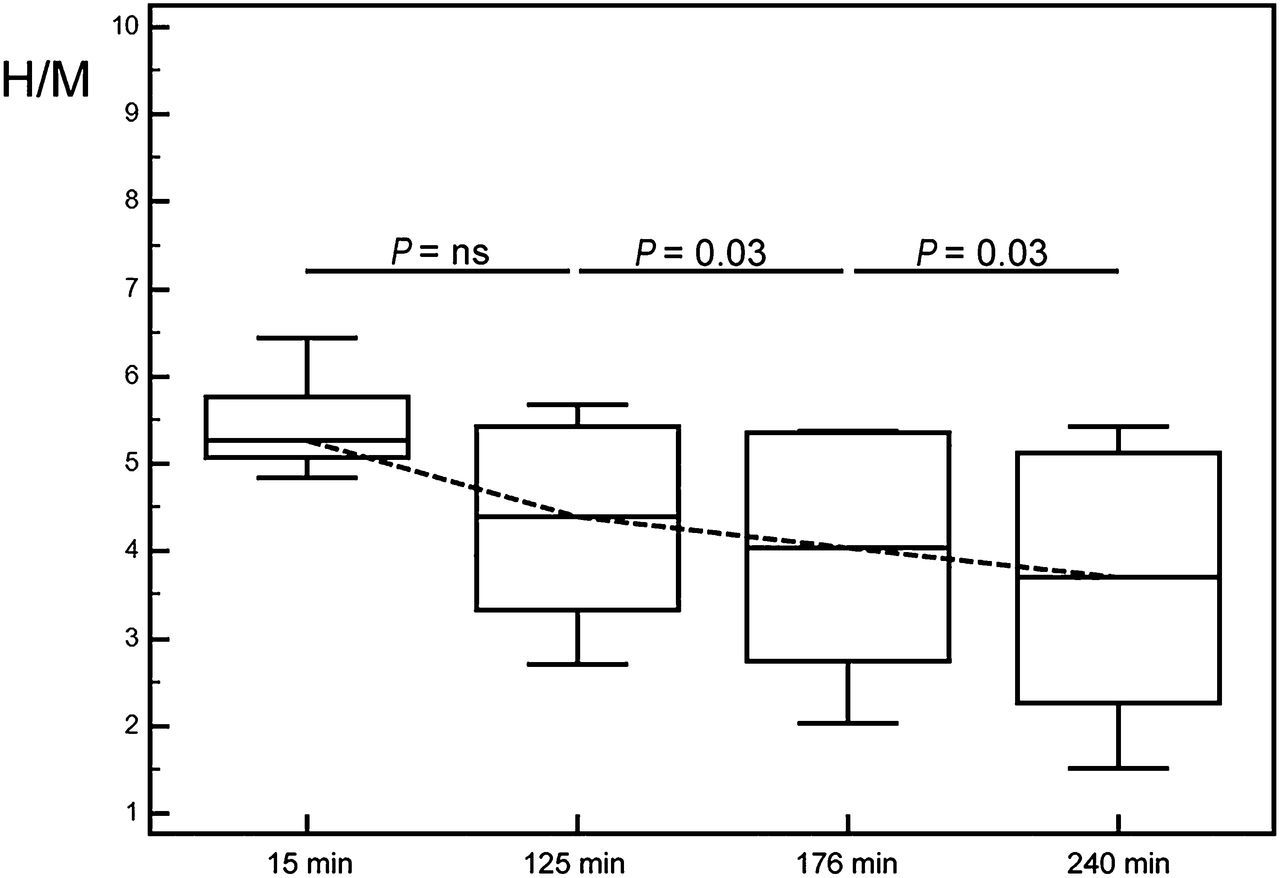
The linear fit of the mediastinal signal resulted in a mean slope of 0.000096% ± 0.00017%. The ratio between myocardial and mediastinal signal at 15 min, 125 min, and extrapolated at 176 min and 4 h was 5.45% ± 0.61%, 4.33% ± 1.23% (not statistically significant vs. 15 min), 3.95% ± 1.46% (P = 0.03 vs. 125 min), and 3.63% ± 1.64% (P = 0.03 vs. 176 min), respectively (Fig. 4).

Box plots reporting H/M mean values ± SD during study. H/M ratio decreased over time and was significantly higher than previously described in planar studies.
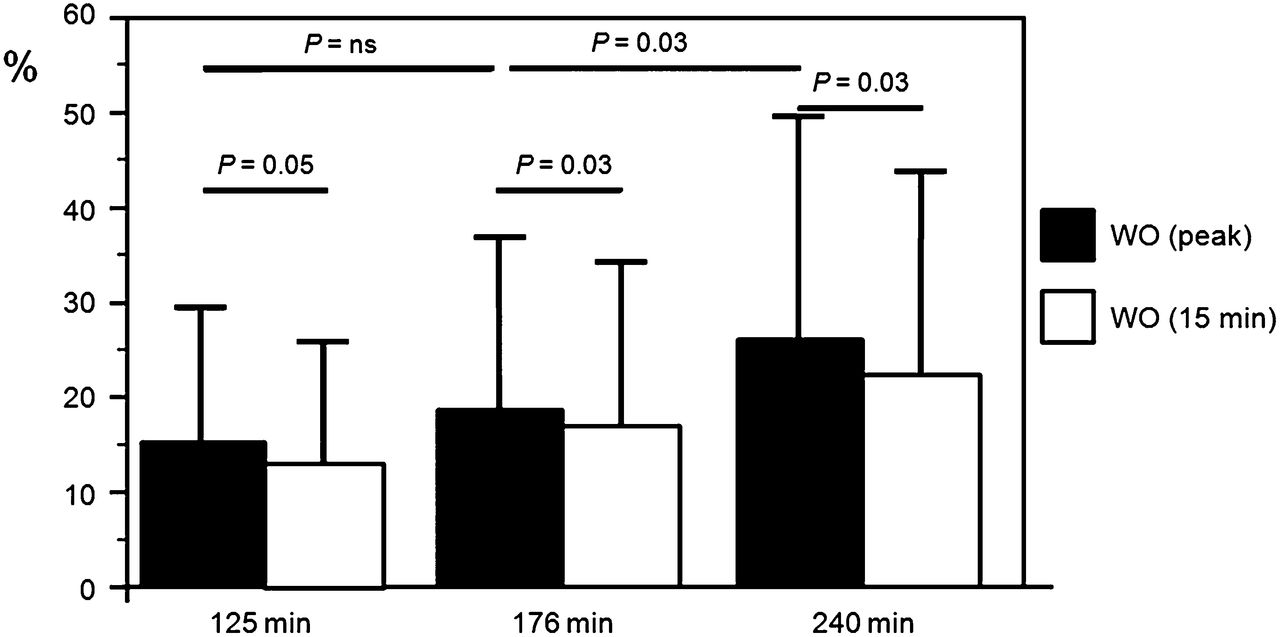
Mean global washout rate obtained using radiotracer uptake at MSI was 15% ± 14% (range, 0%–34%) at 125 min, and extrapolated data at 176 min and 4 h were 18% ± 18% (range, 0.49%–45%, not statistically significant vs. 125 min) and 25% ± 23% (range, 1.7%–56.2%; P < 0.03 vs. 176 min), respectively (Fig. 5). However, mean global washout rate calculated using radiotracer uptake at 15 min was significantly different at each acquisition step from the previous results (15% ± 14% vs. 12% ± 12% at 125 min, P = 0.05; 18% ± 18% vs. 16% ± 17% at 176 min, P = 0.03; 25% ± 23% vs. 22% ± 21% at 4 h, P = 0.03) (Fig. 5).

Global washout (WO) rates calculated using radiotracer peak uptake and radiotracer uptake estimated at 15 min. We observed statistically significant differences between myocardial global washout rates calculated at peak of radiotracer extraction and myocardial uptake at 15 min.
DISCUSSION
To our knowledge, the present study was the first to evaluate dynamic myocardial innervation in vivo using a CZT extended-acquisition protocol and a PET-like approach. To properly interpret the results of cardiac innervation studies, the basic kinetics of 123I-MIBG must be understood. Detailed kinetic studies have been previously performed on bovine adrenal chromaffin cells in vitro (2). Although these cells metabolize and store catecholamines, they are morphologically and functionally distinct from cardiac sympathetic neurons. As a consequence, results in vitro may not reflect behavior in an intact animal. Glowniak et al. measured the first-pass extraction fraction of 123I-MIBG in the pig heart and determined the effects of cocaine, dipyridamole, and imipramine (3). The authors demonstrated that radiotracer extraction fraction in pigs is dependent on myocardial blood flow and is increased by imipramine, which conversely reduces the extraction in vitro (3). Therefore, an in vivo dynamic approach has potential advantages in evaluating cardiac innervation. Arbab et al. obtained both dynamic and static images using a 30-min planar acquisition protocol in both patients and volunteers (9). They reported that 123I-MIBG uptake in the heart was quick and complete and reached a steady state with blood pool activity by 2–3 min; thereafter, the radiotracer started to wash out from the heart. The early uptake ratio (at 3 min, normalized for the injected dose) was significantly higher than the delayed one (at 30 min). Our results are in agreement, demonstrating that myocardial peak uptake of the radiotracer is reached on average within 5 min. In the work of Arbab et al., the dynamic acquisition was limited to 30 min, thus preventing comparison with our observation on the delayed phase of 123I-MIBG uptake. Previous PET studies concerning cardiac sympathetic innervation used a semiquantitative approach to quantify myocardial retention of radiotracers (10,11). These studies calculated an RI that normalizes regional tissue concentrations of the tracer to the integral of the blood concentration. Using a CZT 3D dynamic PET-like approach, we calculated the dynamic RI for 123I-MIBG. Our analysis demonstrated that RI decreases over time, with a fast initial reduction and a slow delayed phase approaching point zero about 3 h after radiotracer injection. Thereafter, no further myocardial uptake of the radiotracer occurs and myocardial washout prevails. The myocardial washout rate increased over time and had a wide range of values. The ratio between myocardial and mediastinal signal decreased over time and was significantly higher than previously described in planar studies. Indeed, the mediastinal signal was relatively constant during the study, and reduction of the ratio was the result of a progressive reduction in myocardial uptake of the radiotracer.
The proposal for 123I-MIBG imaging standardization relies on planar myocardial acquisition at 15 min and 4 h after radiotracer injection (12). Semiquantitative assessment of sympathetic cardiac innervation is based on H/M ratio and washout rate calculation. The H/M ratio after 15 min most probably reflects the continuity of presynaptic nerve terminals and the functioning of the uptake-1 mechanism. The H/M ratio after 4 h enables integration of information about neuronal function (uptake and storage). The washout rate of MIBG from the heart indicates the excitation level of the adrenergic system. Nonetheless, there are doubts about interpretation of the washout rate (8). In our study, H/M ratio decreased over time, as expected, and was higher than previously described in humans. As reported by Verberne et al., time variations in H/M ratio cannot be attributed to changes in blood activity of the radiotracer (13). Our results are in agreement, demonstrating that the mediastinal signal is relatively constant and that reduction of the ratio is due mainly to a decrease in myocardial radiotracer uptake. Moreover, the tomographic approach allows better definition of the mediastinal space, with reduced spillover of activity from adjacent anatomic structures, potentially resulting in a lower count density and a high H/M ratio.
In our study, 123I-MIBG RI was a function of time and was null about 3 h after radiotracer injection. Therefore, our results confirm previous observations from planar studies and strengthen the assumption that myocardial washout should be evaluated at least 3 h after radiotracer injection.
The clinical standard of measuring myocardial radiotracer uptake at 15 min after injection means that information from early radiotracer extraction may be lacking and that semiquantitative assessment of myocardial global washout rate may be affected. In our study, we observed a statistically significant difference between myocardial global washout rates calculated at the peak of radiotracer extraction and myocardial uptake at 15 min. However, despite a wide physiologic range, mean values agreed with previous observations, with results below the cutoff clinically associated with a poor prognosis in patients with heart failure (14). Both H/M and washout rate were statistically different if calculated at 125 min, 176 min, and 4 h. However, they did not differ from a clinical point of view. This fact could have interesting clinical implications with regard to reducing the global time of the study and improving the logistics of the nuclear cardiology laboratory. Unfortunately, our data were from curve extrapolation at 4 h, and additional studies will be required to determine the possibility of reducing the overall time of clinical imaging.
A 3D dynamic SPECT approach may provide important additional parameters over serial planar imaging. Regional distribution of sympathetic innervation may be clinically relevant by differentiating the underlying pathophysiologic substrata of different cardiac diseases. Moreover, this approach may further characterize the myocardium in terms of catecholamine kinetics, expanding the diagnostic yield of 123I-MIBG in cardiac and neurologic disorders.
One limitation of our study was the small sample size. Moreover, the acquisition protocol was limited to 125 min, and data at 3 and 4 h were extrapolated by fitting the time–activity curves. Thus, the extrapolated curves could not be completely representative of the radiotracer kinetics in vivo. However, most studies in the literature were designed with acquisition protocols of limited time. Prolonging the acquisition time increases the hemodynamic instability of the experimental preparation, with the risk of introducing confounding results. Furthermore, anesthetics are known to potentially affect tracer uptake (15), and variations in plasma concentration may have influenced the results. In addition, we did not evaluate differences in catecholamine activation between animals. This lack hampered any conclusion on the observed variability in radiotracer washout. Because of the small field of view and pinhole collimation of the CZT camera, selection of the mediastinal region is more complex than in planar imaging. Moreover, truncation artifacts can cause a variation in background activity. These phenomena may have influenced the accuracy of H/M ratios measured with the CZT camera. Finally, we used a healthy pig experimental model to investigate myocardial sympathetic innervation. Although our data were often in agreement with previous studies on humans, great caution should be used in extending our results to humans.
CONCLUSION
Using CZT technology and a dynamic 3D acquisition, our analysis of 123I-MIBG radiotracer kinetics confirms and expands previous observations obtained by planar studies. Our results suggest that myocardial peak uptake of the radiotracer is reached more quickly than previously described. Radiotracer myocardial retention decreases over time and is null 3 h after the injection. The combination of an early peak and small variations in delayed myocardial uptake can result in a wide physiologic range of washout rates. Mediastinal activity appears constant over time and is significantly lower than previously described in planar studies, resulting in a higher H/M ratio.
DISCLOSURE
The costs of publication of this article were defrayed in part by the payment of page charges. Therefore, and solely to indicate this fact, this article is hereby marked “advertisement” in accordance with 18 USC section 1734. No potential conflict of interest relevant to this article was reported.
Footnotes
Published online Jan. 29, 2015.
- © 2015 by the Society of Nuclear Medicine and Molecular Imaging, Inc.
REFERENCES
- Received for publication May 27, 2014.
- Accepted for publication November 6, 2014.


