


Abstract
We evaluated the ability of the PET imaging agent 89Zr-trastuzumab to delineate HER2-positive gastric cancer and to monitor the pharmacodynamic effects of the epidermal growth factor receptor (EGFR)/human epidermal growth factor receptor 2 (HER2) tyrosine kinase inhibitor afatinib. Methods: Using 89Zr-trastuzumab, 18F-FDG, or 3′-deoxy-3′-18F-fluorothymidine (18F-FLT PET), we imaged HER2-positive NCI-N87 and HER2-negative MKN74 gastric cancer xenografts in mice. Next, we examined the pharmacodynamic effects of afatinib in NCI-N87 xenografts using 89Zr-trastuzumab and 18F-FDG PET and comparing imaging results to changes in tumor size and in protein expression as monitored by Western blot and histologic studies. Results: Although 18F-FDG uptake in NCI-N87 tumors did not change, a decrease in 89Zr-trastuzumab uptake was observed in the afatinib-treated versus control groups (3.0 ± 0.0 percentage injected dose per gram (%ID/g) vs. 21.0 ± 3.4 %ID/g, respectively; P < 0.05). 89Zr-trastuzumab PET results corresponded with tumor reduction, apoptosis, and downregulation of HER2 observed on treatment with afatinib. Downregulation of total HER2, phosphorylated (p)-HER2, and p-EGFR occurred within 24 h of the first dose of afatinib, with a sustained effect over 21 d of treatment. Conclusion: Afatinib demonstrated antitumor activity in HER2-positive gastric cancer in vivo. 89Zr-trastuzumab PET specifically delineated HER2-positive gastric cancer and can be used to measure the pharmacodynamic effects of afatinib.
Each year worldwide, approximately 200,000 people are diagnosed with human epidermal growth factor receptor 2 (HER2)–positive esophagogastric cancer (1–3). A randomized phase III trial study for patients with this disease showed improved response and survival when trastuzumab (HER2-directed monoclonal antibody) was added to chemotherapy (4), and the U.S. Food and Drug Administration and European Union have approved trastuzumab for patients with HER2-positive esophagogastric cancer.
The HER2 oncogene (also referred to as HER2/neu or erbB-2) on chromosome 17q21 encodes a 185-kDa transmembrane tyrosine kinase receptor that belongs to the erbB family comprising epidermal growth factor receptor (EGFR)/HER1, HER2, HER3, and HER4. HER2 activation plays a pivotal role in cell proliferation and survival, largely mediated through the RAS–MAPK pathway, and it inhibits cell death through the phosphatidylinositol 3′-kinase–AKT–mammalian target of rapamycin (mTOR) pathway (5). Although anti-HER2 therapy with trastuzumab has shown efficacy in HER2-positive esophagogastric cancer (4), possible limitations to this approach include incomplete blockade of EGFR and HER2 kinase activity and coincident activation of other members of the erbB family.
Afatinib (BIBW 2992)—a highly selective, irreversible inhibitor of the erbB family of tyrosine kinase receptors EGFR, HER2, and HER4—is currently in phase II–III studies in lung (6), head and neck (7,8), and breast cancers (9). Afatinib monotherapy in HER2-driven tumors has decreased tumor size in phase II studies of HER2-amplified breast cancer (10) and HER2 mutant lung cancer (11). Clinical efficacy of afatinib in patients with esophagogastric cancer has not yet been explored. We hypothesized that noninvasive imaging of HER2 might facilitate anti-HER2 therapies for esophagogastric cancer.
In patients with locally advanced esophagogastric adenocarcinoma, early metabolic response defined by 18F-FDG PET during preoperative chemotherapy predicts histopathologic response and survival (12–14). These findings provide an important step toward tailoring treatment to tumor biology. However, the ability of trastuzumab to provide site-directed targeting of HER2-positive tumors cannot be achieved by 18F-FDG. Moreover, approximately 30% of gastric cancers cannot be visualized with sufficient contrast for quantification on 18F-FDG PET (15). Previous methods have investigated the use of trastuzumab labeled with radionuclides including 64Cu- and 68Ga-labeled F(ab′)2 fragments (16–18). The images obtained using these agents show relatively poor tumor–to–background tissue contrast due to the short radioactive half-life (t1/2) (64Cu), which fails to match optimum biodistribution profiles or the small molecule size (68Ga-F(ab′)2) of these molecules. However, the physical decay properties of the positron emitter 89Zr (t1/2 = 78.4 h) are ideal for PET imaging with larger vectors such as full antibodies and lead to image resolution comparable to that obtained with 18F-FDG (19,20).
In this study, we examined the utility of 89Zr-trastuzumab PET analysis as a biomarker to identify HER2-positive esophagogastric cancer and evaluated the biologic effects of afatinib in human HER2-positive gastric xenograft models. Validation of this hypothesis will mean a decrease in tumor uptake of 89Zr-trastuzumab as a consequence of EGFR/HER2 inhibition.
MATERIALS AND METHODS
All chemicals were purchased from Sigma-Aldrich, unless otherwise stated. Radioactivity was measured using a CRC-55tR dose calibrator (Capintec) with a calibration factor of 465 for 89Zr and an Automatic Wizard2 γ-counter (Perkin Elmer) set to decay-correct at the start of the assay. Purity and radiochemical yields were determined using a Bioscan AR2000 (Bioscan Inc.) chromatograph with Win-Scan radio–thin-layer chromatography software (version 3.13; Bioscan Inc.).
Afatinib Treatment in NCI-N87 HER2-Positive Xenograft
Gastric cancer cell lines NCI-N87 (HER2-positive) and MKN74 (HER2-negative) were obtained from the American Type Culture Collection and cultured in RPMI-1640 medium supplemented with 10% fetal calf serum (Omega Scientific) and 100 units/mL of both penicillin and streptomycin.
All animal experiments were performed in accordance with guidelines set by Memorial Sloan-Kettering Cancer Center Animal Care and Use Committee and Research Animal Resource Center.
Eight-week-old athymic nu/nu female mice (Harlan) were subcutaneously implanted on the left shoulder with 5 × 10⁶ NCI-N87 cells along with Matrigel (BD Biosciences). When tumors reached approximately 150 mm3, 10 animals per group were randomized to receive vehicle alone, oral afatinib (25 or 50 mg/kg daily; Boehringer Ingelheim, Inc.), trastuzumab (20 mg/kg once a week, intravenously; Genentech/Roche), or a combination of afatinib and trastuzumab over 21 d. Mice were observed daily throughout the treatment period for signs of morbidity or mortality. Tumors were measured twice weekly using calipers, and volume was calculated using the formula length × width2 × 0.52. Tumor samples were collected within 8 h of the last treatment and preserved in 4% paraformaldehyde or flash-frozen until further use.
Western Blotting and Immunohistochemistry
Tumors were homogenized in buffer containing 2% sodium dodecyl sulfate (SDS), 50 mM Tris (pH 7.4), and 10% glycerol supplemented with protease and phosphatase inhibitor cocktail (Roche). The lysate was sonicated, boiled for 5 min, and centrifuged at 14,000 rpm, 20 min, 4°C, and protein concentrations of the lysate were determined using the BCA kit (Pierce) according to the manufacturer's instructions. Protein lysates (50–100 μg) were electrophoretically resolved by SDS/polyacrylamide gel electrophoresis, transferred to nitrocellulose membrane, and probed with the indicated primary antibodies: p-EGFR (Tyr 1173; Cell Signaling Technology), Total EGFR (D38B1; Cell Signaling Technology), Total c-erb-2/Her2/neu Ab15 clone 3B5 (Neomarker), p-Her3 (Tyr1289; Cell Signaling Technology), and total AKT (Cell Signaling Technology). Signals were detected with Western blotting detection reagents (GE Healthcare). All antibodies were diluted 1:500. Total HER2 expression at baseline and after afatinib treatment was assessed by immunohistochemistry (Dako).
Trastuzumab Conjugation and 89Zr Labeling
Conjugation of trastuzumab with ensuing labeling of 89Zr was performed according to previously published literature (21). Briefly, desferrioxamine was attached to trastuzumab via a succinic anhydride linker at a ratio of 10:1 (desferrioxamine:trastuzumab). The trastuzumab–desferrioxamine conjugate was then purified using a PD10 desalting column (GE Healthcare Lifesciences, U.K.).
89Zr (t1/2 = 78.4 h) was produced as reported previously (19). Radiolabeling reactions were performed according to previously reported methods (20,21). In summary, 89Zr oxalate (∼37 MBq) solution (pH ∼7.0–7.2) was added to trastuzumab–desferrioxamine (300–350 μg). The reaction was incubated at room temperature for 1–1.5 h before purification. The purified labeled product was obtained via use of a PD10 desalting column or size-exclusion spin column centrifugation (molecular weight cut-off, 30 kDa; Amicon Ultra-4 [Millipore]). Radiochemical yields and purity were determined via radio–instant thin-layer chromatography. All radiolabeled antibodies were determined to have greater than 95% radiochemical and chemical purity before use. The number of desferrioxamine ligands conjugated to trastuzumab was determined via radiometric isotopic dilution experiments described previously (22,23).
The labeled trastuzumab was evaluated for its ability to bind to the HER2-positive NCI-N87 cell line using the protocol specified by Lindmo et al. (24). The immunoreactivity was determined via linear extrapolation of the percentage bound labeled antibody to an infinite antigen excess.
Small-Animal PET Imaging and Biodistribution Studies
Small-animal PET studies were conducted using microPET-R4 and Focus 120 scanners (Concorde Microsystems) on dual–tumor-bearing mice (n = 3–4) with NCI-N87 and MKN74 cells implanted subcutaneously on the left and right shoulders, respectively. Quantification was performed using ASIPro VM software (Concorde Microsystems). Three-dimensional regions of interest (ROIs) were manually drawn on the tumor site to obtain the uptake of the tracer as the mean percentage injected dose per gram (%ID/g). 18F-FDG (7.4–9.25 MBq) and 3′-deoxy-3′-18F-fluorothymidine (18F-FLT PET) (7.4–9.25 MBq) were injected in a lateral tail vein; images were recorded 1 h after injection. 89Zr-trastuzumab (8.14–10.18 MBq, 80–100 μg of protein) was administered to the same group of mice 24 h later, with images recorded between 4 and 96 h after injection.
Mice bearing NCI-N87 xenografts (n = 3–4/group) treated with either vehicle or afatinib (50 mg/kg) daily over 7–21 d were imaged with 18F-FDG and 89Zr-trastuzumab (Supplemental Fig. 4A; supplemental materials are available online only at http://jnm.snmjournals.org), and PET imaging results were compared with tumor size, Western blot, and histology data.
In biodistribution experiments, 89Zr-trastuzumab (0.37–0.555 MBq, 4–5 μg) was administered intravenously at 0 h. Untreated animals were euthanized at 24, 48, 96, and 144 h after injection (n = 3–5/group), and 12 organs (including the tumor) were counted for activity accumulation. A blocking study at 48 h was performed with a coinjection of a 100-μg excess of trastuzumab to demonstrate the uptake mechanism of the tracer. In biodistribution studies of mice treated with afatinib over 7, 14, and 21 d (n = 3–4/group), 89Zr-trastuzumab was administered 24 h after the last day of treatment. The mice were euthanized a day later. Count data were background- and decay-corrected. Tissue uptake, measured in units of percentage injected dose per gram (%ID/g) for each sample, was calculated against the decay-corrected total net activity injected and normalized for tissue weight.
Digital Autoradiography and Microscopy
Digital autoradiography images were obtained as previously described (25), with minor modifications. Tumors were excised and flash-frozen, and 10-μm frozen sections were cut. Sections were then exposed to a phosphor plate for 24 h and subsequently read out at a 50-μm resolution using a BAS-1800II Bio-Imaging Analyzer (FujiFilm Medical Systems). The same sections were then stained with hematoxylin and eosin and imaged using a BX-60 microscope equipped with a CC12 Soft Imaging Systems camera (Olympus America). Images were registered manually using Adobe Photoshop software (version CS5; Adobe Systems).
Sequential sections were fixed in 4% paraformaldehyde and stained for HER2, the nuclear antigen Ki-67, and cleaved caspase 3. Staining was performed using a Discovery XT processor (Ventana Medical Systems). Rabbit polyclonal anti-Ki-67 (0.4 μg/mL; catalog no. VP-K451 [Vector Laboratories]) or anti-cleaved caspase 3 (Asp175) (0.1 μg/mL; catalog no. 9661 L [Cell Signaling]) was used after blocking, followed by biotinylated goat antirabbit IgG (catalog no. PK6101; Vector Laboratories) at a 1:200 dilution and detection with a DABMAP kit (Ventana Medical Systems) according to the manufacturer’s instructions.
Quantitative data were expressed as mean ± SD. Statistical analysis was performed using a 1-way ANOVA test, followed by a Dunnett multiple-comparisons test. A P value of less than 0.05 was considered statistically significant.
RESULTS
Sensitivity of Afatinib
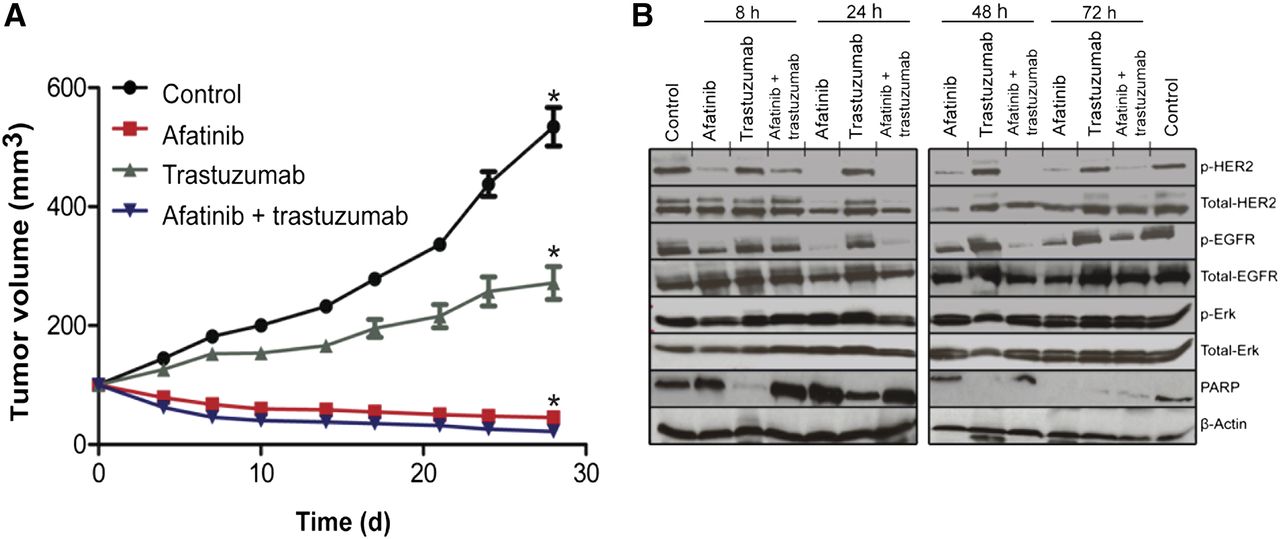
The efficacy of afatinib, trastuzumab, and the combination of afatinib and trastuzumab was examined in an NCI-N87 xenograft model; through fluorescence in situ hybridization and protein overexpression (immunohistochemistry), it was demonstrated that this model harbored HER2 gene amplification (Supplemental Figs. 1 and 2A). Although these tumors were relatively refractory to trastuzumab, afatinib monotherapy led to dramatic tumor volume regression within 4 d and near-complete tumor resolution after 21 d of treatment (Fig. 1A). We anticipated that together these agents would shrink tumors as was previously demonstrated with the combination of afatinib and cetuximab (a monoclonal antibody directed against EGFR) in an EGFR-driven lung cancer model harboring the T790 M mutation (26).The response with afatinib single-agent therapy in the NCI-N87 HER2-amplified model was so robust that the addition of trastuzumab to afatinib did not affect the overall potency of the treatment. Within 24–48 h, afatinib treatment correlated with downregulation of total HER2, p-HER2, p-EGFR, and induction of apoptosis as evidenced by cleavage of poly (ADP-ribose) polymerase in HER2-positive NCI-N87 xenografts (Fig.1B). Similarly, a decrease in total HER2 expression from baseline immunohistochemistry 3+ to immunohistochemistry 0/1+ was noted by immunohistochemical analysis of NCI-N87 tumors (24 h after a single dose of afatinib [25 mg/kg], with recovery of the signal [HER2 immunohistochemistry 2+] 24 h later) (Supplemental Figs. 2A–2C).

Effects of afatinib therapy in HER2-positive gastric cancer NCI-N87 xenograft. (A) Athymic nude mice bearing NCI-N87 tumors were treated (10 mice per group) with vehicle alone (intraperitoneally daily), afatinib (25 mg/kg orally daily), trastuzumab (20 mg/kg intravenously once a week), and combination of afatinib (25 mg/kg orally daily) with trastuzumab (20 mg/kg intravenously once a week). Tumor volume was measured twice a week after onset of treatment. (B) Western blot analyses of tumors harvested from HER2-positive NCI-N87 xenografts treated with afatinib (25 mg/kg) orally × 1 dose, specimen collected at 8, 24, 48, and 72 h after a single dose of afatinib. *P < 0.05, for afatinib vs. vehicle or trastuzumab alone.
Radiochemistry and Characterization of 89Zr-Trastuzumab
Conjugation of trastuzumab to desferrioxamine was achieved via an N-succinimidyl linkage with a monoclonal antibody:desferrioxamine ratio of approximately 1:4 as reported previously (19,20). Efficient labeling of trastuzumab with 89Zr proceeded with high radiochemical yields of more than 70% and purities of more than 99%. The specific activity was determined to be approximately 105.5 ± 1.9 MBq/mg (2.82 ± 0.05 mCi/mg). The radiolabeled trastuzumab retained its immunoreactivity for HER2 by approximately 86.4 ± 0.44%.
Specificity of 89Zr-Trastuzumab for HER2-Positive Gastric Tumor Through PET and Biodistribution
PET imaging with 89Zr-trastuzumab proved highly specific for HER2-positive gastric tumors, whereas 18F-FDG and 18F-FLT PET were unable to differentiate HER2-positive from HER2-negative tumors. In vivo small-animal imaging with 18F-FDG and 18F-FLT, followed by sequential imaging with 89Zr-trastuzumab on mice bearing NCI-N87 HER2-positive and MKN74 HER2-negative xenografts, showed excellent tumor accumulation of 89Zr-trastuzumab for the HER2-amplified lesion. HER2-positive tumors were strongly PET-avid for 89Zr-trastuzumab (Fig. 2), whereas HER2-negative tumors showed minimal 89Zr-trastuzumab uptake. ROIs drawn from sequential 89Zr-trastuzumab PET images of HER2-positive tumors display an uptake of 9.1 ± 2.1 %ID/g at 4 h after injection, with radiotracer accumulation doubled and peaked at 24 h and tumor-associated radioactivity retained for over 96 h after injection (18.1 ± 2.0 %ID/g, Supplemental Fig. 3A). In contrast, the HER2-negative tumor displayed 6.7 ± 0.8 %ID/g uptake at 24 h and remained at this level throughout the time course. The observed tracer binding seen on ROIs from the HER2-negative xenograft is nonspecific and may be attributed to permeation and enhanced retention of the tracer through the leaky vasculature of the tumor (Supplemental Fig. 3A) (27). In vivo biodistribution data showed a strong correlation with data from PET imaging with 89Zr-trastuzumab (Supplemental Fig. 3B), demonstrating high and specific uptake in HER2-positive tumors. At 24 h after injection, 21.9 ± 3.7 %ID/g tumor accumulation was observed. Tumor-associated radioactivity was retained over 48 h (24.5 ± 7.5 %ID/g), 96 h (34.4 ± 9.0 %ID/g), and 144 h (36.6 ± 10.1 %ID/g). Coadministration of a 100-μg trastuzumab blocking dose with the radiotracer displayed a 2-fold decrease in tumor uptake (12.2 ± 2.2 %ID/g) at 48 h after injection. In contrast, both HER2-positive and HER2-negative tumors were PET-avid when imaged with 18F-FDG (3.1 ± 0.5 %ID/g for the HER2-positive and 3.2 ± 0.7 %ID/g for the HER2-negative xenografts) and 18F-FLT (8.0 ± 2.9 %ID/g for the HER2-positive and 8.7 ± 3.0 %ID/g for the HER2-negative tumors). We found no correlative agreement between the HER2 status of these tumors and 18F-FDG and 18F-FLT PET (Fig. 2).
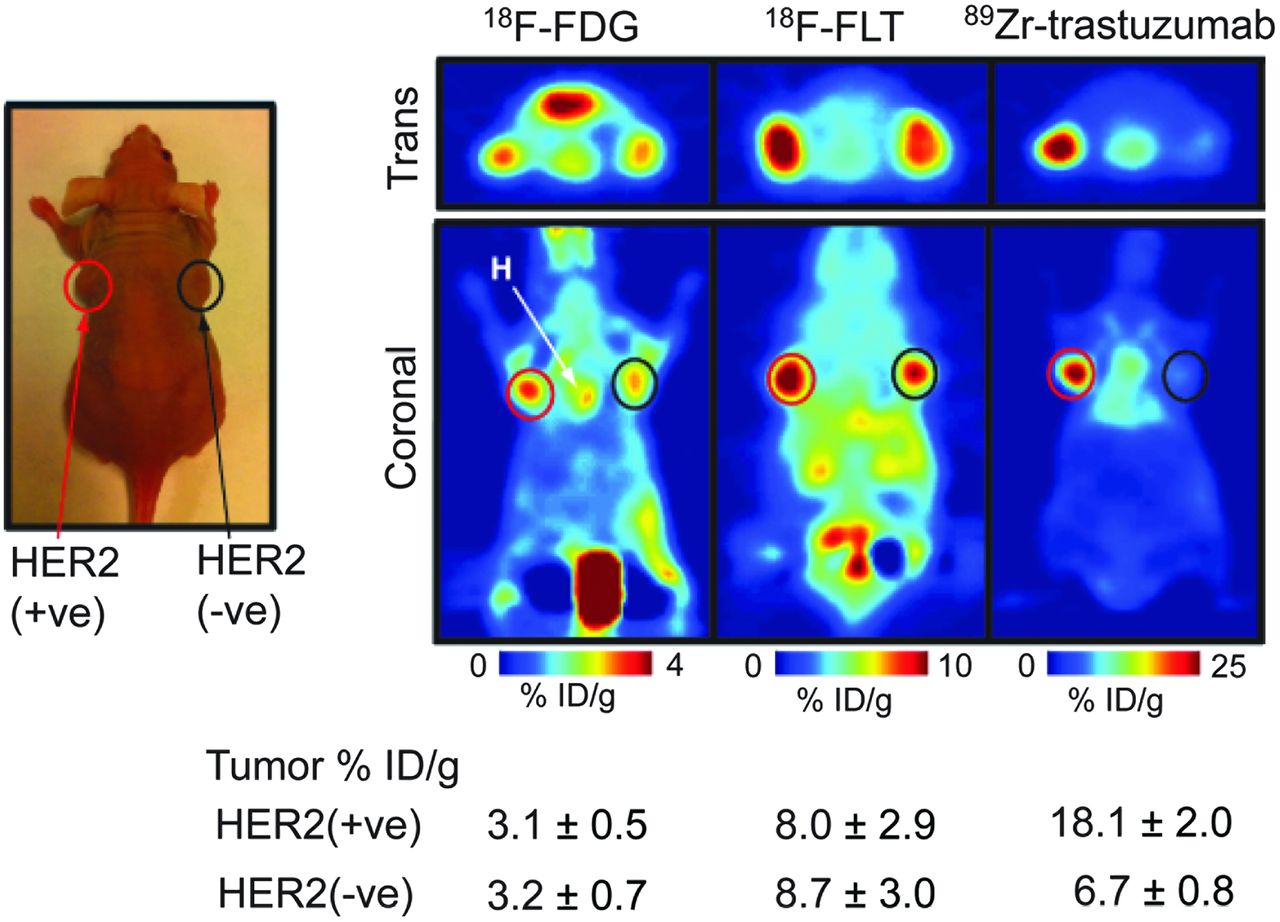
Specificity of 89Zr-trastuzumab for HER2-positive tumors. Coronal 89Zr-trastuzumab, 18F-FDG, and 18F-FLT PET images of athymic nude mice bearing subcutaneous HER2-positive NCI-N87(left) and HER2-negative MKN-74 (right) are shown. ROIs (%ID/g) for 89Zr-trastuzumab, 18F-FDG, and 18F-FLT are indicated. +ve = positive; -ve = negative.
Monitoring of Afatinib Therapy
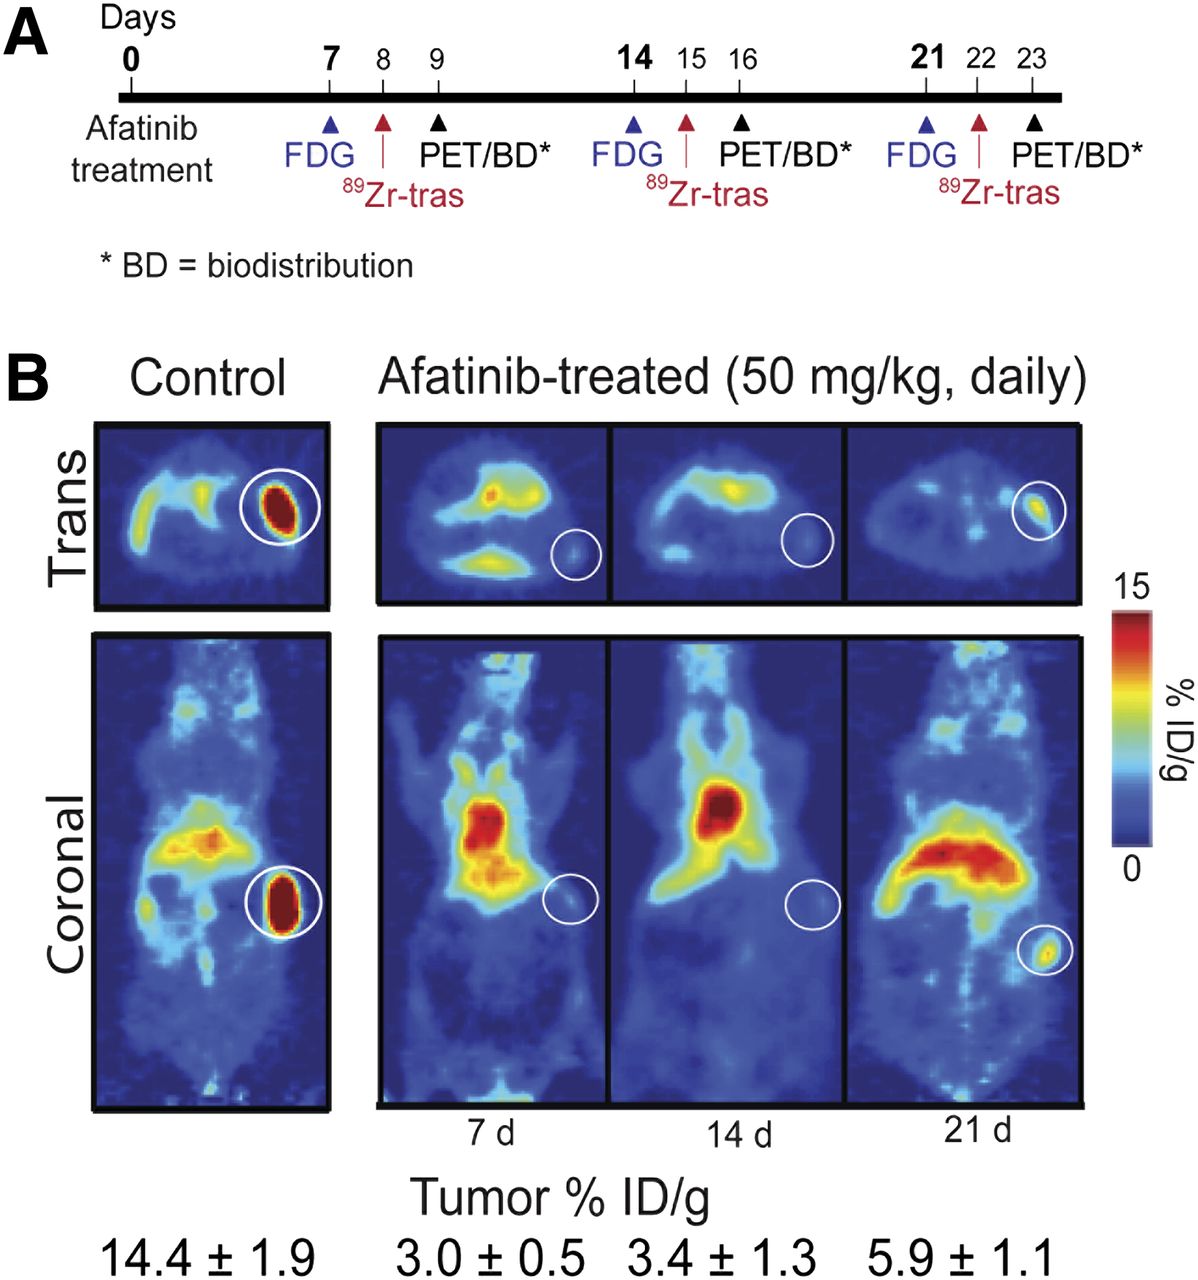
89Zr-trastuzumab PET uptake decreased with afatinib therapy in HER2-positive gastric cancer. To monitor variations in 89Zr-trastuzumab and 18F-FDG uptake after treatment, NCI-N87 xenograft–bearing mice were treated with either vehicle or afatinib daily for 21 consecutive days and monitored by PET imaging once every 7 d (Fig. 3A). The uptake of 89Zr-trastuzumab in tumors and normal organs was also examined with biodistribution experiments at days 7 and 21 (Supplemental Table 1). 89Zr-trastuzumab demonstrated tumor specificity with low uptake in normal organs such as the liver, stomach, and intestines, providing a high tumor–to–normal tissue contrast ratio.

Effects of afatinib therapy in HER2-positive xenograft models. (A) Timeline of imaging and treatment experiments. (B) Coronal 89Zr-trastuzumab PET images of control (left) and afatinib (right)-treated mice bearing subcutaneous HER2-positive NCI-N87 tumors. Trans = transaxial; tras = trastuzumab.
Baseline 89Zr-trastuzumab tumor uptake from PET images was established at 14.4 ± 1.9 %ID/g. Within 7 d of afatinib treatment, we observed a 4-fold reduction in 89Zr-trastuzumab tumor uptake (3.0 ± 0.5 %ID/g, P < 0.001) (Fig. 3B), whereas 18F-FDG uptake remained constant. Figure 4A presents the quantitative ROI data drawn from both 89Zr-trastuzumab and 18F-FDG PET images and measured tumor weights of mice receiving therapy. Although 18F-FDG uptake did not change significantly over time (Fig. 4A), 89Zr-trastuzumab tumor uptake decreased, especially over the first 14 d of treatment, mirroring reduction in tumor weight and decrease in total HER2 as measured by immunoblot and immunohistochemistry.
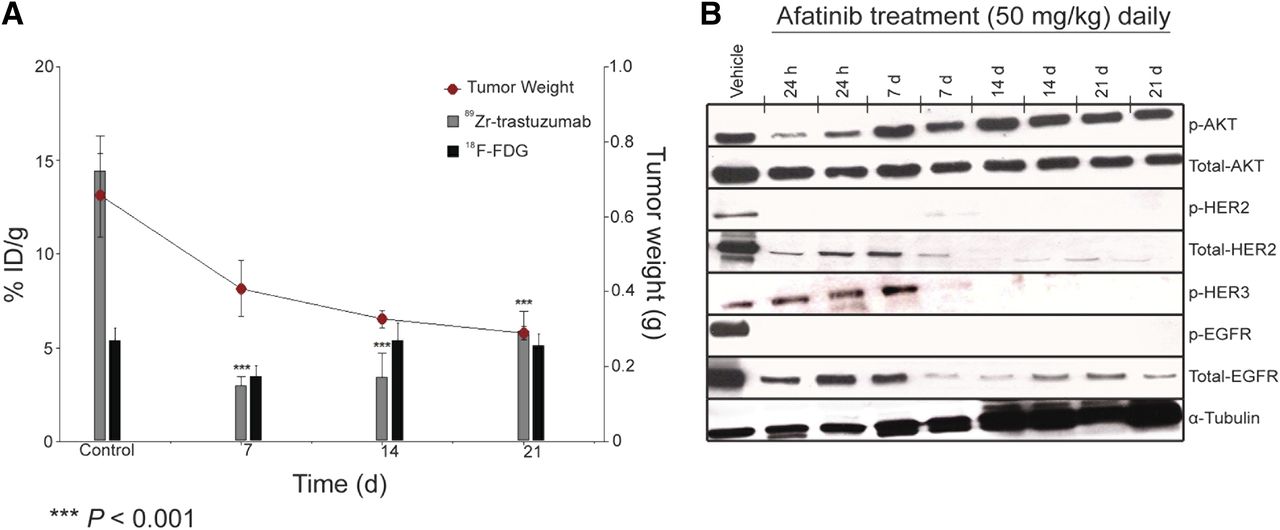
Correlative analysis between 89Zr-trastuzumab and 18F-FDG tumor uptake with tumor weight and HER2 levels. (A) Bar charts show ROIs (%ID/g) for 89Zr-trastuzumab and 18F-FDG uptake in NCI-N87 tumors recorded and superimposed with tumor weight (graph) at baseline, 7 d, 14 d, and 21 d after treatment with afatinib (50 mg/kg daily). (B) Western blot analyses of tumors harvested from HER2-positive NCI-N87 xenografts treated with vehicle or afatinib (50 mg/kg orally daily); specimen collected at 1, 7, 14, and 21 d after treatment.
In biodistribution studies (Supplemental Fig. 4), a decrease in 89Zr-trastuzumab uptake was observed in HER2-positive tumors after 7 d of treatment with afatinib (50 mg/kg), compared with the control group (3.0 ± 0.5 %ID/g vs. 21.0 ± 3.4 %ID/g; P < 0.01). Daily treatment over the 21 d reduced tumor size and uptake to 5.9 ± 4.7 %ID/g (P < 0.01, Fig. 4A). Baseline 89Zr-trastuzumab biodistribution was highest in the tumor (21.0 ± 3.4 %ID/g), compared with normal tissue (e.g., stomach, 0.5 ± 0.1 %ID/g). In HER2-positive tumors, decreased 89Zr-trastuzumab uptake was observed with afatinib therapy, whereas no changes in 89Zr-trastuzumab biodistribution were observed in normal tissues after afatinib (full biodistribution data are presented in Supplemental Table 1). 89Zr-trastuzumab PET results corresponded with tumor size reduction and downregulation of total HER2, p-HER2, total EGFR, and p-EGFR observed with afatinib treatment (Figs. 4A and 4B).
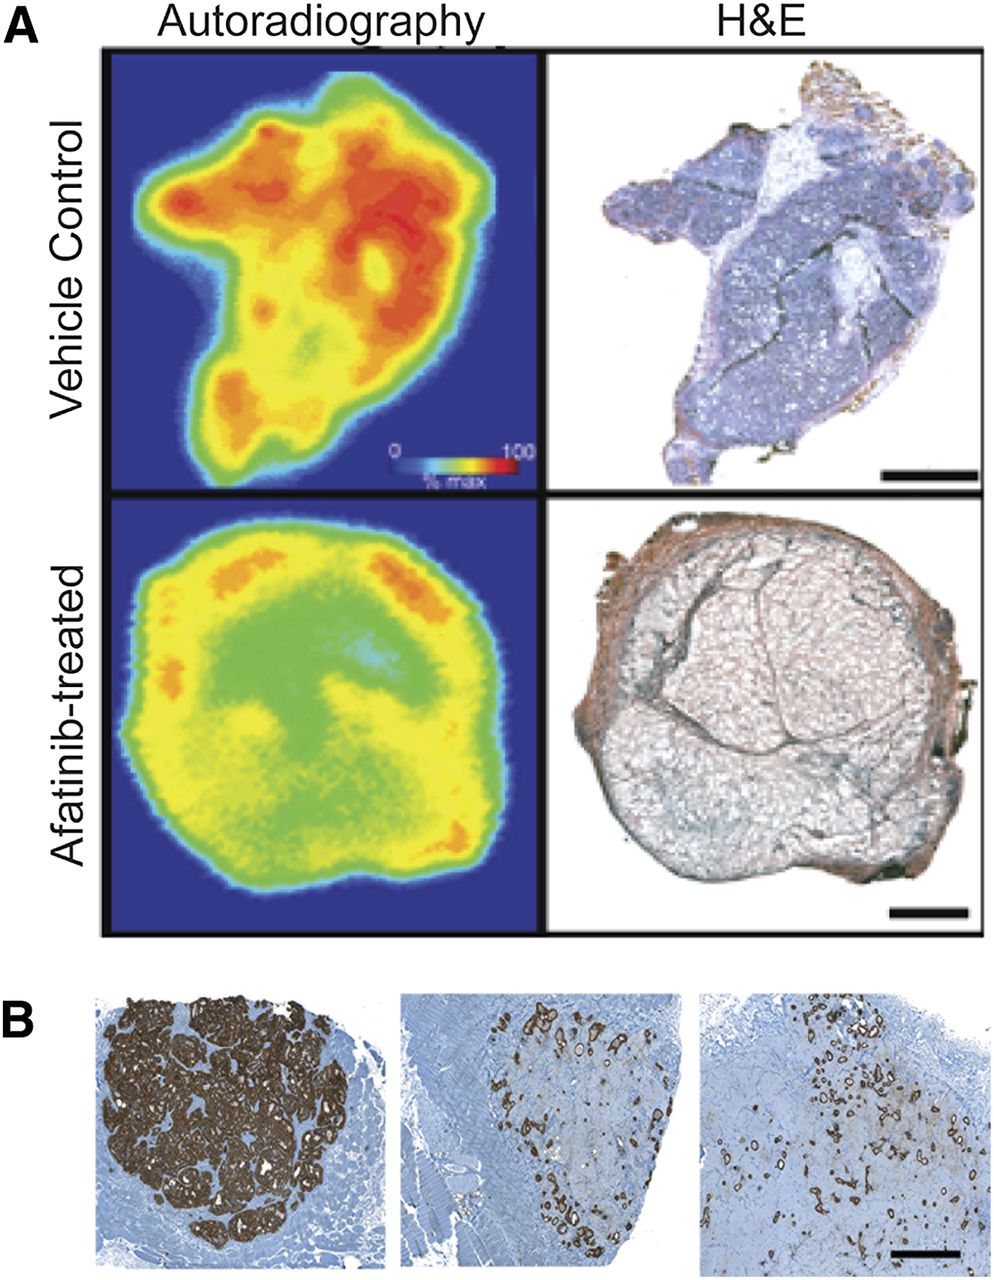
Autoradiographic determination of 89Zr-trastuzumab distribution and HER2 histology of HER2-positive xenografts. (A) Frozen sections (10 μm) from NCI-N87 xenografts treated with afatinib (50 mg/kg) or vehicle for 7 d and removed 24 h after administration of 89Zr-trastuzumab. Bar = 2 mm. (B) Representative HER2 immunostaining (brown) of FFPE NCI-N87 tumor sections demonstrating downregulation of HER2 in tumors administered with afatinib (50 mg/kg) at 7 d (middle) and 21 d (right) after treatment, compared with placebo-dosed tumors (left). Bar = 1 mm. H&E = hematoxylin and eosin.
Digital Autoradiography and Immunohistochemistry
Autoradiographic determination of 89Zr-trastuzumab distribution in afatinib-treated tumors revealed uptake primarily in peripheral tumor regions containing vascularized capsular and stromal tissues. In contrast, localization of 89Zr-trastuzumab in the vehicle-treated control tumors was seen in regions comprising mainly tumor cells (Fig. 5A). A look at the histology of treated and untreated tumor sections displayed decreased staining of afatinib-treated tumors, compared with that of control tumors (Fig. 5B). This distribution pattern was consistent with the imaging data in Figure 3B, where a reduction in HER2 expression after afatinib treatment was accompanied by a reduction in 89Zr-trastuzumab binding. Immunohistochemical examination of tumor sections for the proliferation marker Ki-67 (Supplemental Fig. 5) revealed reduction in the number of proliferating tumor cells after afatinib, whereas the apoptosis marker cleaved caspase 3 revealed no significant differences between treated and control samples (data not shown). These data suggest that afatinib-mediated reduction in tumor growth observed in these tumor models could be attributed to the inhibition of cellular proliferation rather than direct cytotoxicity. Interestingly, the recovery of 89Zr-trastuzumab tumor–associated uptake and HER2 expression seen after 14 and 21 d of afatinib treatment appears to correspond with increasing Ki-67 staining seen in these tumors and implies a link between HER2 expression and proliferative status, which could be visualized using 89Zr-trastuzumab.
DISCUSSION
In phase II clinical trials evaluating antitumor activity of a chemotherapeutic, drug dose is usually based on toxicity and the maximum tolerated dose determined in phase I studies. Although this approach applies to cytotoxic chemotherapy, it is not ideal for molecularly targeted agents tailored to specific target engagement and inhibition (28). Pre- and posttreatment tumor biopsies are now increasingly collected in clinical trials for biomarker development and to characterize the effects of targeted drugs on a molecular level, but these provide only static information on the status of a marker in a small part of the tumor and disregard the heterogeneity within remaining tumor tissue and metastases (29).
In HER2-positive esophagogastric cancer, the heterogeneity of HER2 expression within primary tumors and metastasis is a particular challenge (3). Moreover, organ distribution of HER2-targeted agents (e.g., trastuzumab) varies in each patient and is heavily affected by the tumor load, which may contribute to variation in patient responses (30,31). We need a pharmacodynamic biomarker that can noninvasively assess target engagement and reflect functional effects of targeted agents in the entire tumor and all metastases in patients over time.
Assessment of pharmacodynamic effects of chemotherapeutics with PET imaging using probes specific to the target is a promising method for accomplishing this objective and may ultimately permit dynamic, patient-specific adjustment of drug dosing. Moreover, a decrease in tumor uptake on PET with treatment may indicate a therapeutic effect at the earliest time point before changes in tumor size appear on CT and will ultimately serve as a predictive biomarker determining which patients are the ones likely to benefit from a particular treatment.
Others have demonstrated that vascular endothelial growth factor PET imaging with 89Zr-ranibizumab allows for serial analysis of angiogenic changes in different areas within a tumor (32). The first-in-human 89Zr-trastuzumab HER2 PET imaging showed excellent visualization and quantification of uptake in HER2-positive tumors (33). Previously, we demonstrated that 89Zr-trastuzumab PET is highly tumor-specific and can be used to monitor response to treatment with a specific inhibitor of heat-shock protein 90 in breast cancer (20). Building on this work, in the present study we evaluated the specificity of 89Zr-trastuzumab, 18F-FDG, and 18F-FLT PET for HER2-positive gastric cancer. Our data demonstrate high tumor uptake of 89Zr-trastuzumab in HER2-positive gastric tumors and minimal nonspecific uptake in HER2-negative tumors, whereas HER2-positive and HER2-negative gastric tumors show equivalent uptake using both18F-FDG and 18F-FLT PET. PET imaging with 89Zr-trastuzumab PET is highly specific for HER2-positive gastric tumors, but 18F-FDG and 18F-FLT PET are unable to differentiate HER2-positive from HER2-negative tumors. Although 18F-FLT PET may be clinically useful, it was not performed during afatinib therapy because the present study was focused on the correlative effects of afatinib on the molecular target—HER2.
Our data establish potent antitumor activity of the single-agent tyrosine kinase inhibitor of EGFR/HER2/HER4, afatinib, in HER2-positive gastric cancer xenografts and the utility of 89Zr-trastuzumab PET instead of 18F-FDG PET as a pharmacodynamic marker of HER2 target inhibition in response to afatinib. Although 18F-FDG uptake in HER2-positive gastric tumors does not change with afatinib therapy, a decrease in 89Zr-trastuzumab uptake was observed in the afatinib-treated group, compared with the control group (3.0 ± 0 %ID/g vs. 21.0 ± 3.4 %ID/g; P < 0.05). This change in radiotracer uptake correlated with downregulation of HER2 activity on immunoblots and immunohistochemistry and decreased tumor size. In chronic myelogenous leukemia, the magnitude of breakpoint cluster region–Abelson tyrosine-protein kinase activity inhibition was found to correlate with clinical outcome (34), highlighting the utility of a pharmacodynamic marker such as 89Zr-trastuzumab PET in establishing the final registration dose as afatinib enters clinical trials in HER2-positive esophagogastric cancer.
Although 18F-FDG PET has the proven ability to monitor pharmacodynamic changes with tyrosine kinase inhibitor therapy in melanoma with vemurafenib (35), gastrointestinal stromal tumors with imatinib (36), and lung adenocarcinoma with erlotinib (37), we demonstrated that 18F-FDG is not specific for HER2-driven tumors and is unable to monitor pharmacodynamic effects of afatinib in HER2-positive gastric cancer. 89Zr-trastuzumab PET provides specific delineation of HER2-positive gastric cancer. 89Zr-trastuzumab has clinical utility as a pharmacodynamic biomarker of HER2 inhibition by afatinib in HER2-positive gastric cancer and may show value as a predictive biomarker by indicating at 7 d which tumors will shrink and which patients will eventually derive clinical benefit from afatinib therapy. Efforts are ongoing to generate a HER2-positive 89Zr-trastuzumab–avid model refractory to afatinib and to determine that in the drug-insensitive tumor model, 89Zr-trastuzumab does not change with afatinib therapy.
We hypothesize that 89Zr-trastuzumab PET may surpass the 18F-FDG PET–guided treatment algorithm for diagnosis, staging, monitoring of treatment response, and personalized selection of drug dose in HER2-positive esophagogastric cancer. An Investigational New Drug application will be submitted to the U.S. Food and Drug Administration for 89Zr-trastuzumab PET for clinical development in HER2-positive gastric cancer patients treated with afatinib in an ongoing phase II study and into the predictive biomarker utility of 89Zr-trastuzumab PET (clinicaltrials.gov; NCT01522768).
CONCLUSION
Here, we have shown that 89Zr-trastuzumab PET, compared with 18F-FDG and 18F-FLT, specifically delineated HER2-positive gastric tumors. Antitumor activity of the small-molecule EGFR/HER2/HER4 inhibitor afatinib has proven more potent than the combination of trastuzumab and afatinib or trastuzumab alone, as supported by immunohistology, Western blot, and tumor size reduction measurements. Furthermore, through PET and biodistribution studies, 89Zr-trastuzumab displayed remarkable potential to noninvasively measure the functional effects of afatinib, affording an early predictor of response within and as early as 7 d of therapy, compared with 18F-FDG. Hence, the utility of 89Zr-trastuzumab is extended beyond plain detection and diagnosis of HER2-positive lesions, affording improved patient care and management.
DISCLOSURE
The costs of publication of this article were defrayed in part by the payment of page charges. Therefore, and solely to indicate this fact, this article is hereby marked “advertisement” in accordance with 18 USC section 1734. This study was supported in part by Geoffrey Beene Cancer Center Grant, Boehringer Ingelheim, Germany, and the Office of Science–U.S. Department of Energy (award DE-SC0002456). This study was presented in part at ASCO Molecular Marker Meeting, Hollywood, Florida (2010), and at the ISRS Meeting, Amsterdam, Netherlands (2011). No other potential conflict of interest relevant to this article was reported.
Footnotes
↵* Contributed equally to this work.
Published online Apr. 11, 2013.
- © 2013 by the Society of Nuclear Medicine and Molecular Imaging, Inc.
REFERENCES
- Received for publication June 19, 2012.
- Accepted for publication November 27, 2012.


Jump to section
Related Articles
Cited By...
- Feasibility of Gastric Tumor Xenograft (GTX)-derived Cell Lines for Individualized Anti-cancer Drug Screening
- Caveolin-1 temporal modulation enhances trastuzumab and trastuzumab-drug conjugate efficacy in heterogeneous gastric cancer
- In Vitro and In Vivo Efficacies of the EGFR/MEK/ERK Signaling Inhibitors in the Treatment of Alveolar Echinococcosis
- Temporal Modulation of HER2 Membrane Availability Increases Pertuzumab Uptake and Pretargeted Molecular Imaging of Gastric Tumors
- EGFR and MET Amplifications Determine Response to HER2 Inhibition in ERBB2-Amplified Esophagogastric Cancer
- PET Imaging of Receptor Tyrosine Kinases in Cancer
- Afatinib Is a New Therapeutic Approach in Chordoma with a Unique Ability to Target EGFR and Brachyury
- Pharmacokinetics, Biodistribution, and Radiation Dosimetry for 89Zr-Trastuzumab in Patients with Esophagogastric Cancer
- Harnessing Preclinical Molecular Imaging to Inform Advances in Personalized Cancer Medicine
- Molecular Imaging and Quantitation of EphA2 Expression in Xenograft Models with 89Zr-DS-8895a
- Lapatinib in Gastric Cancer: What Is the LOGiCal Next Step?
- Imaging-Based Treatment Adaptation in Radiation Oncology
- Genomic alterations in BCL2L1 and DLC1 contribute to drug sensitivity in gastric cancer
- A Urokinase Receptor-Bim Signaling Axis Emerges during EGFR Inhibitor Resistance in Mutant EGFR Glioblastoma
- Early Assessment of Tumor Response to Gefitinib Treatment by Noninvasive Optical Imaging of Tumor Vascular Endothelial Growth Factor Expression in Animal Models
- Glypican-3-Targeted 89Zr PET Imaging of Hepatocellular Carcinoma
- Glypican-3-Targeted 89Zr PET Imaging of Hepatocellular Carcinoma: Where Antibody Imaging Dares to Tread