


Abstract
Quantitative radionuclide studies of bone using the short-lived tracers 18F-fluoride and 99mTc-methylene diphosphonate (MDP) are an alternative method to biochemical markers of bone turnover for investigating the dynamic state of the skeleton. In this study we evaluated their use to quantify bone turnover in women receiving antiresorptive therapy compared with that of untreated control subjects. Methods: The patients were 69 healthy postmenopausal women. Twenty-six women were receiving hormone replacement therapy (HRT) and 43 were untreated age-matched control subjects. After bolus injection of 18F-fluoride (1 MBq), 99mTc-MDP (1 MBq), 51Cr-ethylenediaminetetraacetic acid (3 MBq), and 125I-labeled human serum albumin (0.25 MBq), multiple blood samples and urine collections were taken between 0 and 4 h. The clearance to bone mineral Kbone was first evaluated using the area under the plasma concentration curve (AUC) on the assumption that the rate constant k4 for the outflow of tracer from bone was negligibly small. AUC values of Kbone were then compared with those found using a compartmental model method that allowed k4 to be fitted as a free parameter. Results: Using the AUC method the mean ± SD for Kbone for the 2 tracers were: 18F-fluoride, 61.8 ± 12.0 mL · min−1 (HRT group) versus 67.2 ± 12.6 mL · min−1 (control group) (P = 0.045); and 99mTc-MDP, 40.3 ± 8.2 mL · min−1 (HRT group) versus 44.2 ± 7.6 mL · min−1 (control group) (P = 0.024). Values for the 2 tracers in individual patients were moderately well correlated (r = 0.76; P < 0.001). Using the compartmental model method, k4 for 18F-fluoride was shown to lie in the range 0–0.0025 min−1 with a best-fit value of 0.0018 min−1. Values of Kbone determined using k4 = 0.0018 min−1 were highly correlated with the AUC values (r = 0.989; SEE = 2.05 mL · min−1) with numeric values that were larger by a factor of 1.53. Analysis of the 99mTc-MDP data was more difficult because of uncertainties in protein binding in the extracellular fluid compartment space. The best fit for k4 was in the range 0.0010–0.0014 min−1 with values of Kbone similar to those found using the AUC method. Conclusion: Values of Kbone determined using the AUC method were able to differentiate between HRT-treated women and postmenopausal women who were not treated and were highly correlated with those determined using a compartmental model method with nonzero values of k4.
Radionuclide studies of bone with short-lived tracers such as 99mTc-methylene diphosphonate (MDP) (1) and 18F-fluoride (2) allow quantitative studies that reflect bone blood flow and osteoblastic activity (3). Various techniques have been described for evaluating whole-skeleton tracer kinetics, including the 24-h whole-body retention (24-h WBR) of 99mTc-MDP (4–6), compartmental modeling to evaluate whole-skeleton plasma clearance of 18F-fluoride or 99mTc-MDP (7–9), and model-independent methods such as the steady-state infusion of 99mTc-MDP (10) or deconvolution using the plasma clearance curve to infer the whole-skeleton impulse function of 18F-fluoride (11,12). An alternative approach to the tracer methods is quantitative imaging based on either gamma-camera studies of 99mTc-MDP (13–16) or PET studies of 18F-fluoride (17–19). These latter techniques allow studies of regional kinetics in selected areas of the skeleton in diffuse metabolic bone diseases such as osteoporosis or hyperparathyroidism or at sites of focal abnormalities in Paget’s disease and metastatic bone disease.
In the past many studies were based on the 24-h WBR investigation (4). Although this test is highly sensitive to a variety of different types of metabolic bone disease, it is also dependent on the glomerular filtration rate (GFR) (3,20,21). This raises the possibility that, particularly in older patients, lower GFR rather than increased bone turnover may be the cause of increases in 24-h WBR (22). An alternative technique first proposed by Charkes et al. (7) and Makler and Charkes (8) is to measure whole-skeleton plasma clearance, a technique that results in an index of skeletal function analogous to the measurement of GFR using 51Cr-ethylenediaminetetraacetic acid (EDTA) (23). To our knowledge, the Charkes method has never been evaluated in clinical practice. In this study we report an investigation of the skeletal kinetics of 99mTc-MDP and 18F-fluoride in postmenopausal women using plasma clearance methods. The objective was to measure the difference in skeletal turnover between women receiving antiresorptive therapy and age-matched control subjects. The data also allow a comparison of the relative merits of 18F-fluoride and 99mTc-MDP as suitable tracers.
MATERIALS AND METHODS
Subjects
The patients were healthy postmenopausal women who 5 y earlier had been referred by their general practitioner for a bone density scan to assess for possible osteopenia and had indicated a willingness to take part in future research studies. After contact by letter and a visit to explain the study, 69 of these patients (mean age, 60.4 y; range, 45–79 y) agreed to take part in this study. At this time, 26 women had been receiving hormone replacement therapy (HRT) for at least 6 mo (mean duration of HRT treatment, 4.6 y; range, 6 mo to 14 y), whereas the remaining 43 women were not taking any treatment that might affect bone turnover.
Study Protocol
The study protocol was designed to evaluate and compare whole-skeleton plasma clearance in HRT-treated and untreated women using 99mTc-MDP (Medronate II; Amersham Health, Amersham, U.K.) and cyclotron-produced 18F-fluoride (St. Thomas’ Hospital PET Centre, London, U.K.). 51Cr-EDTA (Amersham Health) and 125I-labeled human serum albumin (HSA) (Amersham Health) were used to measure GFR and plasma volume, respectively. The study was approved by the Local Research Ethics Committee and the Administration of Radioactive Substances Advisory Committee, and all subjects gave written informed consent.
Patients were instructed to have a light breakfast and rested during the period of the study. Dual x-ray absorptiometry scans of the lumbar spine, femoral neck, and total body were obtained on a QDR-4500 densitometer (Hologic, Bedford, MA) to assess the patients’ bone mineral density. Serum and urine samples were taken to measure biochemical markers of bone formation (serum osteocalcin and serum bone-specific alkaline phosphatase) and bone resorption (urinary deoxypyridinoline) (3). A mixture of 1 MBq 99mTc-MDP, 1 MBq 18F-fluoride, 3 MBq 51Cr-EDTA, and 0.25 MBq 125I-HSA was injected intravenously into a forearm vein, and timed blood samples were taken from the opposite arm at 1, 3, 5, 10, 15, 30, 45, 60, 120, 180, and 240 min after injection through an indwelling venous cannula. Syringes were weighed before and after administration to determine the relative activities used for the patient dose and for making the standard. Patients were asked to drink at least 300 mL of fluids per hour (water, fruit juice, or tea) starting 1 h before injection and complete urine collections were made between 0 and 4 h after injection. For the first 21 subjects, two 2-h collections were made, and for the final 48 patients, four 1-h urine collections were made.
Blood samples were centrifuged and 3-mL aliquots of plasma and whole blood were counted in an automatic γ-counter with duplicate standards and 18F and 51Cr sources for cross-channel correction. Urine collections were weighed to determine urine volume, and 3-mL aliquots of urine were counted with the blood samples. All samples were counted twice, first in the 99mTc and 18F windows using the dual-channel facility on the γ-counter and then again in the 51Cr and 125I windows at least 3 d later when the 2 short-lived radionuclides had decayed. After the counting was finished, all samples and standards were weighed to determine their exact volumes.
Counts were first corrected for background and the cross-channel corrections. For this purpose, a half-life of 27.7 d was assumed for 51Cr to determine the cross-channel correction for 51Cr-EDTA in the 99mTc window 3 d earlier. Corrected counts were then corrected for decay using the elapsed time assuming half-lives of 109.77 min and 6.02 h for 18F and 99mTc, respectively. Finally, counts for all samples were corrected to an exact volume of 3 mL, and plasma and whole-blood concentrations and urinary excretion were determined for each tracer.
Data Analysis
Data analysis to determine the skeletal clearance of 18F-fluoride and 99mTc-MDP was guided by the compartmental model shown in Figure 1. The objective was to measure the skeletal plasma clearance to the bound bone compartment denoted by the macroparameter Kbone (in mL · min−1) (3). A rate constant, k4 (in min−1), was also introduced to allow for tracer backflow from the bound bone phase to plasma. The other features of the model were the renal plasma clearance of tracer (Krenal, in mL · min−1) and an extravascular extracellular fluid compartment (ECF space). As a simplified approach, valid only when k4 is negligibly small, values of Kbone were first estimated by calculating the total whole-body clearance of bone tracer (Ktotal = Kbone + Krenal) by dividing the amount of tracer injected Q by the area under the plasma clearance curve (AUC) (23). Values of Krenal derived from the urine data were then subtracted from Ktotal to give Kbone. Values of Kbone determined in this way are referred to as the AUC approximation.

Compartmental model used to guide analysis of skeletal kinetics of 18F-fluoride and 99mTc-MDP. After intravenous injection into plasma compartment, tracer equilibrates with extravascular extracellular fluid compartment (ECF space) and is cleared from plasma through kidneys and to bone mineral phase in whole bone with clearance rates Krenal and Kbone, respectively. Rate constant k4 is also required to allow for tracer backflow from bound bone compartment. Uppercase symbols denote plasma clearance values (in mL · min−1), and lowercase symbols denote rate constants (in min−1).
For a definitive analysis that avoided the assumption that k4 = 0, we planned to evaluate Kbone and k4 using a commercial modeling program (SAAM II; University of Washington, Seattle, WA). However, compartmental analysis based on the model shown in Figure 1 was unsuccessful. The reason for the failure was believed to be the oversimplification of Figure 1 in treating the entire ECF space as a single compartment, as a result of which the plasma clearance curves contained more exponential terms than allowed by the model. To avoid the resulting errors in Kbone and k4, an alternative method was devised in which values of the bone kinetic parameters were calculated from Figure 1 that were based on the requirement that bone tracer in the ECF space should reach a state of dynamic equilibrium with tracer in plasma by 2 h after injection. This alternative approach to data analysis was adapted from a method applied by Peters et al. (24) to the analysis of renal tracers such as 51Cr-EDTA. In this modified method the apparent volume of the ECF space was defined by subtracting from the initial quantity of tracer injected the amount excreted in urine, bound in bone, or known to be in the vascular system at time t after injection, and dividing by the plasma concentration P(t):
 Eq. 1
In Equation 1 the cumulative urine excretion of tracer U(t) was calculated from the equation:
Eq. 1
In Equation 1 the cumulative urine excretion of tracer U(t) was calculated from the equation:
 Eq. 2
The retention of tracer in the bound bone compartment B(t, Kbone, k4) was calculated from the integral equation:
Eq. 2
The retention of tracer in the bound bone compartment B(t, Kbone, k4) was calculated from the integral equation:
 Eq. 3
The final term in Equation 1 representing tracer in the vascular compartment was calculated by multiplying the plasma volume Vpl by the plasma concentration P(t). On the basis of the hypothesis of tracer equilibration between plasma and ECF, acceptable solutions for Kbone and k4 were those that gave a smoothly rising curve for the ECF space that reached a plateau by 2 h after tracer injection. In practice, values for Kbone were determined by first assuming values of k4 and then using Equation 1 to determine the value of Kbone that gave a curve for the ECF space that was flat between 2 and 4 h as determined by linear regression analysis. The optimum value of k4 was determined by the solution that gave exactly equal ECF spaces for the 2-, 3-, and 4-h blood samples. Values of the equilibrium ECF spaces for 18F-fluoride and 99mTc-MDP in each patient were adjusted for body size by normalizing them to the equivalent ECF space for 51Cr-EDTA determined using Equation 1 with the bone term dropped. Similarly, values of Kbone in each patient were expressed by normalizing them to the AUC approximation value so that the effect of nonzero values of k4 on Kbone could be assessed. Other details of the analysis, including the measurement of plasma volume, the renal clearance of the bone tracers, and the correction for the protein binding of 99mTc-MDP, have been described (25).
Eq. 3
The final term in Equation 1 representing tracer in the vascular compartment was calculated by multiplying the plasma volume Vpl by the plasma concentration P(t). On the basis of the hypothesis of tracer equilibration between plasma and ECF, acceptable solutions for Kbone and k4 were those that gave a smoothly rising curve for the ECF space that reached a plateau by 2 h after tracer injection. In practice, values for Kbone were determined by first assuming values of k4 and then using Equation 1 to determine the value of Kbone that gave a curve for the ECF space that was flat between 2 and 4 h as determined by linear regression analysis. The optimum value of k4 was determined by the solution that gave exactly equal ECF spaces for the 2-, 3-, and 4-h blood samples. Values of the equilibrium ECF spaces for 18F-fluoride and 99mTc-MDP in each patient were adjusted for body size by normalizing them to the equivalent ECF space for 51Cr-EDTA determined using Equation 1 with the bone term dropped. Similarly, values of Kbone in each patient were expressed by normalizing them to the AUC approximation value so that the effect of nonzero values of k4 on Kbone could be assessed. Other details of the analysis, including the measurement of plasma volume, the renal clearance of the bone tracers, and the correction for the protein binding of 99mTc-MDP, have been described (25).
An ambiguity in the use of Equation 1 to study the skeletal kinetics of 99mTc-MDP remained in that it was unclear whether protein binding of MDP in the ECF space could be assumed to be the same as that in the vascular compartment. To deal with this problem the MDP data were analyzed twice, once using the free 99mTc-MDP plasma data in the denominator of Equation 1 (equivalent to the assumption that no protein binding of MDP occurs in the ECF space) and once using the total 99mTc-MDP plasma data (equivalent to the assumption that fractional protein binding of MDP is the same in the vascular and extravascular spaces).
Statistical variables for the 2 patient groups were compared using the Student t test with P < 0.05. Demographic variables were compared using a 2-tailed test, whereas data for the biochemical markers of bone turnover and Kbone were compared using a 1-tailed test because lower values are predicted in the HRT-treated women.
RESULTS
Sixty-nine women completed the 99mTc-MDP, 51Cr-EDTA, and 125I-HSA tracer evaluations. However, results for 18F-fluoride were missing in 4 patients because of production difficulties with the cyclotron. No statistically significant difference was found between the demographic and bone mineral density data for the HRT-treated women and the women who were not treated (Table 1). As expected, results for biochemical markers of bone turnover gave lower values in HRT-treated women, although the difference was statistically significant only for serum osteocalcin (Table 1).
Demographic, Bone Density, Biochemical Markers of Bone Turnover, and Radionuclide Bone Tracer Kinetic Data by Treatment Group
Values for the skeletal plasma clearance of 18F-fluoride and 99mTc-MDP calculated using the AUC approximation for women receiving and not receiving HRT are included in Table 1. For both tracers, AUC estimates of skeletal clearance were statistically significantly lower in women receiving HRT compared with those of the untreated control group (18F-fluoride: 61.8 vs. 67.2 mL/min, P = 0.045; 99mTc-MDP: 40.3 vs. 44.2 mL/min, P = 0.024). Clearance values for the 2 tracers in individual patients were significantly correlated (r = 0.76; P < 0.001).
The relationships between Kbone, k4, and the equilibration ECF space for 18F-fluoride derived using the modified compartmental model method described above are shown in Figure 2A. The results for Kbone and k4 in individual patients were highly correlated and it was not possible to measure these variables reliably and independently. However, a range of acceptable solutions was determined (Fig. 2A, stippled area) using the mean ECF space for all subjects and normalizing Kbone to the AUC value in individual patients. The 4 thumbnail plots in Figure 2A show the ECF space as a function of time at points A, B, C, and D in the (Kbone, k4) plot. An upper limit of k4 ≤ 0.0025 min−1 (point D) was determined because larger values gave ECF space curves that fell rather than rose to reach a plateau value by 2 h after injection. The optimum solution was k4 = 0.0018 min−1 (point B), where the ECF space was exactly flat between 2 and 4 h. Points along the lower boundary of the stippled band in Figure 2A (points A and C) gave ECF space values that increased by 10% between 2 and 4 h and could not be ruled out as possible solutions of the model.

Results of compartmental model analysis for Kbone and k4 for 18F-fluoride (A), 99mTc-MDP assuming no protein binding of MDP in ECF space (B), and 99mTc-MDP assuming protein binding in ECF space is same as that in plasma (C). In each plot, values for Kbone are normalized to values determined using AUC approximation. Stippled bands show range of allowed values of Kbone and k4 based on assumption that bone tracer in plasma reaches equilibrium with ECF space by 2 h after injection. Four thumbnail plots show ECF space curves (Eq. 1) at points A–D. Points on upper boundary of stippled bands correspond to solutions where ECF spaces are equal at 2 and 4 h after injection, whereas points on lower boundary correspond to 10% increase in ECF space between these times. Solutions to right of D are excluded by nonphysiologic behavior of ECF space at times earlier than 2 h.
When the results for Kbone calculated allowing for nonzero values of k4 were compared with the AUC approximation values, they were found to be highly correlated and larger by a factor of 1.5 at the best-fitting solution of k4 = 0.0018 min−1 (Fig. 3). At each value of k4 investigated, values of Kbone remained highly correlated with the AUC approximation with correlation coefficients r = 0.999 for k4 = 0 falling to r = 0.977 at k4 = 0.0025 min−1 and multiplying factors that increased from 1.0 to 1.8 (Fig. 3).

Scatter plot of values of 18F-fluoride skeletal clearance (Kbone) determined using compartmental model method for k4 = 0.0018 min−1 compared with values determined using AUC (area under plasma clearance curve) approximation. Although values of Kbone for k4 = 0.0018 min−1 are 1.5 times larger than AUC approximation values, 2 sets of values are highly correlated (r = 0.989). Correlation coefficients for other values of k4 are indicated.
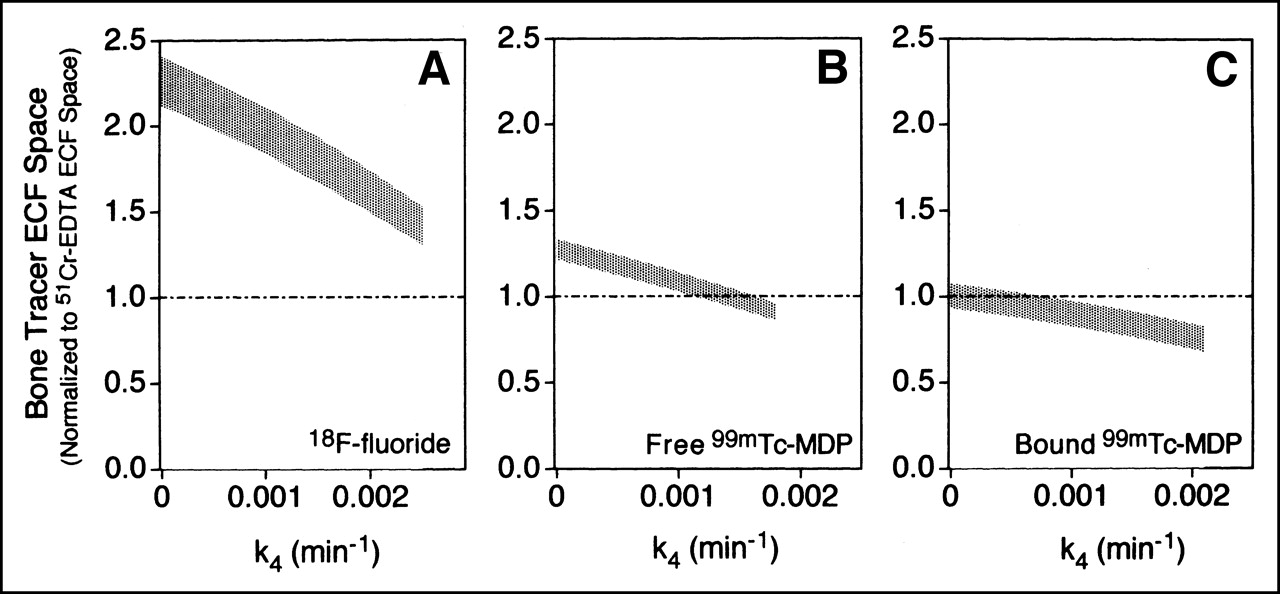
Solutions for the mean ECF space of 18F-fluoride between 2 and 4 h corresponding to the range of solutions given in Figure 2A are shown in Figure 4A, in which the 18F-fluoride ECF space in each patient was normalized to the equivalent 51Cr-EDTA space. Values of the 18F-fluoride space were larger than those for 51Cr-EDTA by a factor that fell from 2.1 to 1.3 as k4 increased from 0 to 0.0025 min−1.

Results of compartmental model analysis for mean bone tracer ECF space between 2 and 4 h after tracer injection for 18F-fluoride (A), 99mTc-MDP assuming no protein binding of MDP in ECF space (B), and 99mTc-MDP assuming protein binding in ECF space is same as that in plasma (C). In each plot, values for bone tracer ECF space are normalized to values for 51Cr-EDTA. Stippled bands correspond to range of acceptable values of Kbone and k4 shown in Figure 2C.
When a similar analysis was performed for 99mTc-MDP, it was necessary to consider solutions in which the MDP in ECF is free 99mTc-MDP (Figs. 2B and 4B) or is protein bound to the same degree as plasma MDP (Figs. 2C and 4C). The upper limits for k4 were 0.0018 min−1 for the free MDP model and 0.0021 min−1 for the protein-bound model with optimum solutions of k4 = 0.0010 and 0.0014 min−1, respectively. The results suggested that the ECF spaces for 99mTc-MDP and 51Cr-EDTA were fairly comparable (Figs. 4B and 4C). The values of Kbone assuming free 99mTc-MDP in the ECF space were similar to the AUC approximation values. However, lower values of Kbone were found if MDP in ECF was protein bound to the same extent as in plasma (Fig. 2C).
DISCUSSION
The objectives of this study were to investigate the use of plasma clearance methods for quantifying the uptake of short-lived radionuclides in bone and to assess the relative advantages of 18F-fluoride and 99mTc-MDP as the tracers for this purpose. Quantitative studies of bone using short-lived radionuclides reflect the effects of bone blood flow and osteoblastic activity on the skeletal accumulation of tracer (3). Previous studies on pre- and postmenopausal women revealed the effects of increased bone turnover after menopause on 24-h WBR (22,26). Treatment of postmenopausal women with antiresorptive therapy is known to return levels of biochemical markers of bone resorption and bone formation in serum and urine to the lower values found in premenopausal women (27). The biochemical marker data in this study were consistent with the expected trends, although the difference between treated and untreated women was statistically significant for only the serum osteocalcin data. This study found statistically significantly lower values of skeletal clearance in HRT-treated women compared with those in control subjects for both bone tracers as judged by the AUC approximation method (Table 1).
Plasma clearance rather than 24-h WBR was preferred for this study because of the dependence of the latter on the GFR (3,20,21). 51Cr-EDTA measurements of the GFR in the healthy postmenopausal women in this study gave a mean GFR of 84 mL · min−1 with a range of 50–132 mL · min−1. The compartmental model used to guide the plasma clearance analysis (Fig. 1) was based on a model proposed by Charkes et al. (7) and Makler and Charkes (8). However, to reduce the number of free parameters and to make the solution more tractable, the Charkes model was simplified by ignoring the bone ECF compartment. Although bone ECF is an important element in the quantitative evaluation of bone-seeking tracers (7,17), the effect of its omission is readily understood in that the simplified model in Figure 1 will return rate constants that reflect the net clearance of tracer to the bone mineral phase (Kbone) rather than the total clearance to the whole bone tissue (Kwhole). From the results of compartmental modeling using tracer techniques (7) and PET (17) that include the bone ECF compartment, it can be estimated that, on the basis of the partitioning of tracer in the bone ECF between deposition in bone mineral and return to the vascular compartment, values of Kbone are approximately 30%–40% of those of Kwhole (3).
When data analysis based on Figure 1 was attempted using compartmental modeling, difficulties were experienced because of oversimplification of the model in assuming a single ECF space. For bone tracers the model predicts a plasma clearance curve that is the sum of 3 exponential components, whereas the equivalent model for 51Cr-EDTA obtained by dropping the bone mineral compartment predicts a biexponential curve. However, when the plasma curves for 51Cr-EDTA, 18F-fluoride, and free 99mTc-MDP were each fitted with a biexponential function, the residuals were remarkably similar for all 3 tracers. Each residual plot showed evidence of 1 or more additional fast exponentials that make a significant contribution during the first 15 min, whereas at time points of ≥30 min the residual plots for all 3 tracers were flat and virtually identical. The close similarity of the residuals for the 2 bone tracers with those for 51Cr-EDTA suggested that the additional early exponentials were associated with the equilibration of tracer in the ECF space and, therefore, that compartmental modeling based on the simplified model shown in Figure 1 was likely to lead to erroneous estimates of k4. As a result of these difficulties, we sought an alternative method of data analysis that minimized the dependence of the evaluations of Kbone and k4 on assumptions about the exact nature of the ECF space. The assumption of tracer equilibration between the ECF space and plasma for 18F-fluoride and 99mTc-MDP similar to that found for renal tracers (24) provided a basis for the necessary modified analysis.
The modified method of data analysis was not sensitive enough to unambiguously determine k4 because a range of values was found to give ECF space values that were almost flat between 2 and 4 h after injection. However, an upper limit of k4 ≤ 0.0025 min−1 for 18F-fluoride was set by the requirement that the 18F-fluoride ECF space increases to reach a plateau value. An optimum value of k4 = 0.0018 min−1 was set by the hypothesis of exact equilibration of tracer with the ECF space by 2 h after injection, which compares with the value of k4 = 0.0013 min−1 reported by Hawkins et al. (17) on the basis of PET imaging studies of the spine. For values of k4 = 0.0018 min−1, values of Kbone were 1.5 times larger than the values with k4 = 0, whereas the equilibrium fluoride ECF space was 1.6 times larger than the equivalent 51Cr-EDTA space. This latter finding was not unexpected given that fluoride is a small diffusible ion that, aided by the weak acid equilibration with HF, can cross cell membranes and appear in transcellular fluid spaces (3,28).
An analysis for 99mTc-MDP equivalent to that performed for 18F-fluoride was more difficult because of uncertainties over the degree of protein binding for tracer in ECF. The values of k4 for 99mTc-MDP were in the range 0.0010–0.0014 min−1. Previous studies have suggested smaller values, although it is difficult to be absolute about this because of the longer time scales of these measurements (1,29). Our analysis suggested values of equilibrium ECF volume for 99mTc-MDP comparable to those of 51Cr-EDTA, a result that is consistent with the other similarities between the 2 tracers (30,31). The results for Kbone were similar to, or perhaps rather lower than, values determined using the AUC approximation depending on the degree of protein binding in the ECF space.
This study had several limitations. First, the estimates of the renal clearances of the bone tracer analysis relied on urine collections that are potentially unreliable because of failure to include tracer in the residual urine volume. For this reason it was important to correct for any urine incompleteness using the 51Cr-EDTA data (25). A second limitation was the reliance on urine data instead of direct measurements on plasma to estimate the 99mTc-MDP protein binding. In retrospect it would have been useful to verify the MDP protein-binding correction inferred from the 99mTc-MDP and 51Cr-EDTA renal clearance data (25). The principal limitation was probably the difficulty in determining Kbone and k4 independently in individual patients, which made it necessary to evaluate Kbone as a function of k4. A more robust analysis might be obtained by combining plasma clearance and imaging data to set tighter constraints on the parameter space (17). Finally, as with all kinetic studies relying on venous blood sampling, more accurate evaluations would have been obtained using arterial samples (32).
This study together with a previous publication (25) allowed an assessment of the relative merits of 18F-fluoride and 99mTc-MDP for bone kinetic studies. Use of 18F-fluoride is restricted by its limited availability; the short half-life, which limits the duration of studies and hence the ability to measure k4; and the need to ensure that patients are well hydrated so that renal clearance is stabilized (25). In contrast, kinetic studies using 99mTc-MDP require measurements of the protein binding of MDP in plasma and are limited by uncertainties over the degree of protein binding in the ECF space. Further progress requires the accurate measurement of k4 in individual patients, which is probably best achieved by combining plasma clearance methods with quantitative imaging studies of bone uptake curves.
CONCLUSION
In this study values of Kbone determined using the AUC method (equivalent to assuming k4 = 0) were able to differentiate between HRT-treated and nontreated postmenopausal women using 18F-fluoride and 99mTc-MDP as the bone tracers. Using a compartmental method modified to improve the handling of tracer in the ECF space, limits were set on the allowable range of values of k4 for both bone tracers, and the associated values of Kbone were shown to be highly correlated with those determined using the AUC method.
Acknowledgments
This study was partly supported by the National Osteoporosis Society.
Footnotes
Received Jun. 19, 2001; revision accepted Nov. 19, 2001.
For correspondence or reprints contact: Glen M. Blake, PhD, Department of Nuclear Medicine, Guy’s Hospital, St. Thomas St., London, SE1 9RT, United Kingdom.
E-mail: glen.blake{at}kcl.ac.uk
REFERENCES
In this issue


Jump to section
Related Articles
Cited By...
- Quantitative Radionuclide Studies of Bone
- Quantitative Measurements of Bone Remodeling Using 99mTc-Methylene Diphosphonate Bone Scans and Blood Sampling
- Skeletal PET with 18F-Fluoride: Applying New Technology to an Old Tracer
- Validation of a Blood-Sampling Method for the Measurement of 99mTc-Methylene Diphosphonate Skeletal Plasma Clearance
- Validation of Ultrafiltration as a Method of Measuring Free 99mTc-MDP