


Abstract
Quantitative studies of bone using 99mTc-methylene diphosphonate (99mTc-MDP) have a potentially valuable role in investigating the treatment of patients with metabolic bone disease. In this study we compared 3 different methods of measuring whole-skeleton 99mTc-MDP plasma clearance (Kbone) in 12 osteoporotic postmenopausal women (mean age, 67.3 y) before participation in a clinical trial of an osteoporosis therapy. The aim was to compare the consistency and accuracy of the 3 methods before their use in evaluating the subjects' response to treatment. Methods: Subjects were injected with 600 MBq 99mTc-MDP and 3 MBq 51Cr-ethylenediaminetetraacetic acid (51Cr-EDTA) and whole-body bone scan images were acquired at 10 min, 1, 2, 3, and 4 h. Two-minute static images of the thighs were acquired immediately after the 1- to 4-h whole-body scans. Six blood samples were taken between 5 min and 4 h, and free 99mTc-MDP was measured using ultrafiltration. The glomerular filtration rate (GFR) was estimated from the 51Cr-EDTA plasma curve. The methods used to evaluate Kbone were (a) the area-under-the-curve (AUC) method, in which the GFR measurement was subtracted from the total (bone plus renal) clearance (Ktotal) measured from the free 99mTc-MDP plasma curve; (b) the modified Brenner method, in which 99mTc-MDP renal clearance estimated from the whole-body counts was subtracted from the total clearance measured from the rate of elimination of tracer from soft tissue; and (c) the Patlak plot method, which was also used to derive regional values of Kbone for the skull, spine, pelvis, arms, and legs. Results: There was good agreement between the 3 methods of measuring Kbone. (mean Kbone ± SD: AUC method, 30.3 ± 6.4 mL·min−1; Brenner method, 31.1 ± 5.8 mL·min−1; Patlak method, 35.7 ± 5.8 mL·min−1). The correlation coefficients between the methods varied from r = 0.767 (P = 0.004) to r = 0.805 (P = 0.002). Regional measurements of 99mTc-MDP clearance gave the following percentages of the whole-skeleton clearance: skull, 13.3%; spine, 16.6%; pelvis, 17.2%; arms, 11.1%; legs, 23.7%. Conclusion: The 3 methods gave consistent and accurate measurements of Kbone. The Patlak method can be used to study regional as well as total-skeleton values of Kbone.
Quantitative measurements of bone remodeling have an important role in research studies examining the pathophysiology of metabolic bone diseases and the response of patients to treatment (1–5). The most accurate technique for quantifying bone remodeling is through a bone biopsy performed after double tetracycline labeling (6,7). However, this technique is invasive, is limited to a single site (the iliac crest), and, when used to assess response to treatment, requires the patient to undergo serial bone biopsies. A simpler and more widely used technique for studying bone remodeling is the measurement of biochemical markers of bone resorption and bone formation in serum or urine (8–10). However, the variability of biochemical marker measurements limits their use in individual patients (11,12). Also, they measure bone turnover throughout the whole skeleton and are unable to make regional measurements—for example at sites of predominantly trabecular (spine, pelvis) or cortical bone (long bones).
Quantitative radionuclide studies provide an alternative method of studying bone formation that avoids some of the limitations of the methods described (13). Kinetic studies with the short-half-life radiopharmaceuticals 99mTc-methylene diphosphonate (99mTc-MDP) (14) and 18F-fluoride (15) can be used to quantify bone blood flow and osteoblastic activity (13). There is a choice of performing either tracer studies of the whole skeleton or imaging studies at selected sites. The best-known quantitative bone radionuclide investigation is the 24-h 99mTc-MDP whole-body retention (WBR) test (16), and in recent years this examination has been shortened by adapting it for use with the γ-camera (17–19). However, although WBR measurements can be used to investigate a variety of different types of metabolic bone disease, the results are also sensitive to renal function (13,20). This raises the possibility that, particularly in elderly subjects, reduced kidney function rather than increased osteoblastic activity may be the cause of increased WBR.
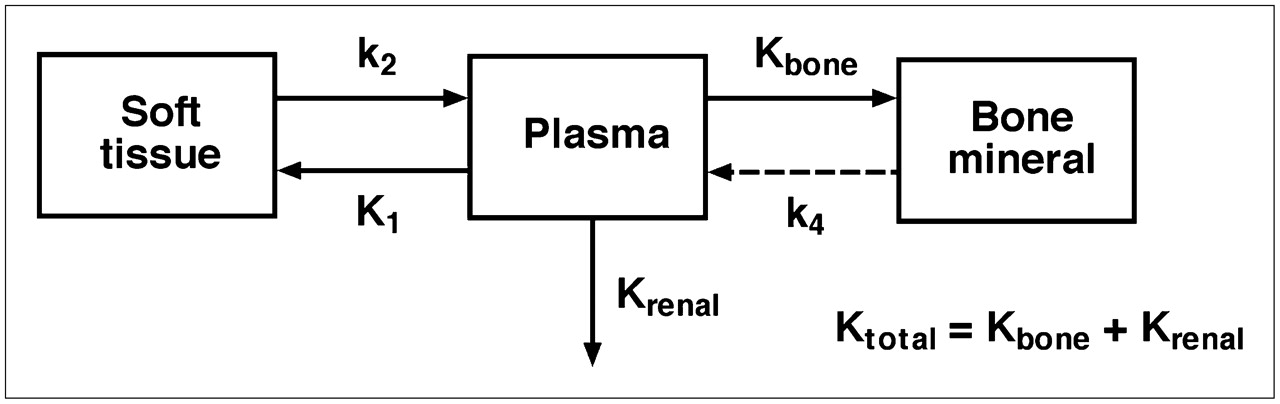
Moore et al. described new methods of quantifying 99mTc-MDP skeletal kinetics that avoid the dependence on renal function by measuring the plasma clearance of tracer to bone (21). These methods result in an index of skeletal function analogous to the measurement of glomerular filtration rate (GFR) using 51Cr-ethylenediaminetetraacetic acid (51Cr-EDTA) (22). The whole-body kinetics of 99mTc-MDP were quantified using the compartmental model shown in Figure 1 with the object of measuring the whole-skeleton plasma clearance, referred to here as Kbone. Moore et al. showed that the rate constant k4 describing the backflow of tracer from the bound bone compartment to plasma is negligibly small and that, in this circumstance, the value of Kbone can be derived from a combination of γ-camera imaging and blood sampling to measure the 0- to 4-h plasma clearance curve of free (nonprotein bound) 99mTc-MDP (21). Three methods of measuring Kbone were described: (a) multiple blood sampling to measure the area-under-the-plasma-clearance-curve (AUC); (b) WBR measured from whole-body scans and soft-tissue retention measured from static images of the thighs combined with the AUC data; and (c) the Patlak plot method (23,24) applied to the blood curve and WBR data.

Compartmental model describing whole-body kinetics of 99mTc-MDP. Total plasma clearance is sum of Kbone and Krenal.
In this article we examine the agreement of the 3 methods in a study of subjects with postmenopausal osteoporosis and show that they lead to consistent and accurate measurements of Kbone. In addition, we have extended the use of the Patlak method to measure regional bone plasma clearance in selected regions of interest (ROIs) drawn on the whole-body bone scan.
MATERIALS AND METHODS
The subjects were 12 osteoporotic postmenopausal women undergoing a baseline 99mTc-MDP bone scan examination. Each subject was injected with 600 MBq 99mTc-MDP for whole-body γ-camera imaging and 3 MBq 51Cr-EDTA to measure GFR (21,25). Chromatography measurements of free pertechnetate (99mTcO4−) and technetium colloid (99mTcO2) 2 h after preparation showed that the radiochemical purity of the 99mTc-MDP exceeded 99%. Before the radionuclide studies, spine and hip bone mineral density were measured using dual-energy x-ray absorptiometry (DXA) to confirm the diagnosis of osteoporosis based on the World Health Organization (WHO) definition of a spine or hip T score of −2.5 or less (26). Subjects with a prior vertebral or nonvertebral fragility fracture were included if they had a T score of less than −2.0. A blood sample was collected to measure the serum concentration of 2 biochemical markers of bone formation, amino-terminal propeptide of type I collagen (PINP) and bone-specific alkaline phosphatase (BSAP). The study was approved by the local research ethics committee.
Blood Measurements
Five-milliliter blood samples were taken at 5, 20, 60, 120, 180, and 240 min after injection via an indwelling venous cannula in the opposite arm to the injection site. Blood samples were centrifuged, and 2 mL of plasma were placed on 10-kDa filters (Amicon Ultra-4; Millipore Corp.) and spun for 30 min at 2,000g to measure the free 99mTc-MDP (27). One-milliliter aliquots of ultrafiltrate and whole plasma were counted in an automatic γ-counter together with 99mTc-MDP standards to measure the plasma concentration curves of free and total (free plus protein bound) 99mTc-MDP. After allowing 48 h for complete decay of the 99mTc-MDP, the plasma samples were recounted with 51Cr-EDTA standards to measure the plasma concentration curve of 51Cr-EDTA.
γ-Camera Measurements
Planar anterior and posterior whole-body images for quantitative analysis were acquired using a dual-head γ-camera with a scan speed of 25 cm/min at 10 min, 1, 2, 3, and 4 h after injection. A standard diagnostic scan (scan speed, 10 cm/min) was performed at 3.5 h for visual assessment of any skeletal disease. Two-minute anterior and posterior static images of the thighs were acquired immediately after the 1- to 4-h scans. WBR of 99mTc-MDP was measured from the geometric mean of the total-body counts after correction for background and urine activity by subtracting counts from ROIs drawn over the bladder and kidneys. After correction for radioactive decay, 99mTc-MDP retention in bone and soft tissue was derived by normalizing to the uncorrected (e.g., including bladder and kidneys) whole-body count at 10 min defined as 100%. The whole-body 99mTc-MDP images were also analyzed for counts in 5 subregions of the whole skeleton (skull, spine, pelvis, arms, and legs) by copying the ROIs defined on the 4-h images onto the earlier whole-body images. Results were expressed as the percentage of injected dose by taking the geometric mean of the counts and normalizing to the 10-min whole-body count.
Soft-tissue retention of 99mTc-MDP was measured by imaging the adductor muscles in both thighs using a modification of the method described by Brenner et al. (18). On the first static image obtained at 1 h, an ROI was drawn over both adductor muscles comprising the area bounded by the pelvis, knees, and both femurs. The same ROI was copied onto the views of the 2- to 4-h static images. After correction for background counts and 99mTc decay, the geometric means of the counts in the 2- to 4-h images were normalized to the counts from the 1-h scan. A method of rescaling the normalized counts to accurately quantify the whole-body soft-tissue retention is described.
Data Analysis
Values of Kbone were quantified using the following 3 methods:
Method 1.
The AUC method (21) is explained in Figure 2A. The plasma clearance curve for free 99mTc-MDP was integrated to evaluate the complete AUC from t = 0 to infinity by extrapolating the terminal exponential fitted to the 2- to 4-h points and the total plasma clearance of free 99mTc-MDP (Ktotal) calculated using Equation 1. In this equation, Q is the quantity of tracer injected at t = 0 and P(t) the plasma concentration of free 99mTc-MDP at time t: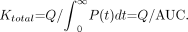 Eq. 1Free 99mTc-MDP is excreted through the kidneys by glomerular filtration (27–29), and, hence, the value of Krenal (Fig. 1) can be derived from the GFR figure evaluated from the 51Cr-EDTA plasma clearance curve (Fig. 2A). After multiplying the raw value of Ktotal by a factor of 0.95 (21) and GFR by a factor of 0.91 (25) to allow for their overestimation arising from the extrapolation of the 2- to 4-h exponentials, the corrected GFR was subtracted from the corrected Ktotal to derive Kbone.

(A) Plasma clearance curves for free 99mTc-MDP and 51Cr-EDTA used to estimate Ktotal and Krenal using AUC method. (B) Plots of whole-body and soft-tissue retention of 99mTc-MDP against AUC used to estimate Ktotal and Krenal using modified Brenner method. (C) Patlak plot using 99mTc-MDP WBR and plasma data. Kbone was estimated from the straight line fitted to 2-, 3-, and 4-h time points.
Method 2.
The modified Brenner method (21) is explained in Figure 2B. The free 99mTc-MDP plasma data were interpolated to estimate the plasma concentrations at the midpoints of the static and whole-body images and the AUC values calculated for these time points. When the γ-camera measurements of WBR in bone plus soft tissue are plotted against AUC, the slope of the resulting straight-line relationship provides an alternative method of estimating the renal clearance of free 99mTc-MDP from the intercept on the AUC axis (Fig. 2B). Similarly, when the γ-camera measurements of soft-tissue retention of 99mTc-MDP are plotted against AUC, the slope of the straight-line relationship reflects the value of Ktotal. The Brenner estimate of Kbone was derived by subtracting the γ-camera estimates of the total and renal clearances (Fig. 2B). Note that the value of Ktotal derived from the intercept on the AUC axis is independent of the normalization of the soft-tissue retention values plotted on the vertical axis and that the absolute figures for whole-body soft-tissue retention can be derived by rescaling the measured numbers to make the intercept on the vertical axis 100% (Fig. 2B). The Brenner method also allowed the estimation of the whole-skeleton retention and net urinary excretion of tracer at each time point by multiplying the plasma clearance figures by the appropriate value of AUC.
Method 3.
The Patlak plot method (21,23,24) is explained in Figure 2C. Figures for the WBR in bone and soft tissue divided by the plasma concentration of total (free plus protein bound) 99mTc-MDP are plotted on the vertical axis, whereas figures for the free 99mTc-MDP AUC divided by the total 99mTc-MDP plasma concentration are plotted on the horizontal axis. Kbone was then derived from the slope of the straight-line relationship fitted to the 2- to 4-h data points (Fig. 2C). This method was also used to estimate the regional values of Kbone for the skull, spine, pelvis, arms, and legs by using the 99mTc-MDP retention data for the γ-camera subregions.
Statistical Analysis
The agreement between the different methods of measuring GFR, Ktotal and Kbone were assessed using scatter graphs and Bland–Altman plots (30). When necessary a P value of 0.05 was used to assess statistical significance.
RESULTS
Demographic data for the 12 women who participated in this study are shown in Table 1. All had either osteoporosis as defined by a spine or hip T score of −2.5 or less or had osteopenia (T score between −2.0 and −2.4) and at least 1 fragility fracture. Apart from 1 subject with borderline high results, serum concentrations of the biochemical markers of bone formation PINP and BSAP were all within the reference ranges (PINP: mean value, 43.2 μg/L; range, 19.9–86.4 μg/L; BSAP: mean value, 13.4 μg/L; range, 7.5–23.0 μg/L). Bone scan images were normal apart from 1 subject in whom a small area of Paget's disease was found in the occipital region of the skull. Although this change was slight (accounting for 5% of whole-body Kbone and 25% of the skull subregion), it was subtracted from the patient's result before the data analysis.
Demographic Data of Study Population
γ-Camera measurements of the renal clearance of free 99mTc-MDP derived from the WBR data were in close agreement with the 51Cr-EDTA GFR measurements with a correlation coefficient r = 0.892 (P = 0.0001) (Fig. 3A). The mean ± SD for the γ-camera GFR results was 66.8 ± 11.6 mL·min−1 compared with 69.7 ± 11.9 mL·min−1 for the 51Cr-EDTA measurements. A Bland–Altman plot gave a mean difference of −2.9 mL·min−1 with 95% limits of agreement of −13.6 mL·min−1 to +7.8 mL·min−1 (Fig. 3B). The mean values of Ktotal ± SD obtained by γ-camera imaging of the soft-tissue retention in the thighs was 97.9 ± 11.5 mL·min−1 compared with 100.0 ± 9.8 mL·min−1 obtained by the AUC method, and the correlation coefficient between the 2 methods was r = 0.943 (P < 0.0001) (Fig. 3C). A Bland–Altman plot gave a mean difference of −2.1 mL·min−1 with 95% limits of agreement of −9.9 mL·min−1 to +5.7 mL·min−1 (Fig. 3D).

(A and B) Scatter plot (A) and Bland–Altman plot (B) for Krenal measurements determined using the AUC and modified Brenner methods. (C and D) Scatter plot (C) and Bland–Altman plot (D) for Ktotal measurements determined using the AUC and modified Brenner methods. In Bland–Altman plots, solid lines represent the line of identity and dashed lines represent the mean and 95% levels of agreement.
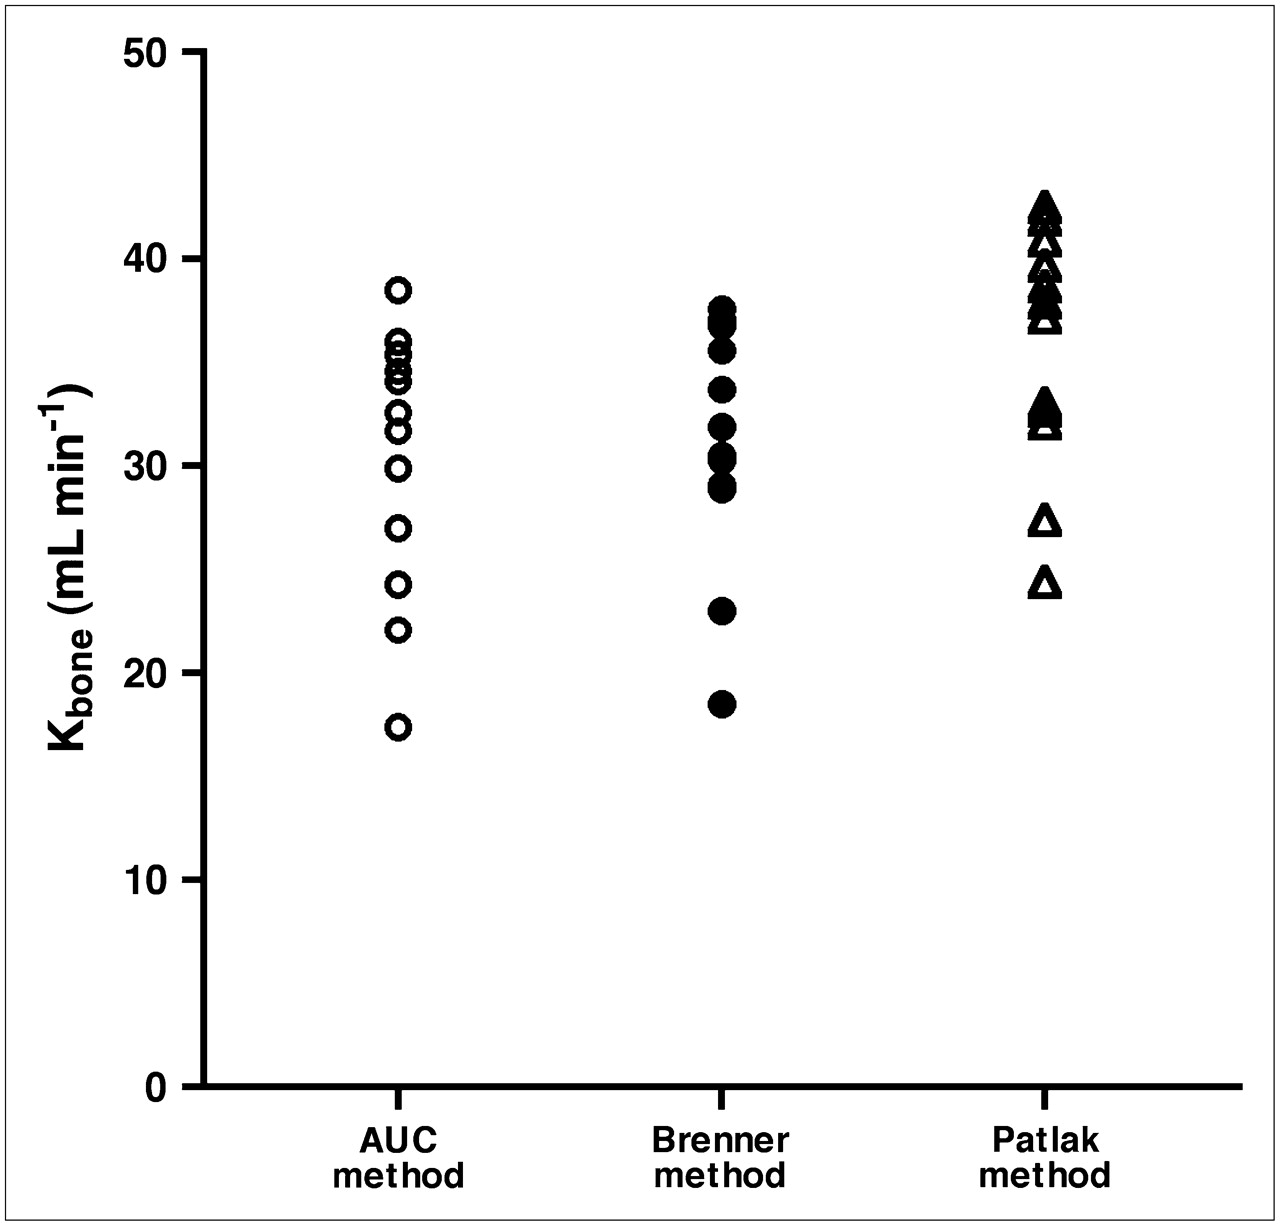
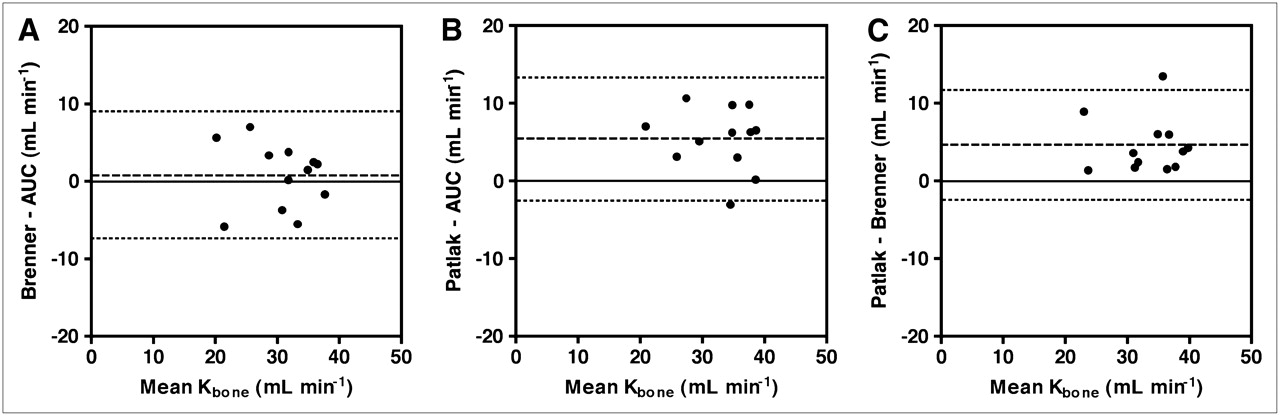
The mean values of Kbone ± SD determined using the 3 methods were (a) AUC method, 30.3 ± 6.4 mL·min−1; (b) Brenner method, 31.1 ± 5.8 mL·min−1; and (c) Patlak method, 35.7 ± 5.8 mL·min−1. Figure 4 shows the individual values of Kbone measured using the 3 different methods for each patient. When the results were plotted against each other the correlation coefficients varied between r = 0.767 (P = 0.004) and r = 0.805 (P = 0.002). The Bland–Altman plots gave a mean difference (95% limits of agreement) of 0.8 mL·min−1 (–7.4 mL·min−1 to +9.0 mL·min−1) between the Brenner and AUC methods (Fig. 5A), 5.4 mL·min−1 (–2.6 mL·min−1 to +13.3 mL·min−1) between the Patlak and AUC methods (Fig. 5B), and 4.6 mL·min−1 (–2.5 mL·min−1 to +11.7 mL·min−1) between the Patlak and Brenner methods (Fig. 5C).

Results for Kbone measured in 12 osteoporotic postmenopausal women using the AUC, modified Brenner, and Patlak plot methods.

(A) Bland–Altman plot for Kbone measurements determined using the AUC and modified Brenner methods. (B) Bland–Altman plot for Kbone measurements determined using the AUC and Patlak methods. (C) Bland–Altman plot for Kbone measurements determined using the modified Brenner and Patlak methods. In Bland–Altman plots, solid lines represent the line of identity and dashed lines represent the mean and 95% levels of agreement.
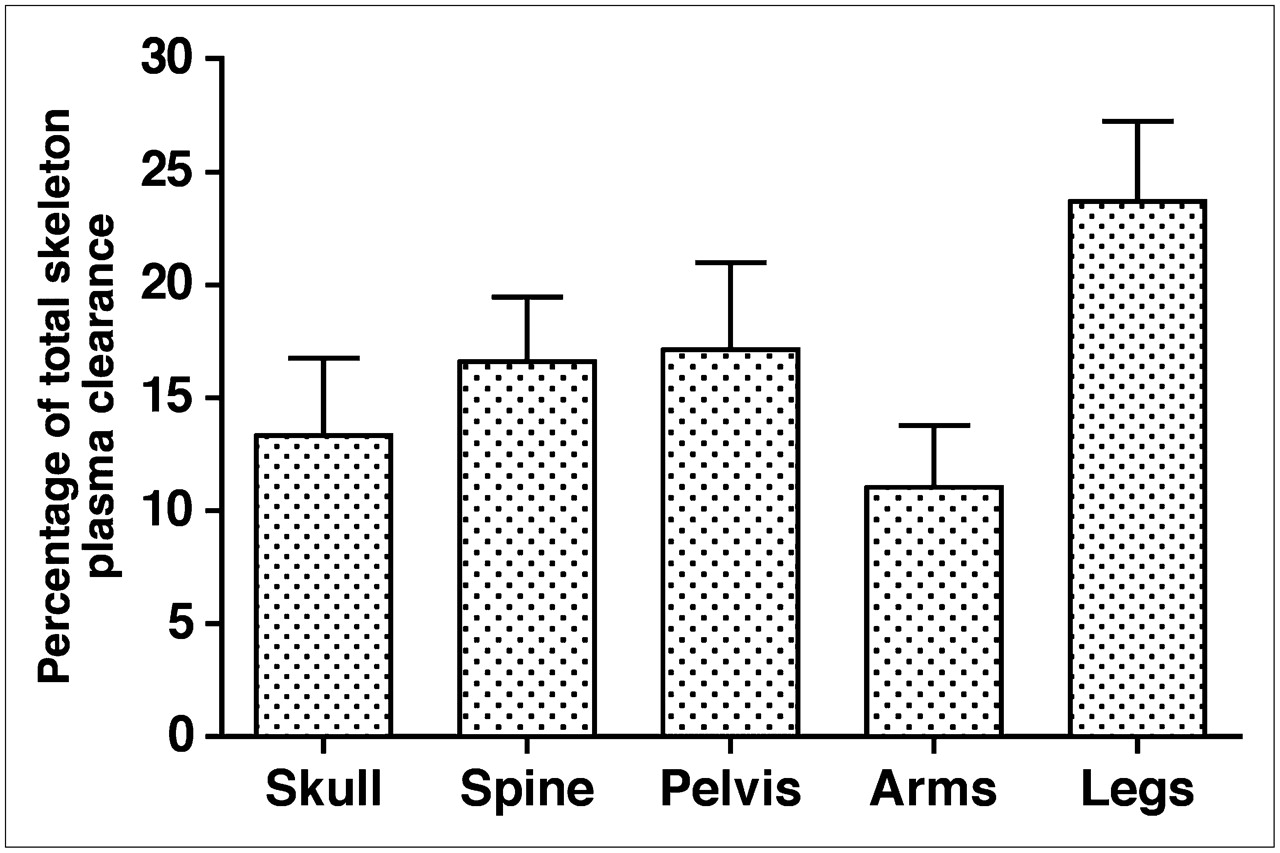
When the Patlak method was used to determine values of Kbone for the different subregions of the whole skeleton and the results expressed as a percentage of whole-skeleton clearance, the mean percentages ± SD were skull, 13.3% ± 3.4%; spine, 16.6% ± 2.9%; pelvis, 17.2% ± 3.8%; arms, 11.1% ± 2.7%; and legs, 23.7% ± 3.5% (Fig. 6). The subregion's analysis excluded the thoracic cage and shoulders, and, therefore, these results add up to <100%.

Results for regional measurements of Kbone derived for skull, spine, pelvis, arms, and legs using the Patlak plot method expressed as percentage of total-skeleton plasma clearance. Bar chart shows mean and SD for 12 subjects.
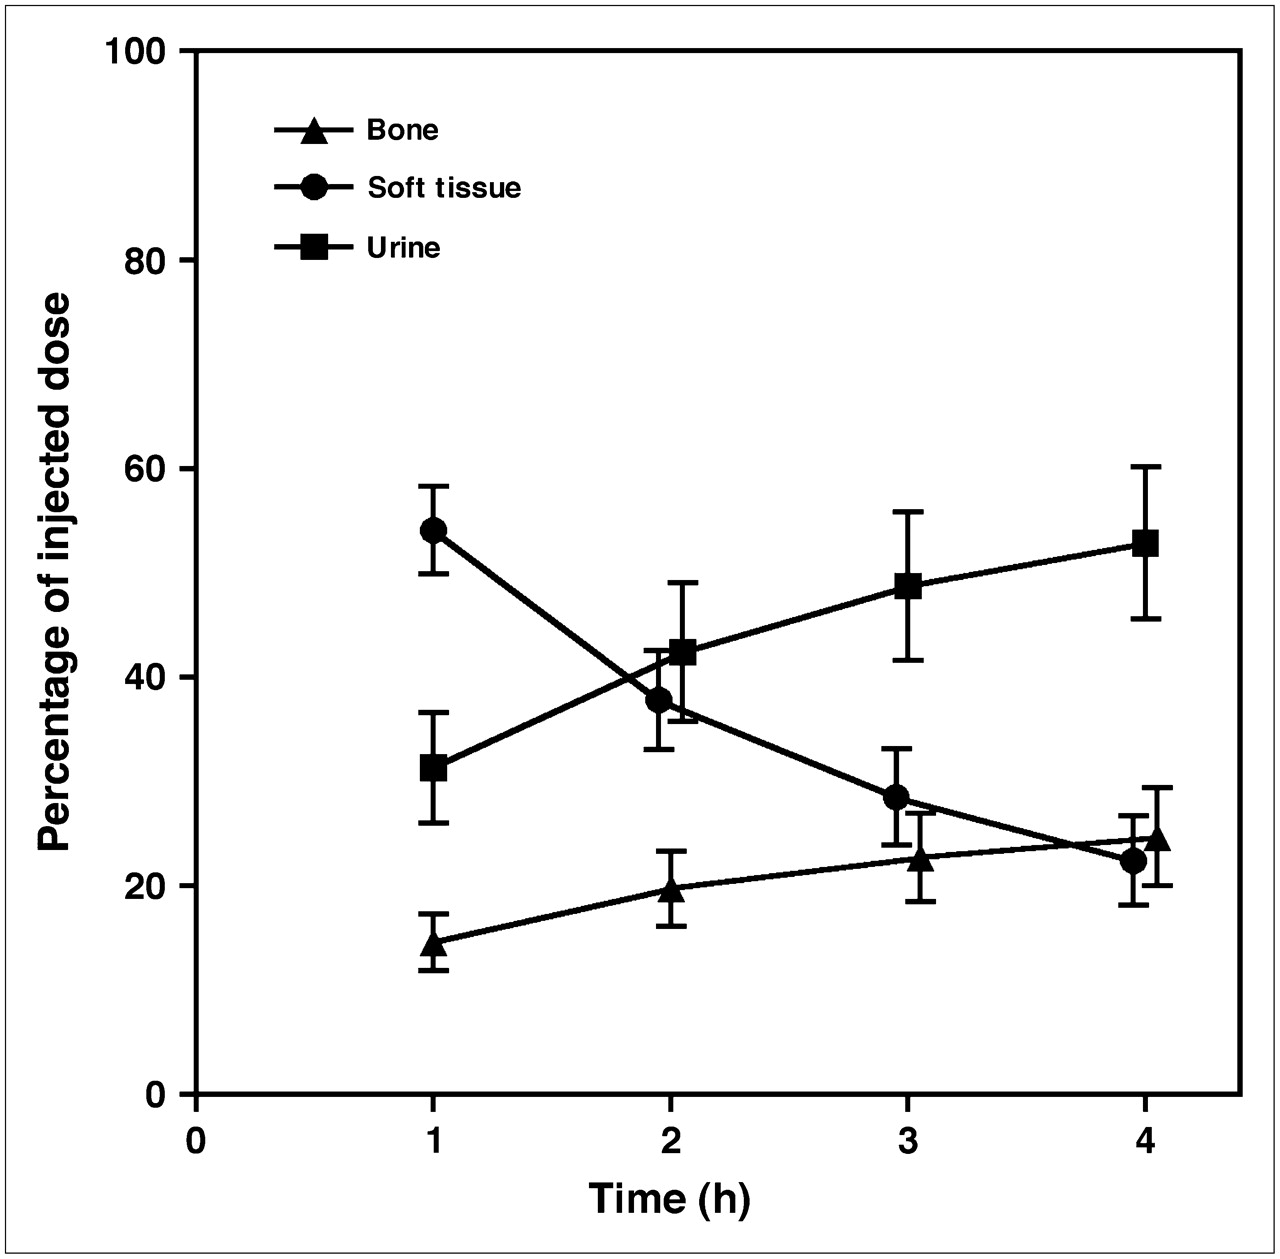
Finally, when 99mTc-MDP retention in whole-body soft tissue measured from the γ-camera images of the thighs was plotted against time, the percentage of tracer retained in soft tissue ± SD decreased from 54.1% ± 4.2% at 1 h after injection to 22.4 ± 4.3% at 4 h (Fig. 7). In the same period the 99mTc-MDP uptake in bone increased from 14.6% ± 2.7% to 24.7% ± 4.7%, whereas the urinary excretion of 99mTc-MDP increased from 31.3% ± 5.3% to 52.9 ± 7.3%.

Results for 99mTc-MDP uptake in bone, soft-tissue retention, and net excretion in urine at 1, 2, 3, and 4 h expressed as percentage of injected dose and derived using the modified Brenner method. Points show mean ± SD for 12 subjects.
DISCUSSION
Postmenopausal osteoporosis is a form of metabolic bone disease frequently associated with increased bone turnover as measured by bone biopsy or biochemical markers (7,10). Although the women in this study were enrolled purely on the basis of the WHO bone densitometric definition of osteoporosis or osteopenia plus fracture, it cannot be assumed that their 99mTc-MDP skeletal clearances are representative of a normal population. Nevertheless, with the exception of 1 subject with a borderline high figure for PINP, the bone formation markers were in the middle of the normal range, whereas the results for Kbone agreed well with values obtained previously in 39 patients referred for a 99mTc-MDP whole-body examination whose scan images showed no evidence of bone disease (21).
The AUC and modified Brenner methods are similar in that both depend on the extrapolation of the plasma measurements made between 0 and 4 h to estimate the terminal values of the AUC for renal and total clearances (Figs. 2A and 2B). Values for Kbone are then obtained by subtracting the renal clearance from the total clearance. The validity of both methods depends on the assumption that the rate constant k4 in Figure 1 is negligibly small (21). Whereas the Brenner method allows a direct measurement of the renal clearance of free 99mTc-MDP from γ-camera WBR measurements, the AUC method is dependent on the assumption that free 99mTc-MDP has the same renal clearance as 51Cr-EDTA (27–29). A limitation of the Brenner method is that the WBR measurements might be affected by differential attenuation associated with the redistribution of tracer between soft tissue and bone between the early and later images. In the present study accurate straight-line relationships were found between γ-camera WBR measurements and the AUC with a mean intercept ± SD on the vertical axis of 104.4% ± 3.3%. It is unclear whether the deviation from the expected intercept of 100% was caused by the effects of differential attenuation or by small errors in the estimation of the AUC contribution before the 5-min blood sample. A paired t test showed that the difference between the AUC and modified Brenner methods of GFR estimation shown in Figure 3B was not statistically significant (P = 0.091). Nevertheless, for the reasons given earlier, a small difference in the 2 estimates of the renal clearance of free 99mTc-MDP might be expected.
There was also close agreement between the AUC and modified Brenner values of Ktotal (Figs. 3C and 3D). As with renal clearance, a paired t test showed that the difference was not significant (P = 0.092). The modified Brenner method is an adaptation of the method originally described by Brenner et al. in which the soft-tissue contribution to the whole-body bone scan counts was quantified on the assumption that soft-tissue counts over the adductor muscles on an early (3 min) whole-body scan reflect 100% of injected tracer in soft tissue (18). The original Brenner method does not allow for the rapid early renal and skeletal clearance of 99mTc-MDP or for the fact that at times earlier than 1 h tracer in soft tissue has not reached equilibration with the vascular system (21). In the modified Brenner method, soft-tissue counts over the adductor muscles are plotted against AUC and the terminal value of the AUC inferred from the intercept on the horizontal axis. In addition, the tracer retention in soft tissue can be inferred by rescaling to make the intercept on the vertical axis 100%. Several explanations are possible for the small difference between the AUC and Brenner figures for Ktotal. If equilibration between blood and soft tissue were not complete by 1 h after injection, the result would be a slight underestimation of Ktotal by the Brenner method. Alternatively, the correction factor of 0.95 applied to the AUC Ktotal values derived from Equation 1 to allow for the error in the assumption that the 2- to 4-h free 99mTc-MDP plasma data represent the terminal exponential may underestimate the true correction required (21).
There was close agreement between Kbone values derived using the 3 methods with results in the range 20–40 mL·min−1 (Fig. 4). Paired t tests showed that although there was no significant difference between the AUC and Brenner figures (Fig. 5A) (P = 0.52), the Patlak figure was higher than the other methods (Figs. 5B and 5C) (P = 0.001 for both methods)—however, the differences were small (∼5 mL·min−1). In the Patlak plot the plasma clearance is given by the asymptotic slope of the graph (23,24). Examination of the individual graphs showed that in 10 of 12 subjects the slope was more shallow for the 3- to 4-h points than the line fitted to the 2-, 3-, and 4-h points (Fig. 2C). When the Patlak figures were recalculated using only the 3- and 4-h data, the mean Kbone value ± SD decreased from 35.7 ± 5.8 mL·min−1 to 33.0 ± 6.9 mL·min−1, at which point the difference between the Patlak and Brenner methods was no longer significant (P = 0.22). Although it could be argued that the Patlak fit to the 3- and 4-h points is probably a more accurate result, it would be necessary to include a 6-h measurement point to avoid the loss of statistical precision, making the method less feasible.
The Patlak method can also be used to derive regional measurements of Kbone in any area of the skeleton. This might be an area of Paget's disease or, in the case of diffuse skeletal changes, subregions of the skeleton containing predominantly cortical or trabecular bone. The 5 ROIs used in the present study (Fig. 6) were chosen to coincide with the subregions used in whole-body DXA scanning (31). Although whole-body DXA scans were not performed, in principle the regional values of Kbone could be compared by normalizing them to the bone mineral content in the same ROI measured on a DXA scan to express them as the plasma clearance per gram of hydroxyapatite.
In the present study a deliberate choice was made to express the results in terms of plasma clearance, as this is a more physiologic way of representing the results than the conventional approach of measuring bone uptakes as a percentage of injected dose (13). The advantage of using plasma clearance to express osteoblastic activity is that it is independent of other factors influencing 99mTc-MDP kinetics, such as renal function (e.g., GFR) or localized bone abnormalities. For example, an area of Paget's disease will compete with normal bone for the finite amount of available tracer, leading to lower plasma concentration, reduced renal excretion, and lower uptake in the rest of the skeleton. In the present study of subjects with normal bone scans, measurements of whole-body skeletal retention will partly reflect GFR values that ranged from 45 to 86 mL·min−1. Finally, in clinical trials of therapeutic agents, plasma clearance measurements will more reliably represent the physiologic effect on bone, whereas uptake measurements will show a reduced dynamic range because of the competition for a finite amount of tracer. Nevertheless, the present methods can be adapted to measure skeletal uptake instead of skeletal clearance, and the 4-h figure of 25% for the mean retention in bone is in good agreement with similar studies (18).
CONCLUSION
Three different methods (AUC; modified Brenner; Patlak plot) for quantifying bone turnover from measurements of whole-skeleton 99mTc-MDP plasma clearance (Kbone) using γ-camera images or blood sampling were compared in 12 postmenopausal women. The 3 methods were in close agreement (mean Kbone ± SD: AUC method, 30.3 ± 6.4 mL·min−1; Brenner method, 31.1 ± 5.8 mL·min−1; Patlak method, 35.7 ± 5.8 mL·min−1). The Patlak method was used to measure regional 99mTc-MDP plasma clearance in subregions of the skeleton that matched those used in whole-body DXA scans. In the future, this method will enable osteoblastic activity to be quantified in localized areas of bone disease and to be normalized to measurements of bone mineral content on DXA scans.
Acknowledgments
The authors acknowledge the support of Eli-Lilly and Company in funding this research.
Footnotes
-
COPYRIGHT © 2008 by the Society of Nuclear Medicine, Inc.
References
- Received for publication October 24, 2007.
- Accepted for publication December 4, 2007.


