


Abstract
Quantitative studies of bone using 99mTc-methylene diphosphonate (MDP) reflect bone remodeling. The simplest method of evaluating 99mTc-MDP kinetics involves taking multiple blood samples and measuring total clearance (Ktotal) from the area under the plasma curve (AUC) and deriving bone clearance (Kbone) by subtracting glomerular filtration rate (GFR) from Ktotal. However, the accuracy of the AUC method is uncertain because of assumptions that the terminal exponential is reached by 2 h and that the rate constant k4, representing the backflow of tracer from bone to plasma, is negligibly small. The aim of this study was to validate the accuracy of the AUC method by comparing Kbone values obtained by that method with those obtained by γ-camera imaging. Methods: Seventy-one patients were injected with 600 MBq of 99mTc-MDP. For the first 22 patients, whole-body images were acquired at 15 min and at 1, 2, 3, and 4 h after injection, whereas the remaining 49 were imaged at 15 min and at 1 and 3 h. Two-minute static images of the thighs were acquired immediately before each whole-body scan. Multiple blood samples were taken between 5 min and 4 h, and free 99mTc-MDP was measured using ultrafiltration. Two γ-camera methods were used to evaluate Kbone: the Patlak plot method and the Brenner method, which is based on measuring soft-tissue uptake in the thighs. The soft-tissue data were also used to measure k4. Results: The soft-tissue data gave a k4 value of 0.0003 min−1 (95% confidence interval, 0−0.0008 min−1). The mean (±SD) 99mTc-MDP Kbone was 56.0 ± 32.4 mL·min−1 with the AUC method, 49.5 ± 32.1 mL·min−1 with the Patlak method, and 42.8 ± 32.0 mL·min−1 with the Brenner method. Correcting the AUC values of Ktotal by factors of 0.95 and 0.90 gave Kbone values in agreement with the Patlak and Brenner methods, respectively. Conclusion: Values of k4 are too small to affect values of Kbone measured using the AUC method. Correcting Ktotal by factors in the range of 0.90−0.95 corrects for the error in the terminal exponential and brings Kbone values measured using the AUC method into agreement with the γ-camera results.
Like all living tissues, the skeleton is continuously renewing itself. Groups of cells called osteoclasts and osteoblasts respectively resorb old bone and lay down new bone in a process referred to as remodeling (1). In skeletal disease, both the rate of remodeling and the balance between bone resorption and bone formation may be altered, and the measurement of these processes is important for understanding the pathophysiology of bone diseases and the effects of treatment.
The most accurate technique for quantifying remodeling is bone biopsy performed after tetracycline labeling (2,3). However, the technique is invasive, is limited to a single site (the iliac crest), and, when used to assess response to treatment, requires multiple biopsies. A simpler technique is the measurement of biochemical markers of bone resorption and bone formation in serum or urine (4,5). However, their usefulness is limited by their poor precision (6).
Quantitative radionuclide studies provide an alternative technique for studying bone formation that avoids some of the limitations of other methods (7). Kinetic studies with the short-half-life radiopharmaceuticals 99mTc-methylene diphosphonate (MDP) (8) and 18F-fluoride (9) reflect bone blood flow and osteoblastic activity (7). Either tracer studies of the whole skeleton or imaging studies of selected sites can be performed. The most widely known quantitative investigation is 24-h whole-body retention of 99mTc-MDP (10), a test that in recent years has been adapted for use with the γ-camera (11–13). Although this test is highly sensitive to a variety of different types of metabolic bone disease, it is also dependent on glomerular filtration rate (GFR) (14). This dependence raises the possibility that, particularly in elderly patients, lower GFR rather than increased osteoblastic activity may be the cause of increases in 24-h whole-body retention.
An alternative method first proposed by Charkes et al. (15) is to measure whole-skeleton plasma clearance, Kbone, a technique that results in an index of skeletal function analogous to the measurement of GFR using 51Cr-ethylenediaminetetraacetic acid (51Cr-EDTA) (16). In this method, the 0- to 4-h plasma clearance curve of free (non–protein bound) 99mTc-MDP is analyzed using the compartmental model shown in Figure 1 (14). Provided that the rate constant k4 describing the backflow of tracer from the bound bone compartment to plasma is sufficiently small, values of Kbone can be estimated by first calculating the total clearance (Ktotal = Kbone + Krenal) by dividing the amount of tracer injected, Q, by the area under the plasma clearance curve (AUC) (14): Eq. 1
Eq. 1

Compartmental model describing whole-body kinetics of 99mTc-MDP. Total plasma clearance is sum of Kbone and Krenal.
In Equation 1, P(t) represents the plasma concentration of free 99mTc-MDP at time t. Because the renal clearance of free 99mTc-MDP is the same as that of 51Cr-EDTA (17,18), the value of Kbone is found by subtracting GFR from Ktotal: Eq. 2
Eq. 2
We refer to this method of evaluating Kbone as the AUC method. Using this technique, Blake et al. (14) reported a statistically significant difference in values of Kbone (40.3 vs. 44.2 mL·min−1) between estrogen-treated postmenopausal women and age-matched untreated women. However, the accuracy of Kbone measurements using the AUC method is subject to several uncertainties (14). One of these is that, like the measurement of GFR using 51Cr-EDTA (16), the evaluation of AUC for free 99mTc-MDP depends on the assumption that the terminal exponential is reached by 2 h. If there is a delay, then values of Kbone will be overestimated (19). A second reason for uncertainty in Kbone measurements is whether the value of k4 in Figure 1 is sufficiently small to justify the use of Equation 1 (14).
The aim of this study was to validate the accuracy of AUC measurements of Kbone by comparing them with measurements performed using 2 γ-camera methods. The γ-camera techniques were the Patlak plot method (20) and a modified version of the γ-camera method described by Brenner et al. (12). Because of the delay in reaching equilibration between 99mTc-MDP in blood and soft tissue (14), the Patlak method has a bias to overestimate and the Brenner method to underestimate the true value of Kbone. If the AUC method is quantitatively correct, the results should lie between the 2 γ-camera methods. A second aim of the study was to use the γ-camera data to measure k4.
MATERIALS AND METHODS
The subjects were 71 consecutive patients (40 women and 31 men; mean age, 65.5 y; range, 35–87 y) referred for a 99mTc-MDP bone scan examination. The local research ethics committee approved the study, and each subject gave informed consent. Subjects were injected with 600 MBq of 99mTc-MDP. For the first 22 patients, anterior and posterior whole-body images were acquired using a dual-head γ-camera system at 15 min and at 1, 2, 3, and 4 h after injection, whereas the remaining 49 patients were imaged at 15 min and at 1 and 3 h. The scan speed was 10 cm·min−1 at 3 h and 50 cm·min−1 at the other scan times. In the first 22 patients, soft-tissue retention of 99mTc-MDP was quantified from a 15-min dynamic scan over both thighs that began as soon as the tracer had been injected. Two-minute anterior and posterior static images of the thighs were acquired immediately before the 1-, 2-, 3-, and 4-h whole-body scans. In the remaining 49 patients, the dynamic scan was omitted and soft-tissue uptake was measured from static images of the thighs before the 1- and 3-h scans. A subset of 10 patients was injected with 3 MBq of 51Cr-EDTA to measure GFR (16,19).
Blood Measurements
Five-milliliter blood samples were taken at 5, 15, 30, 60, 120, 180, and 240 min via an indwelling venous cannula in the opposite arm to the injection site. Blood samples were centrifuged, and 2 mL of plasma were placed in 10-kDa filters (Amicon Ultra-4; Millipore Corp.) and spun for 30 min at 2,000g to measure the free 99mTc-MDP (18). Subjects were asked to drink at least 300 mL of fluids per hour and to empty their bladder before each 1-h scan. One-milliliter aliquots of whole plasma and ultrafiltrate were counted in an automatic γ-counter together with standards. The plasma clearance curves for free 99mTc-MDP were integrated to determine the complete AUC by extrapolating to infinity the exponential fitted to the 2- to 4-h points, and the total plasma clearance was calculated using Equation 1. The measured blood data were interpolated to estimate the plasma concentrations at the midpoints of the 1-, 2-, 3-, and 4-h static and whole-body images, and the AUC values were calculated for these time points. For the 10 subjects having the GFR investigation, the 51Cr-EDTA plasma curve was measured and GFR was calculated from the complete AUC (16,19).
γ-Camera Measurements
Whole-body retention of 99mTc-MDP was measured from the geometric mean of anterior and posterior whole-body counts. After correction for scan speed, background, and 99mTc decay, the whole-body counts were corrected for the residual activity in urine by subtracting counts from regions of interest drawn over the bladder and kidneys. Finally, the 99mTc-MDP retention in bone and soft tissue at 15 min and at 1, 2, 3, and 4 h was derived by normalizing to the uncorrected (i.e., including bladder and kidneys) whole-body count at 15 min, defined as 100%.
Soft-tissue retention of 99mTc-MDP was measured by imaging the adductor muscles in both thighs using a modified version of the method described by Brenner et al. (12). A region of interest was drawn over both adductor muscles comprising the area bounded by the pelvis, knees, and both femurs. The same region of interest was copied onto the anterior and posterior views of the dynamic scan and of the 1-, 2-, 3-, and 4-h static images. After correction for background counts and 99mTc decay, the geometric mean of the counts in the 1-, 2-, 3-, and 4-h images was normalized to the peak counts in the dynamic scan, which were assumed to represent 80% uptake of 99mTc-MDP in soft tissue. A valid method for quantifying the soft-tissue uptake is described below.
Data Analysis
The soft-tissue retention of 99mTc-MDP at time t [ST(t)] is found by subtracting the amount of tracer in urine [U(t)] and bone [B(t)] from the initial injected activity Q: Eq. 3
Eq. 3
The total 99mTc-MDP plasma clearance was measured from the γ-camera data by plotting the 1-, 2-, 3-, and 4-h measurements of soft-tissue retention against AUC and extrapolating the straight-line fit to find the value of AUC (AUC1) at the intercept on the horizontal axis (Fig. 2A). Ktotal was calculated from the relationship: Eq. 4
Eq. 4

(A) Nominal percentage of 99mTc-MDP in soft tissue plotted against AUC. Ktotal is estimated by extrapolating straight line fitted to 1-, 2-, 3-, and 4-h points to find terminal value of AUC1. Note that 15-min point lies below straight line because equilibration between tracer in blood and tracer in soft tissue is not reached at this early time. (B) γ-Camera measurements of whole-body retention (WBR) plotted against AUC. Renal clearance of free 99mTc-MDP was determined by extrapolating straight-line fit to find AUC2. (C) Measurement of 99mTc-MDP Kbone using Patlak plot. Kbone is determined from slope of straight line fitted to 2-, 3-, and 4-h time points.
The value of AUC1 is independent of the scaling of the vertical axis in Figure 2A, and the true values of soft-tissue retention can be estimated by rescaling to make the intercept on the vertical axis 100%. The renal plasma clearance of 99mTc-MDP (Krenal) was measured by a similar plot of the bladder- and kidney-corrected whole-body retention of 99mTc-MDP and extrapolating the straight-line fit to find the value of AUC (AUC2) at the intercept on the horizontal axis (Fig. 2B). Krenal was calculated from the relationship: Eq. 5
Eq. 5
Kbone was determined by subtracting Krenal from Ktotal. Because of its use of the soft-tissue region of interest over the adductor muscles, we shall refer to this method of evaluating Kbone as the Brenner method (12).
The Patlak plot (20) provides an alternative γ-camera method of determining whole-skeleton Kbone by dividing the 99mTc-MDP retention in bone and soft tissue and the AUC values by the total 99mTc-MDP plasma concentration and fitting a straight line to the 2-, 3-, and 4-h points (Fig. 2C). Kbone values were estimated from the slope of this line.
The predicted linear relationship between soft-tissue retention and AUC (Eq. 3) is exact only if k4 = 0. It follows that any curvature in the plot shown in Figure 2A due to tracer passing from bone to soft tissue can be used to estimate the value of k4. In the 22 patients with the 1-, 2-, 3-, and 4-h soft-tissue images, the data were analyzed by estimating the cumulative urine excretion of tracer at time t from the equation (14): Eq. 6
Eq. 6
The retention of tracer in bone was estimated from the equation (14): Eq. 7
Eq. 7
In Equations 6 and 7, τ is the time variable of integration and varies between 0 and t, with t being the time point for which values of U(t) and B(t) are being determined. The values of Krenal and Kbone were those determined from Equations 4 and 5, and α is a scaling factor that adjusts the value of Kbone to allow for the error in its determination due to the nonzero value of k4 (14). When values of U(t) and B(t) are substituted in Equation 3, the ratio of the measured to the predicted values of the soft-tissue retention at each of the 4 time points is found as a function of α and k4. The value of α was determined individually in each patient for each value of k4 by requiring the slope of the plot of the ratio of the measured to predicted soft-tissue retention against time to be zero. The residual curvature was then used to find the optimum value of k4 using a least-squares fit to the data in all 22 patients.
RESULTS
Clinical reports of the 71 bone scan examinations gave the following interpretations: metastatic bone disease (n = 22), Paget's disease (n = 4), fractures (n = 8), degenerative or inflammatory changes (n = 34), or normal findings (n = 3). γ-Camera measurements of Krenal using Equation 5 were in close agreement with the 51Cr-EDTA measurements of GFR in the 10 patients studied (Fig. 3). The mean (±SD) for the γ-camera method was 62.8 ± 18.2 mL·min−1, compared with 60.9 ± 17.8 mL·min−1 for the 51Cr-EDTA measurements. When the value of k4 was estimated from the ratio of the measured to the predicted values of soft-tissue retention for the 22 patients with the 1-, 2-, 3-, and 4-h static images of the adductor muscles, the minimum value of χ2 was  at k4 = 0.0003 min−1 (95% CI, −0.0002 < k4 < 0.0008 min−1) (Fig. 4). The minimum value of χ2 was within the expected range of values for 2 degrees of freedom (95% CI, 0.05 <
  ).
).

Scatter plot (A) and Bland–Altman plot (B) of values of GFR determined using 51Cr-EDTA, compared with equivalent values from whole-body retention measurements obtained using γ-camera in subset of 10 patients who participated in GFR investigation. Solid lines represent line of identity, and dashed lines represent mean and 95% CI.

Least-squares fit to 1-, 2-, 3-, and 4-h soft-tissue data from first 22 patients to determine value of k4. Minimum value of χ2 was 0.64 at k4 = 0.0003 min−1; 95% CI (−0.0002 < k4 < 0.0008 min−1) was determined by adding 95% upper limit of χ2 for 1 degree of freedom (3.84) to 
The mean value (±SD) of the total 99mTc-MDP plasma clearance (Ktotal) obtained by the Brenner method was 112.1 ± 45.6 mL·min−1, compared with 125.3 ± 46.7 mL·min−1 obtained by the AUC method. When the 2 values of Ktotal were plotted against each other (Fig. 5), a straight-line relationship was obtained with a correlation coefficient of 0.970. When linear regression analysis was performed, the intercept was not statistically significantly different from zero and a straight line fitted through the origin gave a slope of 0.901 (95% CI, 0.891−0.911). A similar evaluation for the Patlak method was performed by adding the γ-camera measurements of Krenal to the Patlak plot measurements of Kbone and plotting against the AUC values of Ktotal (data not shown). A straight-line relationship through the origin was obtained with a correlation coefficient of 0.986 and a slope of 0.951 (95% CI, 0.944−0.958).

Scatter plot (A) and Bland–Altman plot (B) of values of Ktotal determined using Brenner method vs. values of Ktotal determined using AUC.
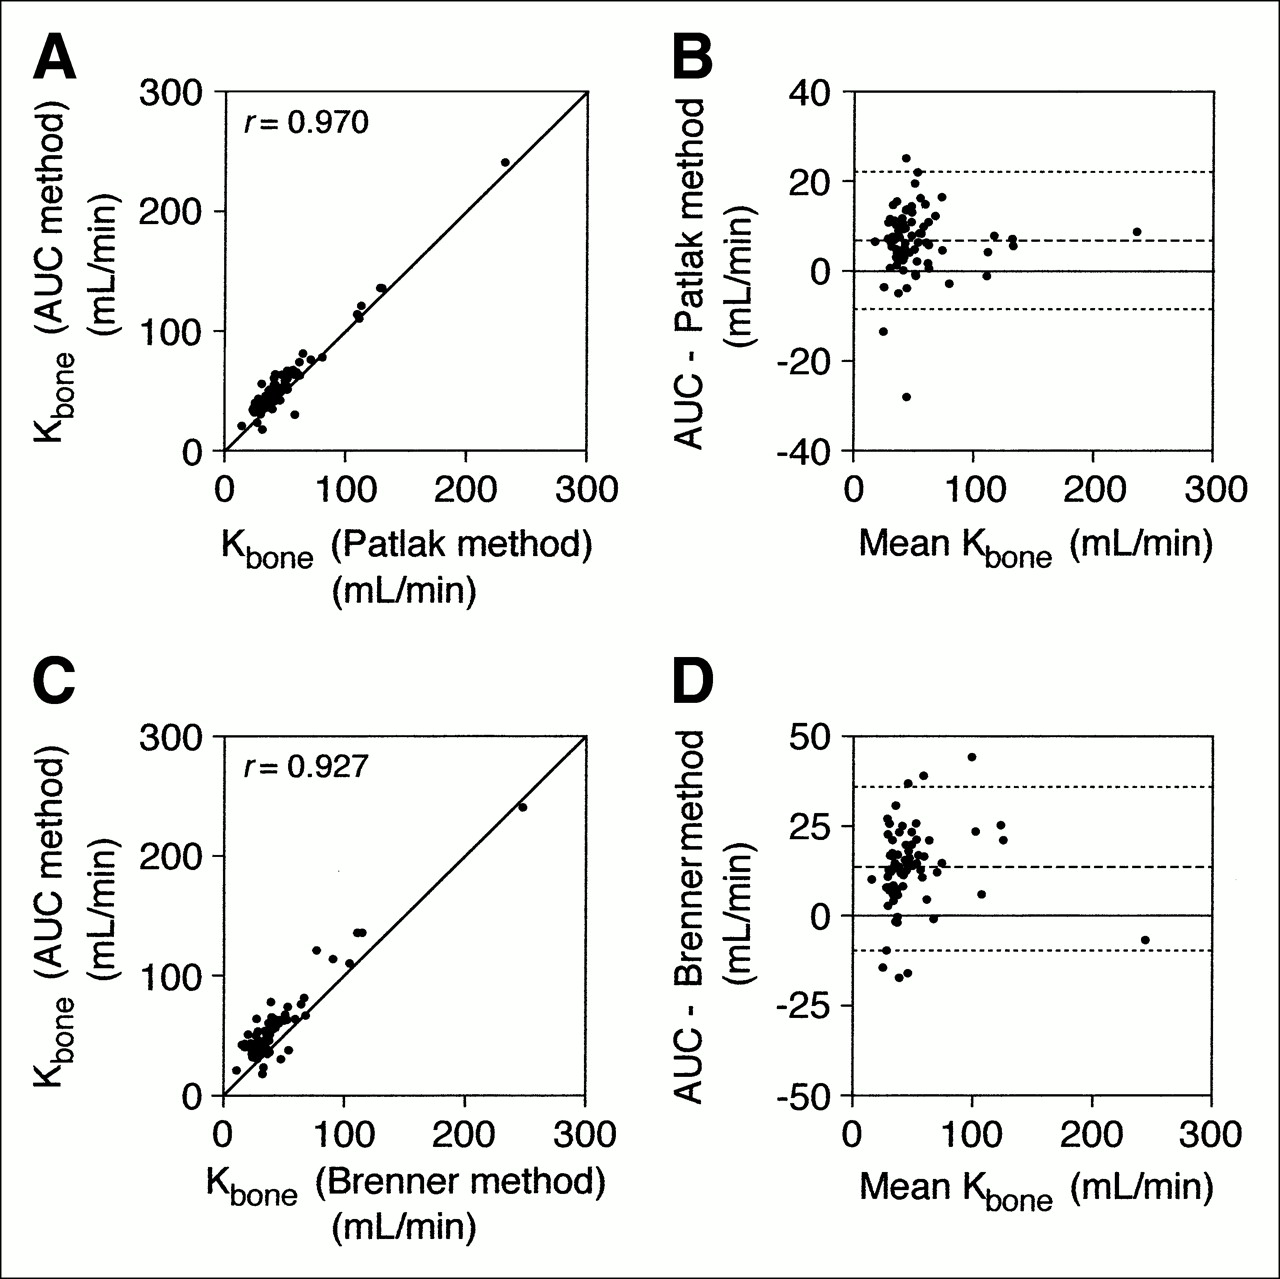
The mean (±SD) values of Kbone determined using the 3 methods were 49.5 ± 32.1 mL·min−1 for the Patlak method, 42.8 ± 32.0 mL·min−1 for the Brenner method, and 56.0 ± 32.4 mL·min−1 for the AUC method. A plot of the AUC value of Kbone against the Patlak value gave a straight-line relationship with a correlation coefficient of 0.970 (Fig. 6A). A Bland–Altman plot gave a mean difference of 6.5 mL·min−1 (95% level of agreement, 21.8−8.8 mL·min−1) (Fig. 6B). A similar plot of the AUC value of Kbone against the Brenner value gave a correlation coefficient of 0.927 (Fig. 6C), whereas the Bland–Altman plot gave a mean difference of 13.2 mL·min−1 (95% level of agreement, 36.0−9.6 mL·min−1) (Fig. 6D).

Scatter plot (A) and Bland–Altman plot (B) of values of Kbone determined using AUC vs. values of Kbone determined using Patlak plot, and scatter plot (C) and Bland–Altman plot (D) of values of Kbone determined using AUC vs. values of Kbone determined using Brenner method. Solid lines represent line of identity, and dashed lines represent mean and 95% CI.
No healthy subjects were included in this study. However, of the 71 patients, 39 showed minimal changes on their bone scans, and these changes were thought to have a negligible effect on whole-body 99mTc-MDP kinetics. The mean (±SD) values of Kbone determined using the 3 methods for these 39 subjects were 39.6 ± 12.3 mL·min−1 for the Patlak method, 34.0 ± 10.3 mL·min−1 for the Brenner method, and 47.4 ± 13.1 mL·min−1 for the AUC method.
DISCUSSION
Although the quantification of 99mTc-MDP studies using bone uptake measurements such as whole-body retention have been popular in the past (10–13), the measurement of bone plasma clearance provides a truer measure of the factors such as bone blood flow and osteoblastic activity that determine 99mTc-MDP uptake in the skeleton (7). The limitation of bone uptake measurements is that they reflect merely the competition for a finite amount of tracer between the kidneys and different areas of the skeleton
The simplest method of measuring the whole-skeleton clearance of 99mTc-MDP is to measure the 0- to 4-h plasma clearance curve, with 51Cr-EDTA used as a cotracer to measure GFR (14,17,23). The AUC method can be used to evaluate the total (bone plus renal) clearance of 99mTc-MDP, and the GFR can be subtracted from Ktotal to give the value of Kbone (14). However, the absolute accuracy of the resulting values of Kbone is uncertain because of the assumption made that the 2- to 4-h points on the 99mTc-MDP plasma curve represent the true terminal exponential. It is likely that, as is the case with 51Cr-EDTA measurements of GFR (19), the extrapolation of the 2- to 4-h data to infinity underestimates the true value of the AUC and results in overestimation of Kbone values.
A second cause for uncertainty in Kbone measurements using the AUC method is whether k4 describing the flow of tracer from the bone compartment to plasma can be neglected (14). Fogelman and Martin (24) evaluated k4 from whole-body retention measurements of 99mTc-HEDP from 24 to 96 h in 10 patients and reported mean values of 0.00015 min−1 in 4 patients with normal bone scan findings and 0.00007 min−1 in 6 patients with abnormal scan findings. These values of k4 correspond to biologic half-lives of 3–6 d, and if they also apply to the period from 0 to 4 h after injection, they have a negligible effect on the measurement of Kbone (14). However, it is possible that on shorter time scales, values of k4 might be significantly larger. When the soft-tissue data from the present study were used to measure k4, the 95% CI was found to lie in the range of 0−0.0008 min−1. The ending value of the range corresponds to a biologic half-life of 14 h and is sufficiently small to have only a minor effect on values of Kbone estimated using the AUC method (14). The value of k4 determined in this study was a collective value measured in a group of 22 patients, none of whom had any extensive bone disease. For statistical reasons, we were unable to provide any values of k4 in individual patients. Fogelman and Martin (24) found that k4 values were smaller in patients with more extensive disease. The situation in patients with osteolytic disease is unclear, but it is possible that k4 values are increased.
In principle, the 0- to 4-h 99mTc-MDP plasma clearance curve can be used to solve the compartmental model shown in Figure 1 for values of Kbone and k4 (15). In practice, however, the high correlation between the errors in the 2 parameters prevents this from being a practical method of evaluating either variable (14). Additional data are required to constrain values of Kbone and k4, and the present study was based on the premise that γ-camera measurements could provide such data. Two γ-camera methods were used to measure Kbone, one based on the Patlak plot method (20) and the other adapted from a method described by Brenner et al. (12) using quantification of soft-tissue uptake over the thighs. The γ-camera methods have several limitations—including the subtraction of counts from regions over the kidneys and bladder—that will not completely correct for urinary activity, because some scattered photons will still be counted outside these regions. In addition, both methods require equilibration between tracer in the vascular system and tracer in soft tissue to provide accurate values of Kbone. However, the failure to reach full equilibration in the required time causes opposite errors, with the Patlak method having a bias to overestimate and the Brenner method to underestimate the true value of Kbone.
As expected from the effects of tracer equilibration between plasma and soft tissue, the mean value of Kbone estimated using the Patlak method was slightly higher than that estimated using the Brenner method (49.5 mL·min−1 vs. 42.8 mL·min−1). Also, as predicted from the expected underestimate of AUC from the extrapolation of the 2- to 4-h exponential, the mean value of Kbone estimated using the AUC method was, at 56.0 mL·min−1, the highest of the 3 figures. The Bland–Altman plots showed that the AUC method overestimated Patlak values of Kbone by an average of 6.5 mL·min−1 (Fig. 6B) and Brenner values by an average of 13.2 mL·min−1 (Fig. 6D). The overestimate of Kbone by the AUC method is believed to be due to an error in determining the terminal exponential. This conclusion would be more definitive if it were supported by plasma data from later time points, but unfortunately, blood sampling was continued only until completion of the patients' routine bone scan at 4 h. Given the range of different values of GFR, the correction for the underestimate of AUC is best made to Ktotal. If Equation 2 is modified to read: Eq. 8then a factor β = 0.90 will make the AUC method agree with the Brenner method (Fig. 5A) and β = 0.95 will make it agree with the Patlak method.
There was no healthy group in this study, and therefore it is not possible to determine a reference range of values of Kbone. However, the mean value of Kbone was determined in a group of 39 patients showing minimal changes on their bone scans. In patients with high bone turnover in, for example, extensive metastatic bone disease, one would expect to observe high values of Kbone because 99mTc-MDP is cleared more rapidly from plasma into the bone mineral compartment.
CONCLUSION
We have used whole-body and static γ-camera imaging to evaluate the accuracy of measurements of whole-skeleton 99mTc-MDP plasma clearance made using the AUC method. When k4 describing the backflow of tracer from bone to plasma was evaluated by quantifying soft-tissue uptake, the backflow was shown to be negligibly small. As expected, when the 2- to 4-h plasma data are assumed to represent the terminal exponential, slightly overestimated figures for Kbone result. Corrections of Ktotal values by factors in the range of 0.90−0.95 bring Kbone values derived by the AUC method into agreement with those measured using the γ-camera.
References
- Received for publication October 18, 2005.
- Accepted for publication December 21, 2005.


