


Abstract
Tumor delineation using noninvasive medical imaging modalities is important to determine the target volume in radiation treatment planning and to evaluate treatment response. It is expected that combined use of CT and functional information from 18F-FDG PET will improve tumor delineation. However, until now, tumor delineation using PET has been based on static images of 18F-FDG standardized uptake values (SUVs). 18F-FDG uptake depends not only on tumor physiology but also on blood supply, distribution volume, and competitive uptake processes in other tissues. Moreover, 18F-FDG uptake in tumor tissue and in surrounding healthy tissue depends on the time after injection. Therefore, it is expected that the glucose metabolic rate (MRglu) derived from dynamic PET scans gives a better representation of the tumor activity than does SUV. The aim of this study was to determine tumor volumes in MRglu maps and to compare them with the values from SUV maps. Methods: Twenty-nine lesions in 16 dynamic 18F-FDG PET scans in 13 patients with non–small cell lung carcinoma were analyzed. MRglu values were calculated on a voxel-by-voxel basis using the standard 2-compartment 18F-FDG model with trapping in the linear approximation (Patlak analysis). The blood input function was obtained by arterial sampling. Tumor volumes were determined in SUV maps of the last time frame and in MRglu maps using 3-dimensional isocontours at 50% of the maximum SUV and the maximum MRglu, respectively. Results: Tumor volumes based on SUV contouring ranged from 1.31 to 52.16 cm3, with a median of 8.57 cm3. Volumes based on MRglu ranged from 0.95 to 37.29 cm3, with a median of 3.14 cm3. For all lesions, the MRglu volumes were significantly smaller than the SUV volumes. The percentage differences (defined as 100% × (VMRglu − VSUV)/VSUV, where V is volume) ranged from −12.8% to −84.8%, with a median of −32.8%. Conclusion: Tumor volumes from MRglu maps were significantly smaller than SUV-based volumes. These findings can be of importance for PET-based radiotherapy planning and therapy response monitoring.
Tumor delineation using noninvasive medical imaging modalities is important to determine the target volume in radiation treatment planning and to evaluate treatment response. It is expected that the combined use of CT and the functional information from 18F-FDG PET will lead to improved tumor delineation (1–9). However, until now, tumor delineation using PET has been based on static images of 18F-FDG uptake obtained at a fixed time after injection.
18F-FDG uptake can be expressed in activity concentration values (e.g., Bq/cm3), directly available from the PET images, or in standardized uptake values (SUV, g/cm3), where the activity concentration has been corrected for the administered activity and the estimated distribution volume, and sometimes for the plasma glucose concentration. However, when tumor volumes are calculated using isocontours at a fixed percentage of the maximum uptake within the tumor, both images are equivalent because in each PET scan, activity concentration and SUV differ only by a fixed multiplicative constant. For consistency throughout this paper, uptake values will be expressed as SUV using Eq. 1with CFDG the activity concentration in (tumor) tissue (Bq/cm3), Aadm the administered activity (Bq), and mb the patient's body mass (g).
18F-FDG uptake depends not only on the tumor physiology and tumor cell density but also on the blood supply, the distribution volume, and competitive uptake processes in other tissues. Moreover, the uptake of 18F-FDG in tumor tissue and in surrounding healthy tissue is time-dependent, because even at 1 h after injection, which is the normal scan starting time in static, whole-body 18F-FDG PET, tumors still accumulate 18F-FDG. Accordingly, the distribution of 18F-FDG over the tumor and its surroundings will change with time and will, in general, differ from tumor to tumor and from patient to patient.
In contrast, the glucose metabolic rate (MRglu), defined as the rate at which glucose is being metabolized (expressed, for example, in μmol/[cm3 × min] of tissue), is not influenced by these processes and parameters. In the standard 2-compartment 18F-FDG model with trapping in the linear approximation (Patlak analysis) (10,11), Eq. 2where K1, k2, and k3 are the 3 rate constants of the 2-compartment model, Ki is the 18F-FDG influx constant, and Cp,glu is the plasma glucose concentration. The linear approximation is valid when the plasma 18F-FDG concentration changes slowly and the data points in the Patlak curve approach a straight line with the slope equal to Ki (11). Equation 2 shows that MRglu depends only on the tissue microparameters K1 (rate constant for transport of free 18F-FDG from plasma to tissue), k2 (rate constant for transport of free 18F-FDG back into plasma), k3 (rate constant for phosphorylation of 18F-FDG inside the cell), and Cp,glu, which is approximately constant during the PET scan when patients are fasting. Therefore, it is expected that MRglu derived from dynamic PET scans better represents the tumor metabolic activity than does SUV. The aim of this study was to determine tumor volumes based on MRglu maps and to compare them with the values from SUV maps. Tumor volumes determined by isocontouring in MRglu maps will not be influenced by constant multiplicative factors. Therefore, the same tumor volumes would be obtained using Ki maps, which differ from MRglu maps by the plasma glucose concentration. For consistency throughout this paper, we will use MRglu maps and report maximum and average MRglu values within lesions.
MATERIALS AND METHODS
Patients
Twenty-nine lesions in 16 dynamic 18F-FDG PET scans of 13 patients (11 men and 2 women) with non–small cell lung carcinoma were analyzed. The mean patient age was 65 y (range, 52–75 y). Patients with diabetes mellitus were excluded. The PET scans were performed as part of a response monitoring study (12), which was approved by the Institutional Review Board of the Radboud University Nijmegen Medical Centre. Written informed consent was obtained from all patients.
PET Image Acquisition and Reconstruction
Patients fasted for at least 6 h. Cannulas were inserted in an antecubital vein for 18F-FDG injection and in a radial artery (20-gauge cannula) for blood sampling. The blood glucose level was within the normal range in all patients (hexokinase method [Aeroset]; Abbott Diagnostics).
All scans were acquired on an ECAT EXACT47 scanner (Siemens/CTI) in septa-extended (2-dimensional) mode. After a 20-min transmission scan using the built-in 68Ge transmission sources, 200–250 MBq of 18F-FDG were injected intravenously over a 1-min period followed by a 40-mL saline flush at a rate of 8 mL/s, using an infusion pump (Medrad). Dynamic data acquisition began simultaneously with 18F-FDG injection for 16 time frames (10 × 30 s, 3 × 300 s, and 3 × 600 s) for a total time of 50 min. Images were corrected for radioactive decay, attenuation, and randoms. Scatter correction based on measured scatter fractions as implemented in the ECAT 7.2.1 software was used. Attenuation-corrected images were reconstructed in 128 × 128 × 47 matrices using 2-dimensional ordered-subsets expectation maximization with Fourier rebinning (4 iterations and 16 subsets). A zoom factor of 1.5 in the transaxial direction, and a Gauss filter of 5 mm in both the transaxial and the axial directions, were used. The resulting voxel size was 3.432 × 3.432 × 3.375 mm. The axial field of view was 16.2 cm.
Arterial Plasma Input Function
Immediately after 18F-FDG injection, 7 arterial blood samples (2 mL) were drawn at 15-s intervals, followed by samples at 135 s, 165 s, 225 s, 285 s, 7.5 min, 12.5 min, 17.5 min, 25 min, 35 min, and 45 min after injection. Plasma radioactivity was determined in a well-type γ-counter (Wallac 1480 Wizard; Perkin Elmer Lifescience) using the standard solution method (13).
MRglu Images
MRglu values were calculated on a voxel-by-voxel basis using the standard 2-compartment 18F-FDG model with trapping in the linear approximation according to Equation 2. For all tumors investigated, the Patlak curves approached a straight line at approximately 10–15 min after injection. Therefore, MRglu was determined by linear least-squares fitting of the last 5 time frames of the dynamic dataset—that is, for the interval of 10–50 min after injection. Because the Patlak analysis was done on a voxel-by-voxel basis, 3-dimensional volumes of MRglu values, or MRglu maps, were obtained.
Tumor Contouring
Tumor volumes were determined in SUV maps of the last time frame (40–50 min after injection) and in MRglu maps using 3-dimensional isocontours at 50% of the maximum SUV and the maximum MRglu, respectively. Only lesions for which the 50% isocontours were completely within the 16.2-cm axial field of view of the scanner were analyzed.
Tumor-to-Background (T/B) Ratios
For lesions that were in the lung (as opposed to in the mediastinum, in the ribs, or subcutaneous), and that were surrounded by a more or less uniform background region, 3-dimensional lung background regions were drawn to represent the SUV and MRglu in healthy lung tissue. Fourteen of the 29 lesions fulfilled this criterion. For these lesions, the T/B, defined as the average lesion value (based on the 50% 3-dimensional isocontours) divided by the average background value, were determined in both the SUV maps and the MRglu maps.
Statistical Fluctuations in MRglu and SUV Voxel Values
Tumor volumes determined by isocontouring at a fixed percentage of the maximum voxel value of SUV and MRglu are influenced by statistical fluctuations of these maximum values. If the MRglu images are noisier than the SUV images, the average result will be too-large MRglu values for the tumor maximum and, accordingly, too-small lesion sizes because the 50% threshold effectively has then shifted to higher values and can no longer be compared with the 50% SUV threshold. To estimate these statistical fluctuations, we determined the standard deviation (SD) in SUV and MRglu for clusters of voxels around the tumor maximum for each lesion. The voxel clusters consisted of the voxel of maximum intensity and its 4 adjacent voxels in the same transaxial plane. Of course, these SDs will also partly contain the real differences in the parameter values as determined by the tumor heterogeneity, but they can serve as upper limits to the statistical fluctuations and can be used to compare the statistical noise in SUV and MRglu maps.
RESULTS
The results of the tumor contouring are summarized in Table 1. All lesions showed smaller MRglu-based volumes than SUV-based volumes. Figure 1 compares both types of tumor volumes on a lesion-by-lesion basis. The average SUVs within the lesions ranged from 2.26 to 9.20 g/cm3. The SUV-based tumor volumes ranged from 1.31 to 52.16 cm3, with a median of 8.57 cm3. The MRglu-based volumes were significantly smaller, with a range from 0.95 to 37.29 cm3 and a median of 3.14 cm3 (P < 0.0001, Wilcoxon signed rank test). The percentage differences (defined as 100% × (VMRglu − VSUV)/VSUV, where V is volume) ranged from −12.8% to −84.8%, with a median of −32.8%.
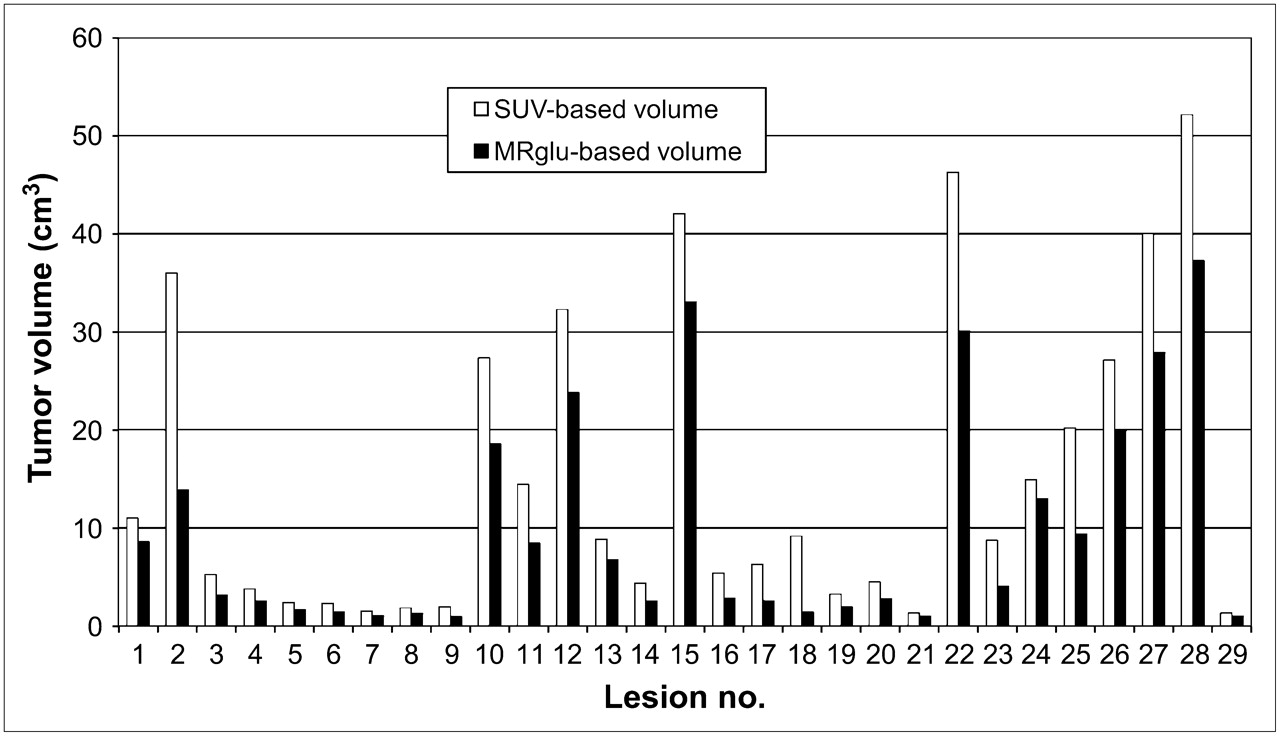
Comparison of SUV-based and MRglu-based tumor volumes on lesion-by-lesion basis. Results are displayed in same order as in Table 1.
Overview of Lesion Characteristics
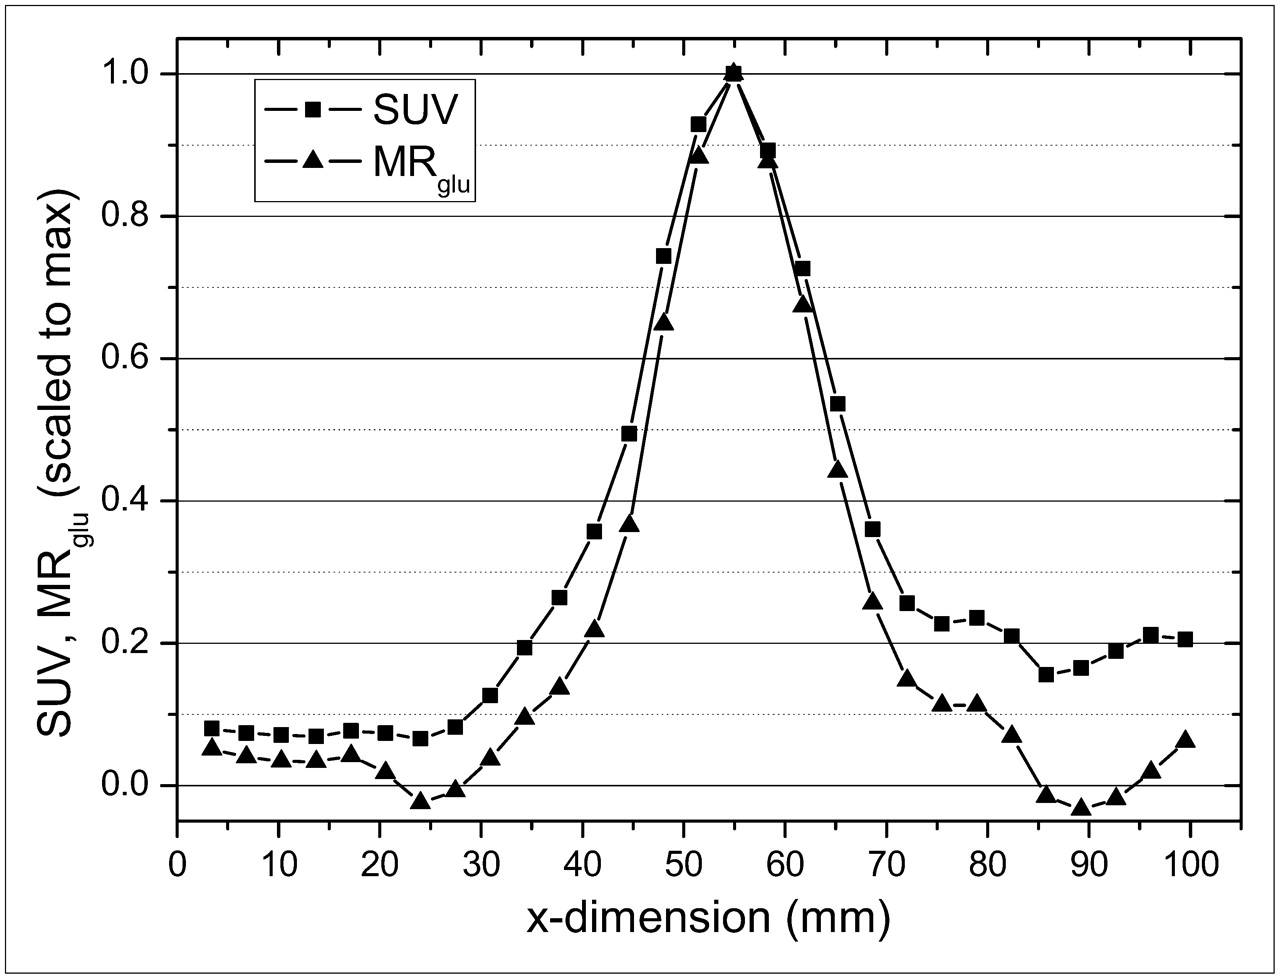
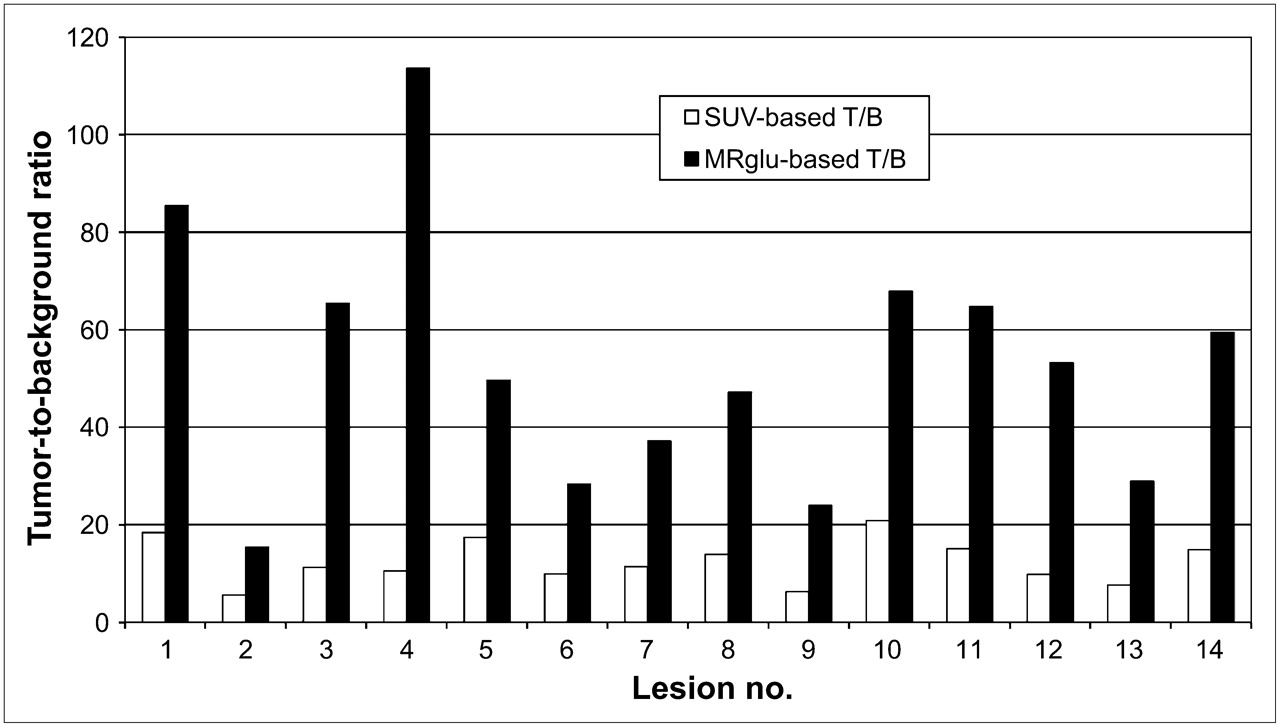
An example of typical cross-sectional profiles of SUV and MRglu through a lesion is shown in Figure 2 (patient 2, scan 1, lesion 1). The tumor is smaller in the MRglu profile than in the SUV profile. Moreover, the SUV background relative to the tumor maximum is higher than the MRglu background relative to the maximum. The lesion and background data and the T/Bs based on SUV and MRglu are presented in Table 2. Figure 3 summarizes the T/Bs on a lesion-by-lesion basis. All T/Bs were significantly lower for SUV than for MRglu (P < 0.0001, Wilcoxon signed rank test). For SUV, T/B ranged from 5.6 to 20.9, with a median of 11.4. For MRglu, T/B ranged from 23.9 to 113.7, with a median of 51.4.

Typical cross-sectional profiles of SUV and MRglu through a lesion (patient 2, scan 1, lesion 1). For direct comparison, maxima of both profiles have been scaled to 1.

Comparison of SUV-based and MRglu-based T/Bs on lesion-by-lesion basis. Only lesions for which a uniform background region within lung could be drawn have been selected. Results are displayed in same order as in Table 2.
Overview of T/B Characteristics
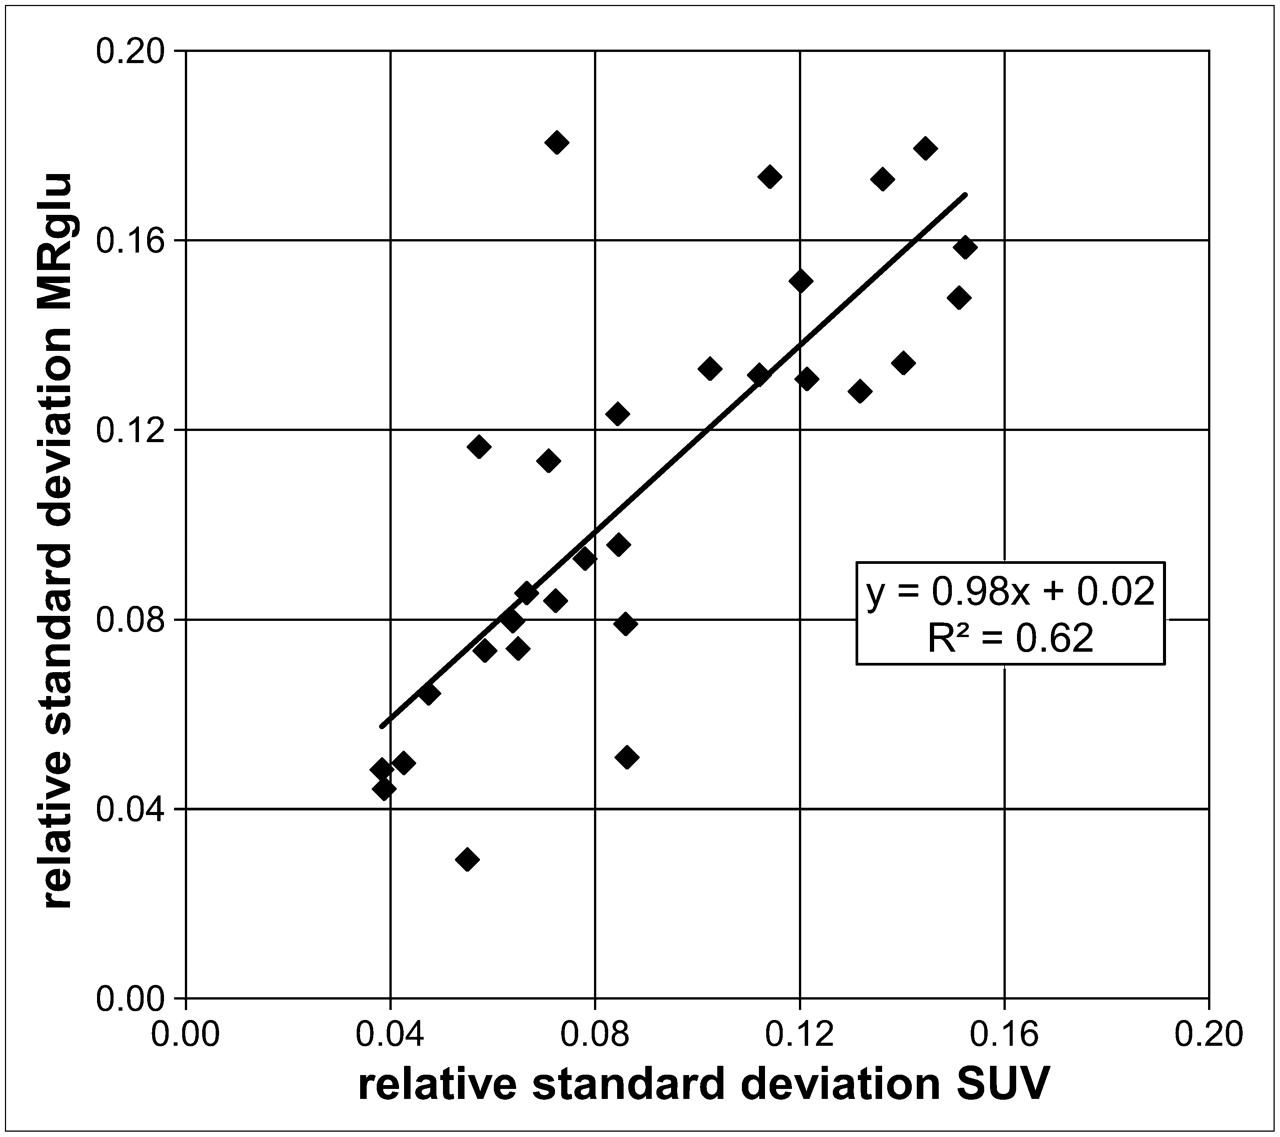
Figure 4 shows the results of the analysis of statistical fluctuations of the maximum voxel values as explained in the preceding section. The relative SD for SUV and MRglu are defined as the SD within the voxel clusters divided by the maximum voxel value. The averaged relative SD for SUV and MRglu over all lesions equaled 0.090 and 0.108, respectively.

Relative SD of voxel clusters around tumor maxima in SUV maps and MRglu maps for the 29 lesions investigated. Straight line is linear fit to data points.
DISCUSSION
This study demonstrated that tumors in MRglu images are smaller and have sharper borders than do tumors in SUV images and that background intensities are higher in SUV images than in MRglu images. In other words, MRglu images are richer in contrast than are SUV images. An obvious reason for the greater background signals in SUV images is that SUV signals consist not only of trapped or metabolizing 18F-FDG but also of free, nonmetabolized, 18F-FDG, present in, for example, blood vessels or the intercellular space. These greater SUV background values can, at least partly, explain the larger tumor volumes in SUV images than in MRglu images. When a background signal is superimposed on a lesion signal, an isocontour at a fixed percentage of the maximum tumor value will enclose a larger region than when no background is present. This effect is illustrated in Figure 5, where simplified cross sections of a tumor are shown for SUV and MRglu. The SUV tumor profile is chosen to be superimposed on a relatively high background signal, whereas the MRglu profile has a low or negligible background. The tumor sizes, indicated by the double arrows, are based on 50% of the maximum lesion value (full width at half maximum).

Simplified cross sections of tumor for SUV and MRglu. SUV tumor profile is chosen to be superimposed on relatively high background signal, whereas MRglu profile has low or negligible background. Tumor sizes, indicated by arrows, are based on 50% of lesion value.
We performed the same analyses using different isocontour level settings (40%, 60%, 70%, and 80%). These analyses confirmed the conclusion that tumor volumes are significantly smaller from MRglu maps than from SUV maps (data available on file).
In Equation 2, the lumped constant (LC), accounting for the difference in affinity between glucose and 18F-FDG to glucose transporters and the phosphorylating system, was set to 1. Further, the fractional blood volume in the tumor, VB, was neglected. If this had not been the case, MRglu values would have changed according to Eq. 3
Eq. 3
However, when VB and LC are assumed to be more or less constant throughout a tumor, the resulting MRglu volumes are not affected, because all voxel values in the MRglu map would have been multiplied by the same constant factor. To our knowledge, no human studies have been performed with regard to LC outside the central nervous system, and 18F-FDG PET studies dealing with the spatial distribution of VB across lung tumors are not available.
Because of the finite spatial resolution of the scanner, the influence of the partial-volume effect on the contouring results should be considered. With an effective linear spatial resolution of about 6 mm (14), the volumetric resolution becomes about 0.11 cm3. Although this value is an order of magnitude smaller than the smallest lesion of our study (1.31 cm3), the exact lesion sizes will still differ from the observed ones and can be obtained only by using recovery coefficients based on the scanner resolution, the observed lesion sizes, and the T/Bs (15). However, the Patlak equation Eq. 4with Ctum(t) and Cp(t) the time-dependent tissue and plasma 18F-FDG concentrations, respectively, is linear in Ctum(t), implying that correcting the 18F-FDG uptake in each voxel by scaling factors accounting for the partial-volume effect will lead to MRglue voxel values that are scaled by exactly the same factors. Such a correction of course most strongly affects edge voxels in small lesions and has almost no influence on central voxels in large lesions. For tumor isocontouring, more edge voxels will be included within both SUV and MRglu isocontours, because several voxels that originally had values lower than 50% of the tumor maximum have now been raised above this threshold. Both tumor volumes will be increased by roughly the same number of voxels (or cubic centimeters) by the application of partial-volume correction. The reason that this increase in tumor volume is not exactly equal for SUV and MRglu lies, of course, in the fact that the distributions of the 2 parameters across a tumor differ. Therefore, our general conclusion that MRglu-based lesion volumes are significantly smaller than SUV-based volumes will still hold after partial-volume corrections, although the results as shown in Table 1 will quantitatively differ. This conclusion is further confirmed by the fact that large lesions (e.g., >30 cm3), for which the partial-volume effect can definitely be neglected, also show significant size differences (Table 1). The application of partial-volume corrections, however, was outside the scope of this study.
In the “Materials and Methods” section, the question was raised of whether differences in statistical fluctuations of SUV and MRglu maxima might cause the observed differences in tumor volumes. Because the average values of relative SD for SUV and MRglu are almost equal (0.090 and 0.108, respectively), these fluctuations are of the same order of magnitude and cannot account for the overall differences in tumor volumes. This is also seen in Figure 4, where the slope of the fitted straight line is close to 1 and the offset is close to 0.
The smaller MRglu-based tumor volumes, as compared with SUV-based volumes, are in accordance with the findings of Daisne et al. (16). As far as we know, this study has been the only one in which 18F-FDG PET, CT, and MRI-based tumor volumes were compared with pathologic findings of resection specimens. The investigators concluded that all 3 imaging modalities overestimated the real tumor sizes but that the PET estimation was closest to the true tumor volume. However, in this study only static PET was used, and tumor contouring was done on uptake images. In our retrospective study, a comparison with pathologic findings was unfortunately not possible. However, as mentioned before, MRglu images are expected to be more representative of the tumor metabolic activity and more reproducible than are SUV images. Therefore, our findings could be of relevance for radiation therapy planning and response evaluation.
It may be argued that dynamic PET protocols are less suitable for routine clinical application because of the longer scanning times and the necessity of arterial blood sampling, which can be too much of a burden to the patient. Although the dynamic scanning protocol in our study lasted 20 min for the transmission scan and 50 min for the emission scan, these scanning times can be reduced considerably. Our investigations were done on a PET scanner in 2-dimensional acquisition mode (septa extended) using bismuth germanate crystals and 68Ge transmission scans. On modern PET/CT scanners with more sensitive lutetium oxyorthosilicate or lutetium yttrium silicon dioxide detection crystals in septa-less 3-dimensional acquisition mode with CT attenuation correction, the total scanning time can typically be reduced by a factor of 3–6 while retaining the same image quality. However, the lower limit on the scan duration is naturally imposed by the linear approximation in the Patlak analysis to calculate MRglu values. In the present work on non–small cell lung carcinoma, this approximation was found to be valid after 10–15 min after injection, in accordance with the results of Hoekstra et al. (17). The implication is that on modern PET/CT scanners, MRglu values can reliably be determined using dynamic 18F-FDG PET scans of 20- to 25-min duration, including the time required for the CT scan. Although the plasma input functions in the present study were obtained by arterial sampling, for non–small cell lung cancer they can also be derived from the PET images using large blood-pool regions such as the aorta or the left ventricle of the heart (18).
CONCLUSION
Tumor volumes from 18F-FDG MRglu maps were significantly smaller than SUV-based volumes. These findings can be clinically relevant for PET-based radiotherapy planning and therapy response monitoring.
Footnotes
-
COPYRIGHT © 2008 by the Society of Nuclear Medicine, Inc.
References
- Received for publication December 10, 2007.
- Accepted for publication February 26, 2008.


Jump to section
Related Articles
Cited By...
- caliPER: A software for blood-free parametric Patlak mapping using PET/MRI input function
- Whole-Body Parametric Imaging of 18F-FDG PET Using uEXPLORER with Reduced Scanning Time
- Total-Body Quantitative Parametric Imaging of Early Kinetics of 18F-FDG
- Relative Patlak Plot for Dynamic PET Parametric Imaging Without the Need for Early-time Input Function
- Comparison of Tumor Uptake Heterogeneity Characterization Between Static and Parametric 18F-FDG PET Images in Non-Small Cell Lung Cancer
- Widefield Optical Imaging of Changes in Uptake of Glucose and Tissue Extracellular pH in Head and Neck Cancer
- Selection of Patients with Advanced-stage Cervical Cancer for Para-aortic Lymphadenectomy in the Era of PET/CT
- Comparative Assessment of Methods for Estimating Tumor Volume and Standardized Uptake Value in 18F-FDG PET