


Abstract
Camelidae possess an unusual class of antibodies devoid of light chains. Nanobodies are intact antigen-binding fragments that are stable, easily generated against different targets, and fully functional. Their rapid clearance from the blood circulation favors their use as imaging agents. We compared the in vivo tumor uptake and biodistribution of 2 anti–epidermal growth factor receptor (anti-EGFR) Nanobodies, 99mTc-7C12 and 99mTc-7D12. Methods: Nanobodies were labeled via their hexahistidine tail with 99mTc-tricarbonyl (99mTc(CO)3) generated from a kit. Mice bearing subcutaneous A431 (EGFR-positive) and R1M (EGFR-negative) xenografts were intravenously injected with 99mTc-7C12 and 99mTc-7D12 on separate days. Pinhole SPECT/micro-CT images were acquired at 1 h after administration to assess noninvasively the biodistribution and tumor targeting of the labeled compounds. Pinhole SPECT and micro-CT images from the same mouse were automatically fused on the basis of a mathematic rigid-body-transformation algorithm using six 57Co sources. Images were quantified, and tracer uptake was expressed as percentage injected activity per gram per cubic centimeter (%IA/cm3) of tissue. Ex vivo biodistribution of mice bearing A431 injected with either 99mTc-7C12 or 99mTc-7D12 was also assessed; activity in the tumor and organs was recorded and expressed as percentage injected activity per gram (%IA/g). Results: Binding of both tracers was receptor-specific. Image analysis showed high and similar tumor uptake values for both 99mTc-7C12 and 99mTc-7D12 (4.55 ± 0.24 %IA/cm3 and 4.62 ± 0.36 %IA/cm3, respectively) in A431 xenografts, whereas the uptake in the negative tumor (R1M) was low (1.16 ± 0.14 for 99mTc-7C12 and 1.49 ± 0.60 for 99mTc-7D12). 99mTc-7C12 showed significantly higher kidney uptake (63.48 ± 2.36 vs. 56.25 ± 2.46 %IA/cm3) and lower liver uptake (2.55 ± 0.26 vs. 4.88 ± 0.86 %IA/cm3) than did 99mTc-7D12. The ex vivo analysis confirmed the image quantification with high tumor-to-background ratio; however, 99mTc-7C12 showed higher tumor uptake (9.11 ± 1.12 %IA/g) than did 99mTc-7D12 (6.09 ± 0.77 %IA/g). 99mTc-7D12 demonstrated significantly higher blood activity than did 99mTc-7C12, but both showed short plasma half-lives (<10 min).Conclusion: The Nanobody fragments used here show high tumor uptake, low liver uptake, and rapid blood clearance. Nanobodies are promising probes for noninvasive radioimmunodetection of specific targets early after administration. On the basis of its favorable biodistribution, 99mTc-7C12 was selected for further studies.
Epidermal growth factor receptor (EGFR or ErbB1) is a member of a receptor tyrosine kinase family together with Her-2-neu/ErbB2, HER-3/ErbB3, and HER-4/ErbB4. EGFR is implicated in many cellular processes such as proliferation, differentiation, and survival (1). Several reports have shown that EGFR signaling is abnormal in many tumors of epithelial origin, such as cancer of the breast, head and neck, prostate, lung, and skin. Aberrant signaling of EGFR is caused by receptor overexpression, activating mutations, or ligand overexpression. These molecular changes lead to cancer initiation and progression and are key targets for anticancer therapy. Overexpression of EGFR is currently assessed in biopsies using immunohistochemistry. This method is limited by its invasiveness, the heterogeneity of tumors, and the inaccessibility of some tumors, particularly metastases. Total-body assessment of the EGFR expression status in all cancerous lesions (primary and metastatic) could become possible using molecular imaging in combination with a radiopharmaceutical targeted at EGFR. Moreover, this assessment could be repeated several times during the course of the disease. Although this would not replace immunohistochemical analysis at the time of diagnosis (at least 1 biopsy of the tumor is obtained for all patients), repetitive in vivo assessments of the EGFR-expression status of the different lesions should help explain the success or failure of anti-EGFR therapy in individual patients. Several radiolabeled monoclonal antibodies directed at EGFR have been investigated, but elimination from the blood is slow because of their large size (150 kDa) and liver uptake is relatively high. As a result, the targeted tumors can be visualized only at several hours or even days after tracer injection (2,3). Radiolabeling of receptor ligands has also been reported (4–6). Blood clearance of these tracers is rapid, but the tumor uptake is only limited. In the current study, we evaluate 99mTc-labeled Nanobodies (Ablynx NV) that are specific for EGFR. Nanobodies are the smallest intact antigen-binding fragments isolated from heavy-chain Camelid antibodies. Besides their small size (15 kDa), they are stable, soluble, and rapidly eliminated, and they have demonstrated efficient and specific tumor targeting (7,8). These characteristics are promising for their use as targeted tracers. The aim of this report was to compare tumor uptake and biodistribution of 2 monovalent EGFR-targeted Nanobodies. An intraindividual study design using pinhole SPECT/micro-CT imaging was chosen to limit the effects of interanimal variability in the comparison.
MATERIALS AND METHODS
Generation of EGFR-Specific Nanobodies
Nanobodies 7C12 and 7D12 were generated by Ablynx NV as described previously (9). In brief, a humoral immune response was induced in Llama glama by immunization with human epidermal A431 carcinoma cells. After cloning variable domains of the heavy-chain antibodies (VHHs; Nanobody) from the peripheral blood and lymph node lymphocytes, we constructed a library of phage-displayed Nanobodies and performed panning on immobilized EGFRs using the ligand EGF for competitive elution. Enriched clones were selected by phage enzyme-linked immunosorbent assay. The gene segments encoding EGFR-binding Nanobodies were recloned into an expression vector harboring c-Myc- and hexahistidine-tag-coding sequences. The Nanobodies used in this report are 7C12 and 7D12 (a kind gift from Ablynx NV); their affinities to soluble recombinant protein–EGFR are in the nanomolar range as determined by the Biacore method (Biacore International AB): 2.3 nM for 7C12 and 5.7 nM for 7D12. The 2 Nanobodies are different in their amino-acid sequence, as shown in Figure 1.
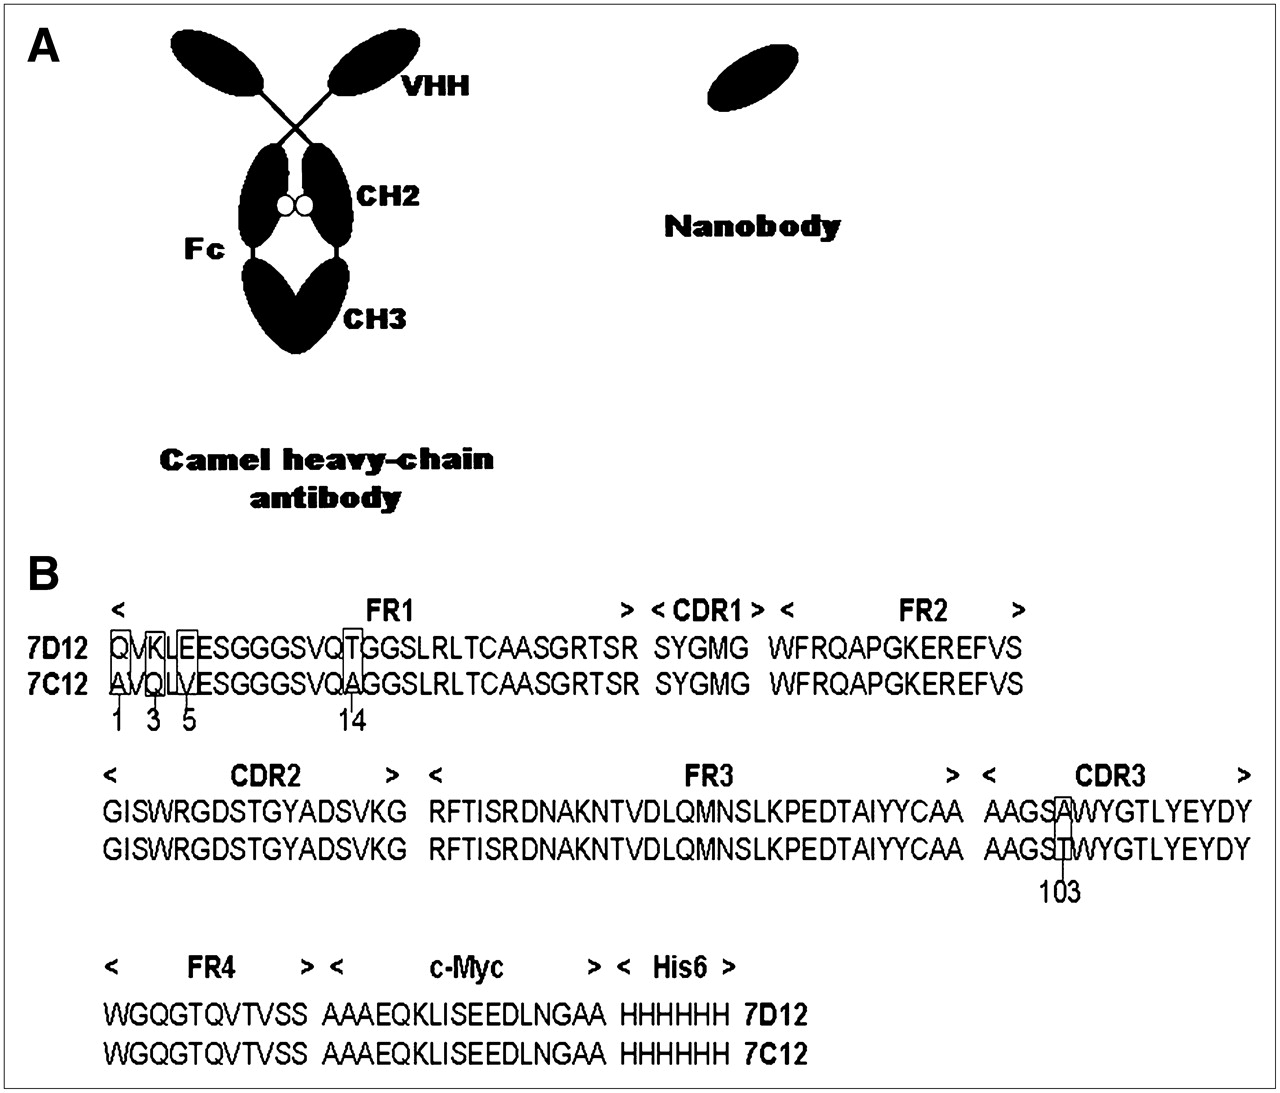
Schematic representation of heavy-chain antibody and Nanobody (A) and amino-acid sequence of 7C12 and 7D12 Nanobodies (B). These 2 compounds differ by amino-acid substitutions Q1A, K3Q, E5V, and T14A in FR1 and by A103T in CDR3.
Nanobody Labeling
Both Nanobodies were labeled with 99mTc at their hexahistidine tail. For the labeling, [99mTc(H20)3(CO)3]+ was synthesized by adding 1 mL of 99mTcO4− (0.74–3.7 GBq) to an Isolink kit (Mallinckrodt Medical BV) containing 4.5 mg of sodium boranocarbonate, 2.85 mg of sodium tetraborate.10H2O, 8.5 mg of sodium tartrate.2H2O, and 7.15 mg of sodium carbonate, pH 10.5. The vial was incubated at 100°C in a boiling bath for 20 min. The freshly prepared [99mTc(H2O)3(CO)3]+ was allowed to cool at room temperature for 5 min and neutralized with 125 μL of 1 M HCl to pH 7–8. [99mTc(H2O)3(CO)3]+ was added to 50 μL of 1 mg/mL 7C12 or 7D12, together with 50 μL of carbonate buffer, pH 8. The mixture was incubated for 90 min at 60°C in a water bath. The labeling efficiency was determined by instant thin-layer chromatography in acetone as mobile phase and analyzed using a radiometric chromatogram scanner (VCS-201; Veenstra). When the labeling yield was less than 90%, the 99mTc-Nanobody solution was purified on a NAP-5 column (GE Healthcare) preequilibrated with phosphate-buffered saline (PBS).
Cell Culture and Animal Model
A431, the human skin carcinoma cell line used in all the cell experiments, was obtained from EPO-GmbH. This A431 cell line expresses 2 × 10⁶ EGFR molecules per cell (6). The cells were cultured in Dulbecco's modified Eagle's medium, supplemented with 10% fetal bovine serum, L-glutamine (2 mmol/L), PEST (penicillin 100 IU/mL and streptomycin 100 μg/mL), 1% Na+ pyruvate, and 1% nonessential amino acids, all obtained from Invitrogen. R1M rhabdomyosarcoma cells were used as a negative control. These cells do not express EGFR and were grown in minimal essential medium with 10% fetal bovine serum, 1% nonessential amino acids, PEST, and 0.13 μg/mL amphotericin B (Fungizone; E.R. Squibb). During cell culture and cell experiments (unless otherwise stated), all cells were grown at 37°C in incubators with humidified air, equilibrated with 5% CO2. The cells were collected with trypsin–ethylenediaminetetraacetic acid 0.05% (Invitrogen). Cells (3 × 10⁶) in 100 μL of PBS, pH 7.4, were subcutaneously injected into the right hind leg of male nude athymic (nu/nu) mice (8–16 wk old) under the control of 2.5% isoflurane (Abbott). Tumors were allowed to grow for 1–2 wk to reach a diameter of approximately 0.5–1 cm. The animal study protocol was approved by the local ethical committee for animal research.
Blocking Experiments
The specificity of the 99mTc-labeled Nanobodies for EGFR was assessed in vitro. A431 cells (1.5 × 10⁴) were seeded in 24-well plates and allowed to adhere overnight. The cells were washed twice with ice-cold PBS; 0.15 μg (0.37–0.55 MBq) of 99mTc-7C12, 99mTc-7D12, or 99mTc-cAblys-3 (Nanobody specific to lysozyme) in 0.5% N-(2-hydroxyethyl)piperazine-N′-(2-ethanesulfonic acid)/0.5% bovine serum albumin was added to each well; and the plates were incubated 1 h on ice under slight shaking. The cells were washed twice again with ice-cold PBS to remove the unbound radioactivity. The cells were detached from the wells with 1 mL of 1 M sodium hydroxide and transferred into a counting tube. For the blocking, cells were incubated with 0.15 μg of 99mTc-7C12 or 99mTc-7D12 in the presence of 150 μg of unlabeled 7C12, 7D12, and cetuximab (Erbitux; ImClone Systems Inc.). R1M cells, an EGFR-negative tumor, were also incubated with 99mTc-7C12 or 99mTc-7D12. Cell-associated radioactivity was measured on an automated γ-counter (Cobra II Inspector 5003; Canberra-Packard) in parallel with the corresponding added activity and calculated as (counts bound to the cells/standard [counts added to the cells] × 100). Data presented are results from experiments performed in quadruplicate.
Pinhole SPECT/Micro-CT Imaging Procedure
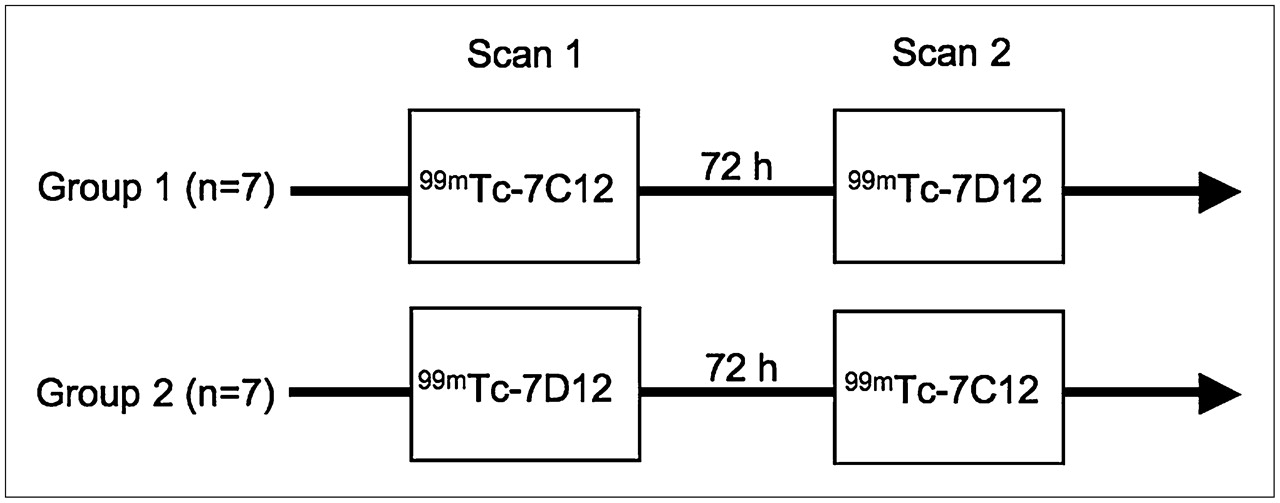
A431 xenografts (n = 14) were intravenously injected with 45–155 MBq (11 μg) of 99mTc-7C12 or 99mTc-7D12 Nanobodies. At 60 min after injection, mice were anesthetized with a mixture of 18.75 mg/kg ketamine hydrochloride (Ketamine 1000; CEVA) and 0.5 mg/kg medetomidin hydrochloride (Domitor; Pfizer). Each animal was studied with both tracers on separate days in an intraindividual crossover protocol. The term intraindividual refers to comparison of the 2 compounds within the same animal. The schematic representation of the crossover protocol is shown in Figure 2. A group of 7 mice was first studied with 99mTc-7C12 followed by 99mTc-7D12 with a 72-h interval. Another group of 7 mice was first studied with 99mTc-7D12 followed by 99mTc-7C12 72 h later. A subset of mice injected with 99mTc-7C12 or 99mTc-7D12 (n = 4) was also imaged at 24 h after injection. R1M xenografts (n = 3) that did not express the EGF receptor were used in a crossover study as a negative control.

Design of intraindividual study using crossover protocol. First group of mice (n = 7) was injected intravenously with 99mTc-7C12; pinhole SPECT/CT images (scan 1) were acquired at 1 h after administration. Same group of mice was injected 72 h later with 99mTc-7D12, and images (scan 2) were acquired at 1 h after injection. Second group of mice (n = 7) was first injected with 99mTc-7D12, followed by 99mTc-7C12 72 h later. Images were obtained in manner described earlier for mice injected with 99mTc-7C12.
Micro-CT imaging (Skyscan 1178; Skyscan) was followed by pinhole SPECT (e.cam180; Siemens Medical Solutions) on separate imaging systems. On both modalities, the animals were imaged in the same animal holder, which included 2 plastic discs, each containing three 57Co (3.7 MBq) sources (Canberra-Packard). The six 57Co sources were detected on both micro-CT and pinhole SPECT and used for alignment of CT and SPECT images. A micro-CT scan was performed using a dual-source CT scanner with 60 kV and 615 mA at a resolution of 83 μm. The total-body scan time was 2 min. Image reconstruction was performed using filtered backprojection (Nrecon; Skyscan). A total-body pinhole SPECT scan was performed using a dual-head γ-camera, mounted with 2 multipinhole collimators (3 pinholes of 1.5 mm in each collimator, 200-mm focal length, 80-mm radius of rotation). Images were acquired over 360° in 64 projections of 20 s each into 128 × 128 matrices, resulting in a total imaging time of 22 min. The micro-SPECT images were reconstructed using an iterative reconstruction algorithm modified for the 3-pinhole geometry (10) and automatically reoriented for fusion with CT on the basis of the six 57Co landmarks.
Image Analysis
Image viewing and quantification were performed using AMIDE (AMIDE's a Medical Image Data Examiner) software (11). Ellipsoid regions of interest (ROIs) based on the CT images were drawn on the muscle, liver, lungs, and brain; around the kidneys; and around the total body. The ROI was drawn on the contralateral muscle of the mouse in the left hind limb (on the opposite leg to that bearing the tumor). Because of insufficient contrast on the CT images between the tumor and the surrounding muscle tissue, SPECT images were used for drawing an ROI around the tumor. For delineation of the tumor, a threshold of at least 25% of the maximum pixel value on SPECT was chosen. For the calculation of tumor uptake at 24 h after injection, this threshold value was individually adjusted to obtain the same ROI volume as the tumor ROI at 1 h for the same animal.
Uptake was calculated as the counts in the tissue divided by the injected activity and normalized for the ROI size (%IA/cm3). A pinhole-SPECT image acquisition of a syringe with 37 MBq of 99mTc was performed as a reference for conversion of injected activity into measured counts in the image. Tracer elimination at 1 and 24 h was calculated by subtracting the total body counts at the time of imaging from the injected activity (corrected for decay) and then expressed as a percentage by multiplying by 100 and dividing by the injected activity.
Ex Vivo Analysis
The A431 mouse xenografts (n = 13) received via the lateral tail vein 22–96 MBq (11 μg) of 99mTc-7C12 or 99mTc-7D12 in 100–150 μL of 0.9% sodium chloride. At 1.5 h after injection, mice were sacrificed with a lethal dose of pentobarbital (Nembutal; CEVA). Tumor, kidneys, liver, lungs, brain, muscle, spleen, heart, and blood were removed and weighed, and the radioactivity was measured using an automated γ-counter (Cobra II Inspector 5003; Canberra-Packard). Tissue and organ uptake was calculated as percentage of injected activity per gram of tissue (%IA/g), corrected for decay.
In a separate group of mice (n = 3), blood samples were collected using a microcapillary at 1, 5, 10, 20, 30, and 60 min after injection of 99mTc-7C12 or 99mTc-7D12 to obtain a time–activity blood curve. The total blood volume (TBV) was calculated as 7% of the total body weight. The half-lives of both Nanobodies in vivo were determined using the biexponential nonlinear regression of graphing software (GraphPad Prism; GraphPad Software).
Statistical Analysis
Uptake of the 2 Nanobodies in tumor, tissues, and organs was expressed as the average ± SE and compared with a 2-tailed Wilcoxon signed rank test for the imaging experiments and a Mann–Whitney test for the dissection analysis, using GraphPad Prism. Each test was considered statistically significant when the P value was less than 0.05.
RESULTS
Nanobody Labeling and Specificity
The labeling efficiency of 99mTc-7C12 and 99mTc-7D12 was 92.7% ± 1.3% and 95.4% ± 0.9%, respectively.
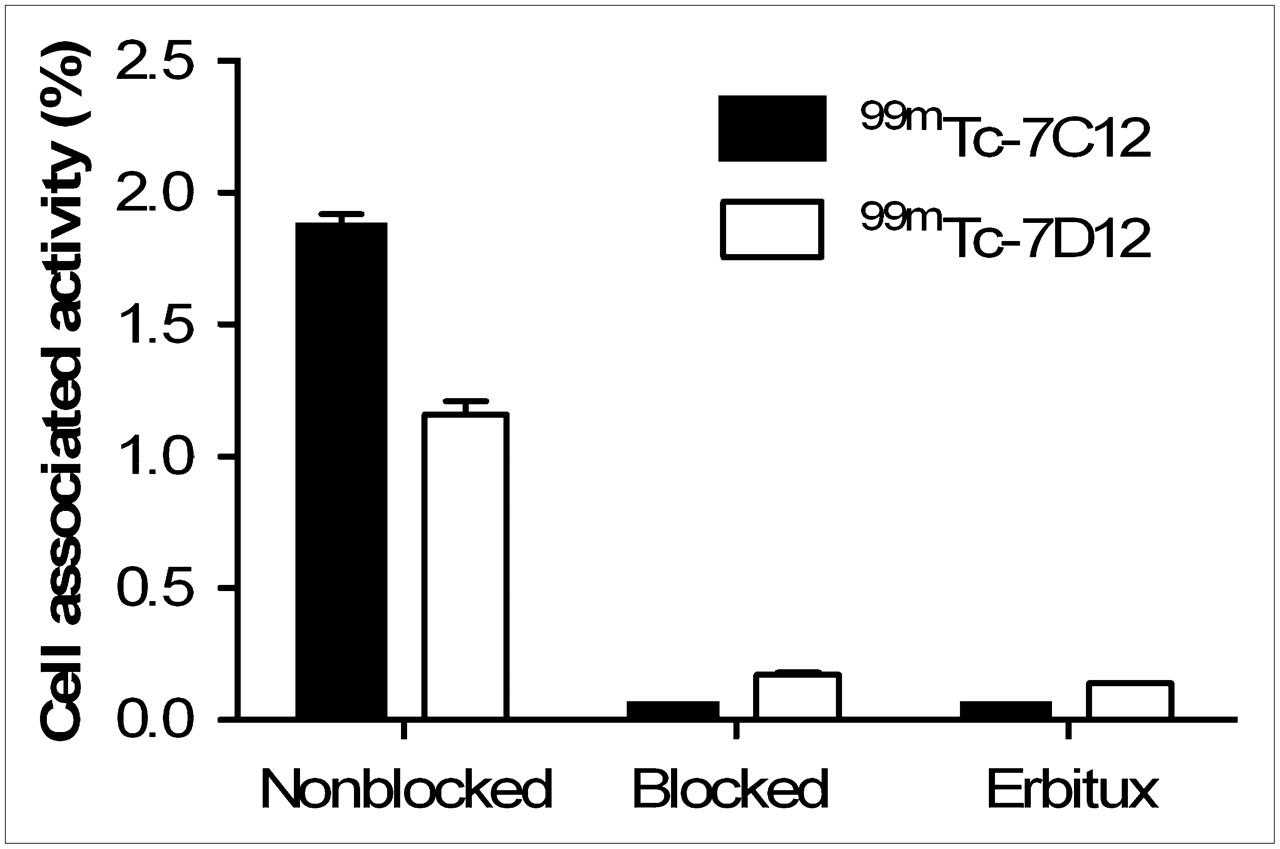
The binding specificity of 99mTc-7C12 and 99mTc-7D12 to the A431 cell line is shown in Figure 3. The binding of 99mTc-7C12 and 99mTc-7D12 to the cells was receptor-specific as it could be blocked by an excess of cold compound and cetuximab. Moreover, the binding of the 99mTc-cAblys-3 was negligible. Cell-associated activity of 99mTc-7C12 and 99mTc-7D12 to the R1M cell line was only 0.12 ± 0.05 and 0.17 ± 0.02, respectively.

In vitro specificity of 99mTc-7C12 and 99mTc-7D12 on A431 cell line after 2-h incubation on ice. Binding of labeled compound was blocked by 1,000-fold excess of unlabeled 99mTc-7C12, 99mTc-7D12, or cetuximab. Cell-associated activity was calculated as ([counts bound to cells/counts added to cells] × 100). Data are expressed as mean ± SE of experiments performed in quadruplicate.
Comparison of Biodistribution and Tumor Uptake Based on Pinhole SPECT/Micro-CT
The duration of 1 complete imaging procedure (pinhole SPECT/micro-CT) was less than or equal to 30 min. Pinhole SPECT/micro-CT images acquired at 1 h after injection show intense tracer uptake in the kidney cortex and urinary activity in the bladder in mice bearing either A431 or R1M. Increased uptake was observed in the EGFR-positive A431 tumor for both compounds (Fig. 4), whereas there was minor uptake in the R1M (negative-control) tumors. A volume-rendered video of a pinhole SPECT/micro-CT study of 99mTc-7C12 is available online as supplemental data (supplemental materials are available online only at http://jnm.snmjournals.org).
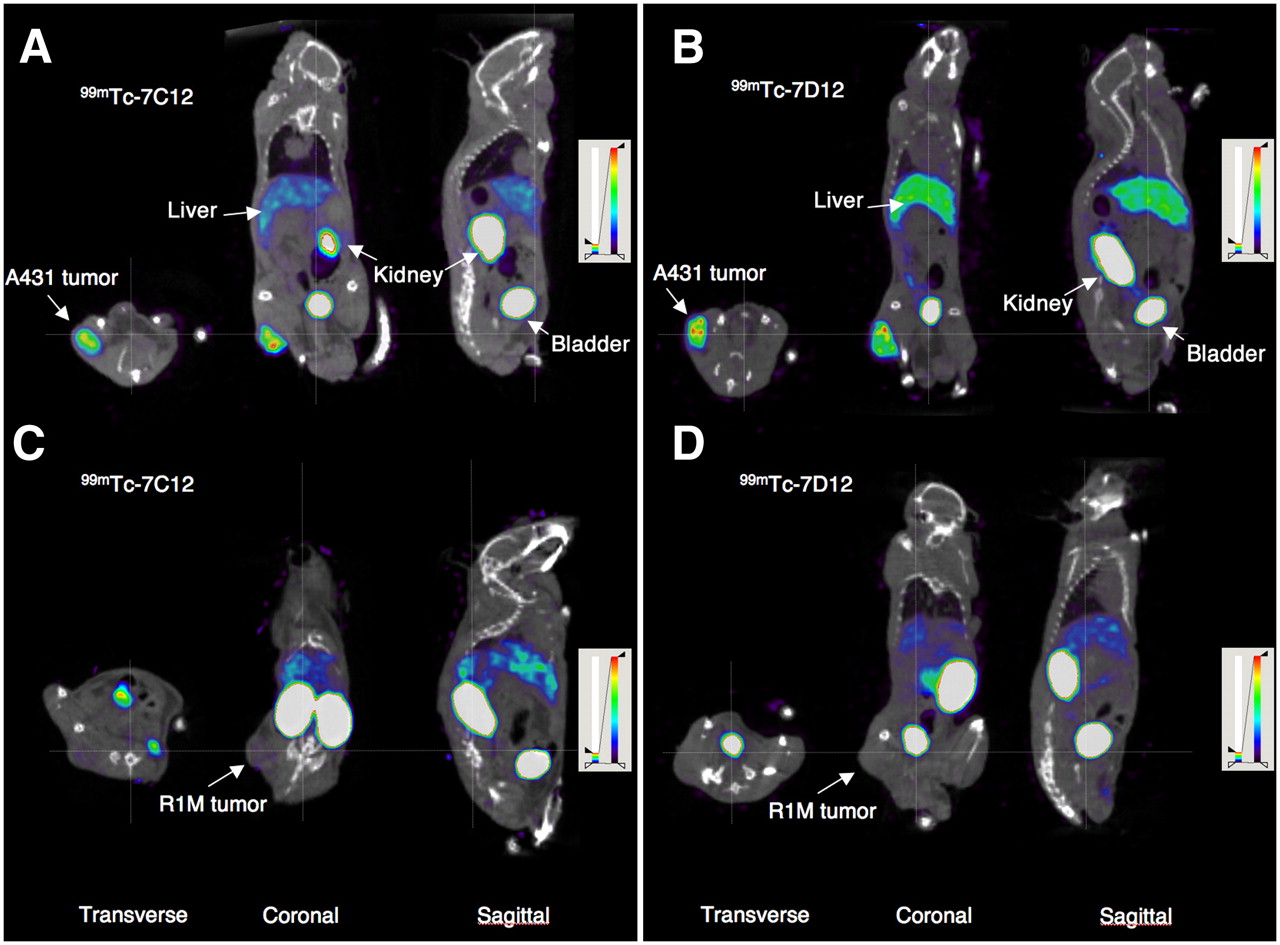
Transverse, coronal, and sagittal views of fused pinhole SPECT and micro-CT images of mice bearing A431 and R1M xenografts. A431 (A) and R1M (C) tumors injected with 99mTc-7C12. A431 (B) and R1M (D) tumors injected with 99mTc-7D12. Images were acquired at 1 h after injection. NIH+white color scale is used, and images are equally scaled down to 10% relative to maximum activity in image.
The data of the quantitative analysis of tracer uptake in the tumors and the tissues are shown in Table 1. The tumor uptake values of 99mTc-7C12 and 99mTc-7D12 at 1 h after injection were similar. The main elimination route is renal for both tracers, with significantly higher kidney retention for 99mTc-7C12. In contrast, liver uptake was low for both tracers and significantly lower for 99mTc-7C12 than for 99mTc-7D12. As a result, the average tumor-to-liver ratio was higher for 99mTc-7C12 (2.25 ± 0.41) than for 99mTc-7D12 (1.37 ± 0.20), although this difference did not reach statistical significance. The rapid tracer elimination from the blood also resulted in high tumor-to-background ratios: 32.05 ± 5.11 for 99mTc-7C12 and 21.18 ± 1.89 for 99mTc-7D12 (P = 0.07). Tracer elimination (excluding urinary activity in the bladder) from the body at 1 h after injection was similar for both Nanobodies: 16.87 ± 1.68 %IA for 99mTc-7C12 and 17.92 ± 1.53 %IA for 99mTc-7D12 (P = not significant). At 24 h after injection, tumor uptake was 2.75 ± 0.30 %IA/cm3 for 99mTc-7C12 (58% compared with the value obtained at 1 h after injection) and 2.67 ± 0.20 %IA/cm3 for 99mTc-7D12 (59% compared with the value obtained at 1 h after injection). Renal uptake remained high at 24 h after injection: 35.90 ± 7.29 and 37.64 ± 1.65 %IA/cm3 for 99mTc-7C12 and 99mTc-7D12, respectively. Total tracer elimination at 24 h after injection was 51.24 ± 6.27 %IA for 99mTc-7C12 and 49.45 ± 0.83 %IA for 99mTc-7D12 (P = not significant).
Uptake Values of 99mTc-7C12 and 99mTc-7D12 Based on Pinhole SPECT/Micro-CT at 1 Hour After Injection
Ex Vivo Analysis
The ex vivo biodistribution results of the dissection analysis are summarized in Table 2. The data confirm the intense kidney retention and the relatively low liver uptake for both compounds. The blood and heart values of 99mTc-7C12 are significantly lower than those for 99mTc-7D12. The kidney uptake in %IA/g was not significantly different. However, a significant difference was present when the data were expressed as %IA in the total kidney: 76.23 ± 1.52 %IA for 99mTc-7C12 versus 66.05 ± 3.65 %IA for 99mTc-7D12 (P < 0.05). This could be explained by a variable weight of the kidneys between different animals. There was a trend toward lower liver, lung, and brain uptake for 99mTc-7C12.
Biodistribution of 99mTc-7C12 and 99mTc-7D12 Based on Dissection at 1.5 Hours After Injection
There was a higher tumor uptake for the animals that received 99mTc-7C12 than for those that received 99mTc-7D12 (P = 0.05). However, the average tumor weight was lower for 99mTc-7C12 than for 99mTc-7D12: 321.5 mg (range, 118.9–641.4 mg) versus 414.9 mg (range, 212.1–838.7 mg), respectively. As shown in Figure 5, tumor uptake expressed in %IA/g decreased with increasing tumor weight. Although tumor uptake increases with decreasing tumor weight for both tracers, the relative increase was not linear and became smaller with increasing tumor size.

Tumor uptake (%IA/g) of 99mTc-7C12 (A) and 99mTc-7D12 (B) expressed as function of tumor weight in nu/nu mouse A431 xenografts. Animals were dissected at 1.5 h after injection of tracer. Tumor uptake, in %IA/g, decreased with increasing tumor size.
The tumor-to-blood ratio was significantly higher for 99mTc-7C12 than for 99mTc-7D12: 22.16 ± 2.99 and 8.82 ± 2.27, respectively (P < 0.05). Tumor-to-muscle ratios were 23.8 ± 10.1 for 99mTc-7C12 and 19.3 ± 7.51 for 99mTc-7D12 (P > 0.05).
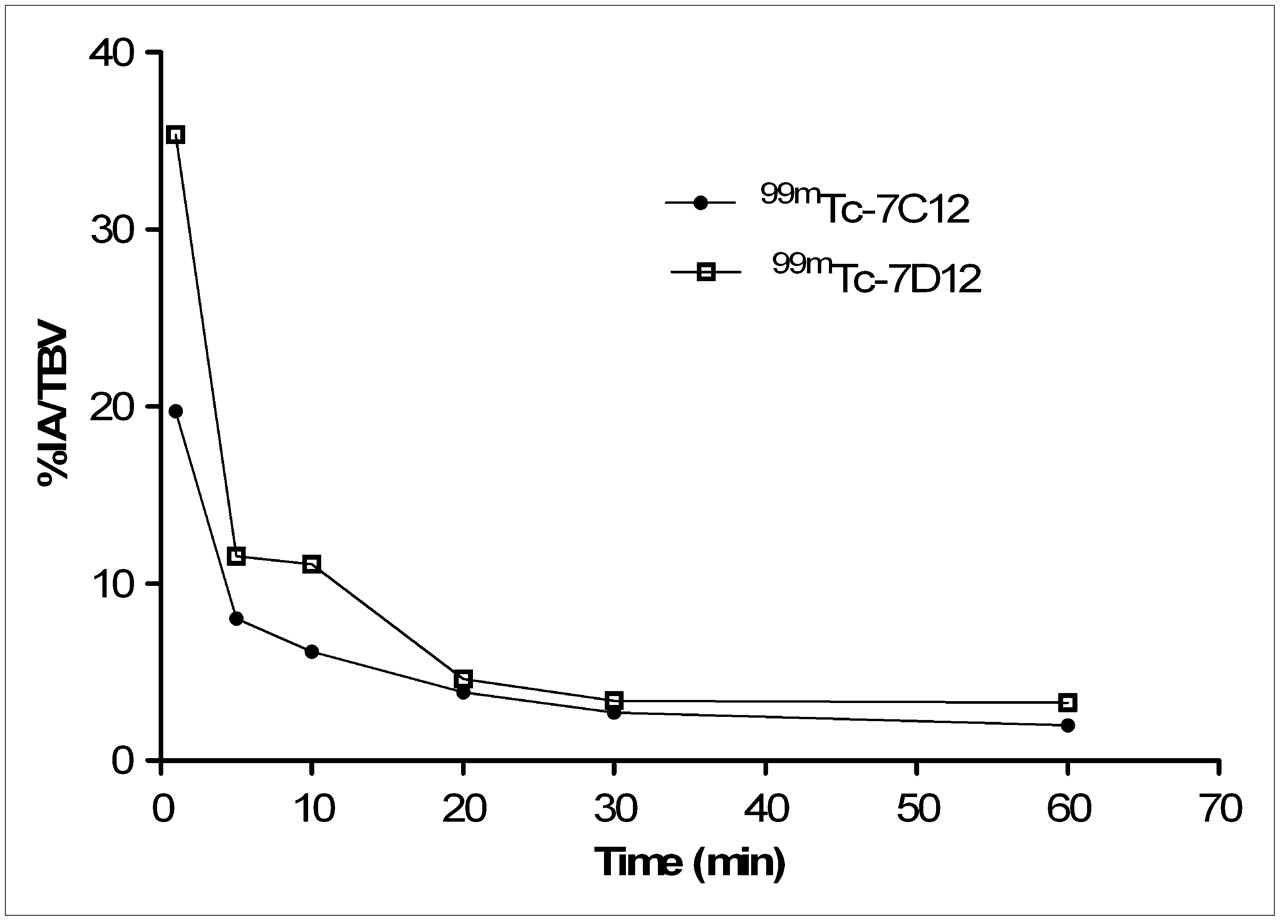
The blood-pool activity was assessed at different time points (Fig. 6), and the analysis indicated that 99mTc-7C12 and 99mTc-7D12 Nanobodies are rapidly cleared from the blood. The blood-clearance curves were analyzed by nonlinear regression, and both fragments showed a biphasic-clearance curve with calculated half-lives of 0.25 and 9.12 min for 99mTc-7C12 and 0.32 and 9.36 min for 99mTc-7D12. The plateau was reached at 1.84 %IA/TBV and 2.30 %IA/TBV, respectively, for 99mTc-7C12 and 99mTc-7D12.

Blood clearance. Non–tumor-bearing nu/nu mice (n = 3) received intravenous injection of 99mTc-7C12 or 99mTc-7D12. Blood samples were collected at indicated time points and analyzed with γ-counter. Half-life was determined using biexponential nonlinear regression fit (GraphPad Prism).
DISCUSSION
EGFR, a receptor tyrosine kinase, is highly expressed on most epithelial cancer cells and remains a prime target for antibody-based detection and therapeutic applications (12,13). The gold standard for the evaluation of EGFR status is immunohistologic examinations. However, information provided by the obtained biopsies is not always representative of the overall lesions in the patients. Therefore, a noninvasive imaging method using radiopharmaceuticals targeted to EGFR would be useful in characterizing EGFR-positive cells and selecting patients for therapy directed against EGFR. We used pinhole SPECT/micro-CT and ex vivo analysis to evaluate in vivo tumor uptake and biodistribution of 2 specific anti-EGFR Nanobodies. An intraindividual comparison of 2 radiolabeled anti-EGFR Nanobodies was performed on mice xenografts of A431 (EGFR-positive) and R1M (EGFR-negative) tumors.
Renal uptake was high for both compounds; this property is typical for peptides and small proteins whose molecular weight is below the threshold that can be filtered by the glomerular membrane (<60 kDa) (14). It is believed that nonspecific renal activity accumulation is caused by the electrostatic interactions between positively charged peptides and the negatively charged surface of tubular cells as peptides are filtered in the glomerulus and reabsorbed in the cells of the proximal tubuli (15). Elevated renal uptake and prolonged retention of radiolabeled Nanobodies might be problematic not only for imaging lesions in the vicinity of the kidneys but also for the therapeutic application of such agents. However, encouraging results have recently been achieved in reducing radiation nephrotoxicity by infusion of cationic or polycationic amino acids before the administration of the radiolabeled compounds (14,16,17). Renal uptake was high for both compounds but was significantly higher for 99mTc-7C12 than for 99mTc-7D12. The 2 Nanobodies used in this study differ by the 4 amino-acid substitutions Q1A, K3Q, E5V, and T14A in the framework region 1 (FR1) and 1 substitution, A103T, in the complementary determining region 3 (CDR3).
Although hepatic accumulation of both Nanobodies was observed, uptake was very low compared with studies using 99mTc-Nanobodies (18,19), 64Cu-labeled cetuximab, and 99mTc-labeled affibody (20,21). 99mTc-7D12 uptake was higher in the liver and lower in the kidneys than was 99mTc-7C12 uptake. High liver uptake of 99mTc-7D12 could be explained by the amino-acid sequence and lipophilicity. Hepatobiliary clearance of the radiolabeled peptides is dependent on the lipophilicity and could be influenced by the chelator and the radionuclide used (21,22). Both Nanobodies used cleared rapidly from the blood, compared with conventional antibodies and antibody fragments (23). The low blood values (<1 %IA/g) at 1.5 h after injection are far below what is observed for intact monoclonal antibodies (typically >10 %IA/g) and even fragments (3,16,23). Although single-chain variable fragments (scFvs) specific for EGFR have not yet been studied, the pharmacokinetic and in vivo biodistribution of radiolabeled scFvs directed at other targets such as CC49 and c-erbB2 have been described earlier (24,25). In these studies, the blood activity was 3.7 and 7.80 %IA/g, respectively, which is approximately 10-fold higher than the 0.42 %IA/g obtained in the present study. These data suggest the superiority of Nanobodies to scFv for imaging, as they can provide high image quality much earlier after administration. However, a direct comparison of Nanobodies to scFv should be performed.
The short blood half-life (within 10 min) allowed early imaging of tumors with already high contrast at 1 h after injection. Blood value was significantly lower for 99mTc-7C12 than for 99mTc-7D12 and also resulted in lower heart uptake. Taken together, the rapid clearance of radiolabeled Nanobodies renders them ideal probes for imaging, although limitations can exist in imaging lesions in the area of the kidneys. 99mTc-7C12 showed more favorable biodistribution than did 99mTc-7D12, with its lower blood and liver uptake.
The binding of both tracers to the tumor cells was receptor-specific as shown by the blocking experiments and low uptake in EGFR-negative tumors. Uptake in EGFR-expressing tumors was high for both compounds, whereas the EGFR-negative tumors showed only minor uptake. This confirms the selective targeting of the anti-EGFR Nanobodies that have affinities in the nanomolar range. The trend toward higher uptake for 99mTc-7C12 could be explained by the amino-acid substitution in the antigen-binding region and its slightly better affinity. However, this observation was found only in the dissection study. Here we observed a decreasing %IA/g with increasing tumor weight. This phenomenon, also described by Williams et al. (26), is probably because of the inclusion of necrotic areas in the larger samples. The trend toward a higher tumor uptake for 99mTc-7C12, compared with 99mTc-7D12, in the ex vivo study might therefore be explained by the smaller average of tumor size analyzed with 99mTc-7C12. This would suggest that the comparison based on in vivo imaging is more reliable than the dissection study. Alternative explanations for the reduced tracer uptake in the larger tumors could be insufficient penetration of the imaging probe into the central tumor areas or reduced expression of EGFR in the core of larger tumors.
Our method of in vivo comparison of the biodistribution and tumor targeting of 2 compounds within the same animal reduces the influence of interanimal differences in kidney and liver function in our analysis. In addition, the variability in tumor size and composition between different animals can be substantial. The problem of some tumor growth between the 2 imaging studies cannot be completely eliminated using an intraindividual study design, but it is reduced using a crossover protocol. However, the tumor growth rate can still be different between animals and as a result could induce some variability of the measurements. An objective noninvasive measurement of the number of viable tumor cells might help resolve this issue. Quantification of tracer uptake at the tumor site based on imaging resulted in slightly lower values, compared with the ex vivo measurements. The configuration of the multipinhole system used in this study has a resolution of 2 mm (10), whereas the diameter of the tumors was 3–5 times larger. An underestimation of the tracer uptake in the smallest tumors might therefore be present. In the present study, we used a threshold of at least 25% of the maximum pixel value on the SPECT image for tumor delineation. This value was chosen because it allowed correct delineation of the tumor at the interface between tumor and air when compared with the micro-CT image. Delineation of the complete tumor based on micro-CT alone was not possible because of insufficient contrast at the tumor–muscle interface. The use of a threshold also effectively eliminated central necrotic areas in the larger tumors from our analysis.
An excellent tumor-to-background ratio (>20) was obtained early, at 1 h after injection, and is explained by the rapid elimination of unbound tracer from the blood circulation. The high tumor-to-liver ratio of both fragments favors their use as imaging agents even in the case of liver metastasis. A high tumor-to-blood ratio was obtained early, within 1–1.5 h after injection; however, this can be achieved only after several hours or days with conventional monoclonal antibodies and most antibody fragments (3,16,27,28). The tumor-to-background ratio was significantly higher for 99mTc-7C12 than for 99mTc-7D12.
The images at 24 h after injection showed high retention (±60%) of the probes inside the tumor, suggesting that labeling Nanobodies with an isotope with high-energy capacity, such as 131I, might provide a good therapeutic approach for the treatment of cancer cells expressing EGFR.
CONCLUSION
The high tumor uptake, rapid blood clearance, and low liver uptake of Nanobodies make them powerful probes for noninvasive imaging of antigen expression. They allow images to be obtained early after injection, although limitations in imaging lesions inside or around the kidneys can be encountered. Pinhole SPECT/micro-CT is an efficient tool to compare in vivo biodistribution and tumor uptake intraindividually. On the basis of the biodistribution analysis, we selected 99mTc-7C12 as an imaging probe for noninvasive imaging of EGFR expression in tumors.
Acknowledgments
The research at ICMI is funded by the Interuniversity Attraction Poles Programme–Belgian State–Belgian Science Policy. Lea Olive Tchouate Gainkam is a fellow of the Horizontal Onderzoek Axis (HOA) of the VUB. Lieven Huang is supported by a predoctoral grant from the Instituut voor de aanmoediging van Inovatie door Wetenschap en Technologie in Vlaanderen (IWT–Vlaanderen). Tony Lahoutte is a senior clinical investigator of the Research Foundation–Flanders (FWO). Marleen Keyaerts is a fellow of the FWO. We acknowledge Cindy Peleman for her technical assistance with the small-animal pinhole SPECT/micro-CT imaging. We thank Axel Bossuyt for his helpful discussions.
Footnotes
-
COPYRIGHT © 2008 by the Society of Nuclear Medicine, Inc.
References
- Received for publication October 23, 2007.
- Accepted for publication January 16, 2008.


Jump to section
Related Articles
Cited By...
- Development of novel high-affinity nanobodies against EGFR for cancer therapy
- Cell type-specific intracellular protein delivery with inactivated botulinum toxin
- Single-Domain Antibody Theranostics on the Horizon
- AAV mediated delivery of a novel anti-BACE1 VHH reduces Abeta in an Alzheimers disease mouse model
- A Novel Engineered Small Protein for Positron Emission Tomography Imaging of Human Programmed Death Ligand-1: Validation in Mouse Models and Human Cancer Tissues
- PET Imaging of Macrophage Mannose Receptor-Expressing Macrophages in Tumor Stroma Using 18F-Radiolabeled Camelid Single-Domain Antibody Fragments
- A Novel Engineered Anti-CD20 Tracer Enables Early Time PET Imaging in a Humanized Transgenic Mouse Model of B-cell Non-Hodgkins Lymphoma
- Synthesis, Preclinical Validation, Dosimetry, and Toxicity of 68Ga-NOTA-Anti-HER2 Nanobodies for iPET Imaging of HER2 Receptor Expression in Cancer
- Therapeutic stem cells expressing variants of EGFR-specific nanobodies have antitumor effects
- Nanobody-Based Targeting of the Macrophage Mannose Receptor for Effective In Vivo Imaging of Tumor-Associated Macrophages
- Nanobodies Targeting the Hepatocyte Growth Factor: Potential New Drugs for Molecular Cancer Therapy
- Nanobodies Targeting Mouse/Human VCAM1 for the Nuclear Imaging of Atherosclerotic Lesions
- In Vitro Analysis and In Vivo Tumor Targeting of a Humanized, Grafted Nanobody in Mice Using Pinhole SPECT/Micro-CT
- Nanobodies as Tools for In Vivo Imaging of Specific Immune Cell Types
- Efficient Tumor Targeting with High-Affinity Designed Ankyrin Repeat Proteins: Effects of Affinity and Molecular Size