


Abstract
SPECT of ventilation/perfusion (V/Q) lung scans not only improves the diagnostic accuracy of the method but also facilitates the application of advanced image-processing techniques. On the basis of such techniques, our study aimed at developing a procedure that automatically analyzes V/Q lung scans with regard to match and mismatch defects. Methods: Fifty-three patients with suspected pulmonary embolism had lung scans using the SPECT technique as well as 16-slice multidetector-row spiral CT within an interval of 48 h. After iterative image reconstruction and computerized linear registration of the V/Q scans, the ventilation was normalized to the perfusion. For the automated detection of mismatch defects, the perfusion was subtracted from the ventilation, whereas for the detection of match defects, the perfusion was subtracted from the inverted ventilation. Two experienced referees assessed all images. The final diagnosis was made at a consensus meeting while taking into account all of the imaging modalities, laboratory tests, clinical data, and evaluation of a follow-up period. Results: The sensitivity, specificity, and accuracy of the conventional visual assessment were 0.91, 0.97, and 0.94, respectively, compared with 0.95, 0.84, and 0.89, respectively, for the automated algorithm. Artifacts imitating mismatch defects in the pulmonary recesses accounted for the relatively low specificity of the automated analysis. Artifacts of that kind were found in 15 patients and led to a false-positive diagnosis in 5 patients. However, by combining the visual and the automated approach, all artifacts could be easily identified leading to a sensitivity, specificity, and accuracy of 0.95, 1.0, and 0.98, respectively. Additionally, in all 12 patients of the cohort with highly heterogeneous ventilation and perfusion, the automated analysis made correct diagnoses. Conclusion: Because of the 3-dimensional properties of the SPECT data, the analysis of lung scans can be automated and objectified. The algorithm produces images that are easy to read and well suited for demonstration. Because of artifacts in the pulmonary recesses introduced by the automated approach, its diagnostic accuracy does not reach the level of the conventional analysis yet. Could these artifacts be overcome, the efficiency of the automated algorithm would be at least equivalent to that of conventional image interpretation. At present, best results can be achieved by combining both approaches.
With regard to ventilation/perfusion (V/Q) lung scintigraphy, several studies have recently assessed the effectiveness of SPECT in the diagnosis of pulmonary embolism, yielding highly encouraging results (1–5). These data were received with such great interest that an increasing number of departments have implemented SPECT in their lung scan protocols by now. Besides the improvement in diagnostic accuracy, the tomographic acquisition opens up other prospects as well. Because of the 3-dimensional properties of the scans, sophisticated image-processing techniques can be applied to establish a direct connection between the ventilation and perfusion data.
Our study aimed at developing an automated algorithm for the detection of match and mismatch defects in tomographic lung scans by applying image-processing techniques such as linear registration, normalization, and arithmetic procedures to the V/Q scans. The arithmetic procedures comprised inversion, subtraction, division, and multiplication of the SPECT data. The purpose of our diagnostic approach was the implementation of an objective assessment system for lung scans that is particularly helpful in complex cases with heterogeneous ventilation and perfusion. Special care was taken to determine the detection rate and the diagnostic efficiency of the automated algorithm in comparison with conventional visual image interpretation. In addition, the results were analyzed with regard to systematic errors that may be inherent in the automated approach.
MATERIALS AND METHODS
Subjects
Fifty-three patients (22 men, 31 women; mean age ± SD, 56.4 ± 19.9 y; age range, 20–92 y) were examined between July 2003 and July 2005. The subjects were chosen from a pool of 669 CT examinations and 593 V/Q lung scans performed during that period on patients with suspected pulmonary embolism. The retrospective study was designed according to the regulations of the local board for protection of data privacy and confidentiality. Only patients who had V/Q lung scintigraphy using the SPECT technique as well as multidetector-row spiral CT (MDCT) within an interval of 48 h were included in the study. In addition, only those patients were considered who were examined with γ-camera systems that are able to produce files in the DICOM (digital imaging and communication in medicine) format—a prerequisite for the automated algorithm.
The mean time ± SD between CT and V/Q scintigraphy was 0.9 ± 0.8 d. The maximum interval of 48 h was chosen because the endogenous lysis of even small pulmonary clots takes at least 2–3 d, whereas larger clots cannot be lysed endogenously in less than a week (6).
V/Q Scintigraphy
V/Q lung scintigraphy was performed exclusively with the SPECT technique using a double-head γ-camera equipped with low-energy, high-resolution, parallel-hole collimators (ECAM; Siemens). Ventilation scans were done after inhalation of about 50 MBq of the ultrafine aerosol 99mTc-technegas (Vita Medical Ltd.) over 3–5 respiratory cycles (7–9). To this end, the technegas generator was loaded with a mean activity of 462 ± 86 MBq 99mTc-O4. Perfusion scintigraphy was done immediately after the ventilation scan with a mean activity of 198 ± 28 MBq 99mTc-labeled macroaggregated albumin (TechneScan LyoMAA; Tyco Healthcare) administered over 5 respiratory cycles. All patients remained in supine position throughout the examination. A 360° SPECT acquisition of the pulmonary ventilation and perfusion was performed using a 64 × 64 matrix. For this purpose, a 180° rotation per head was done in 32 steps of 30 s each. Accordingly, the acquisition time per SPECT turn was 16 min. The scans were reconstructed using an iterative ordered-subsets expectation maximization algorithm (OSEM; 12 iterations, 4 subsets). Afterward, a 3-dimensional isotropic Gauss filter was applied (full width at half maximum, 10 mm). All data were recorded in the standardized DICOM format.
Image Processing
An essential precondition for the functionality of the automated algorithm is an exact spatial agreement between the ventilation and the perfusion scan. To this end, an automated linear registration algorithm based on the maximization of mutual information was applied to the V/Q scans using the Hermes MultiModality software (Hermes Medical Solutions Ltd.), release 5.0-F (10,11). The results of the automated registration process were checked visually and proved to be precise in all cases. Therefore, no further manual postprocessing was required. Afterward, the ventilation was normalized to the perfusion as the activity applied for the ventilation scan is substantially lower than that of the perfusion scintigraphy. In a first step, the voxel containing the maximum number of counts was identified in both the ventilation and the perfusion scan. For truncation of low-background counts a clip value, CV = 0.02, was defined. All voxels containing a smaller number of counts than the product between the maximum of the particular scan and the CV were set to zero. Thereafter, the mean number of counts was calculated for each slice of the V/Q scans. After that step, ratios were computed between those mean values for each corresponding pair of slices in the perfusion and ventilation. For example, the ratio for slice x was calculated by dividing the mean number of counts of that particular slice in the perfusion scan by the respective value of the corresponding slice in the ventilation. The median of those ratios was chosen. The decisive ratio used for the normalization was found by calculating the mean value of all ratios within the interval (median, +3% to −3%). In the final step of the normalization process, the counts in all voxels of the ventilation scan were multiplied by this value. The aim of the procedure was to minimize the effect of statistical outliers.
The automated detection of mismatch defects was realized in 2 steps: in the first step, the perfusion was subtracted from the normalized ventilation so that the resulting image contained only mismatch defects, which are defined as regions with regular ventilation but severely reduced or no perfusion. All negative values were set to zero. In the second step, the subtracted image was fused with the perfusion scan to improve topographic orientation. Figure 1 illustrates the process flow.
Process flow of automated algorithm for detecting mismatch defects. Although ventilation (A) shows no pathologic changes, a substantial defect can be found on the perfusion scan (B). After registration, normalization, and subtraction, the image contains only mismatch defects (C = A − B). To improve topographic orientation, the subtracted image (C) is fused with the perfusion scan (D = C + B). An exemplary coronal slice is shown.
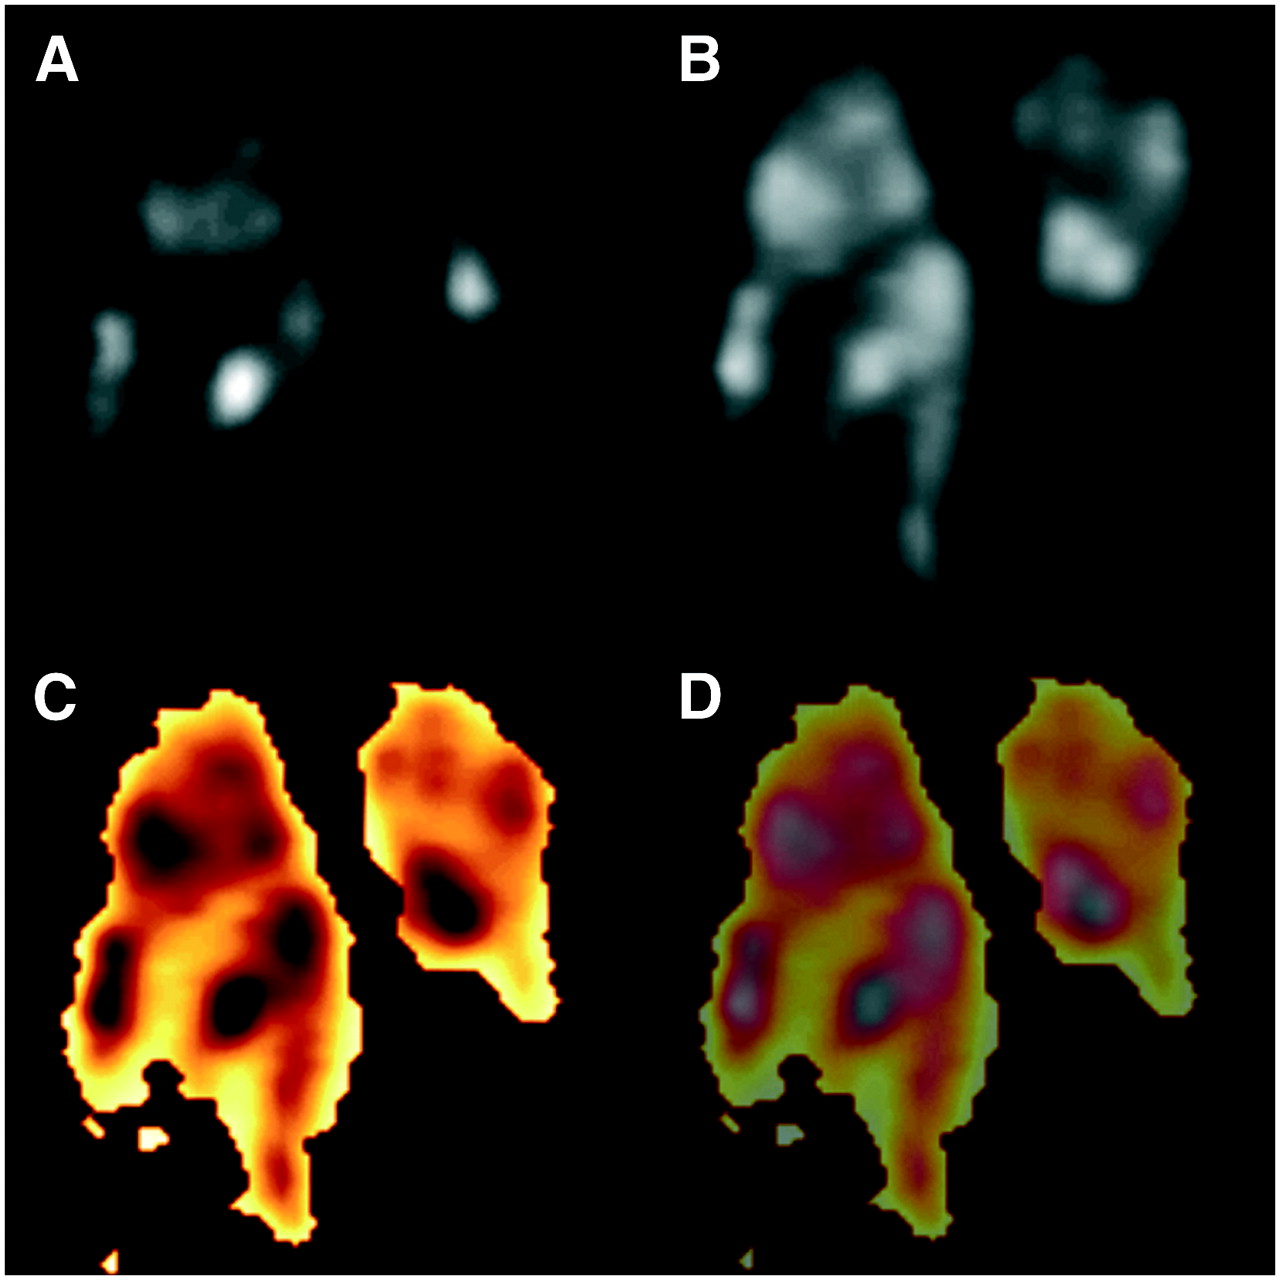
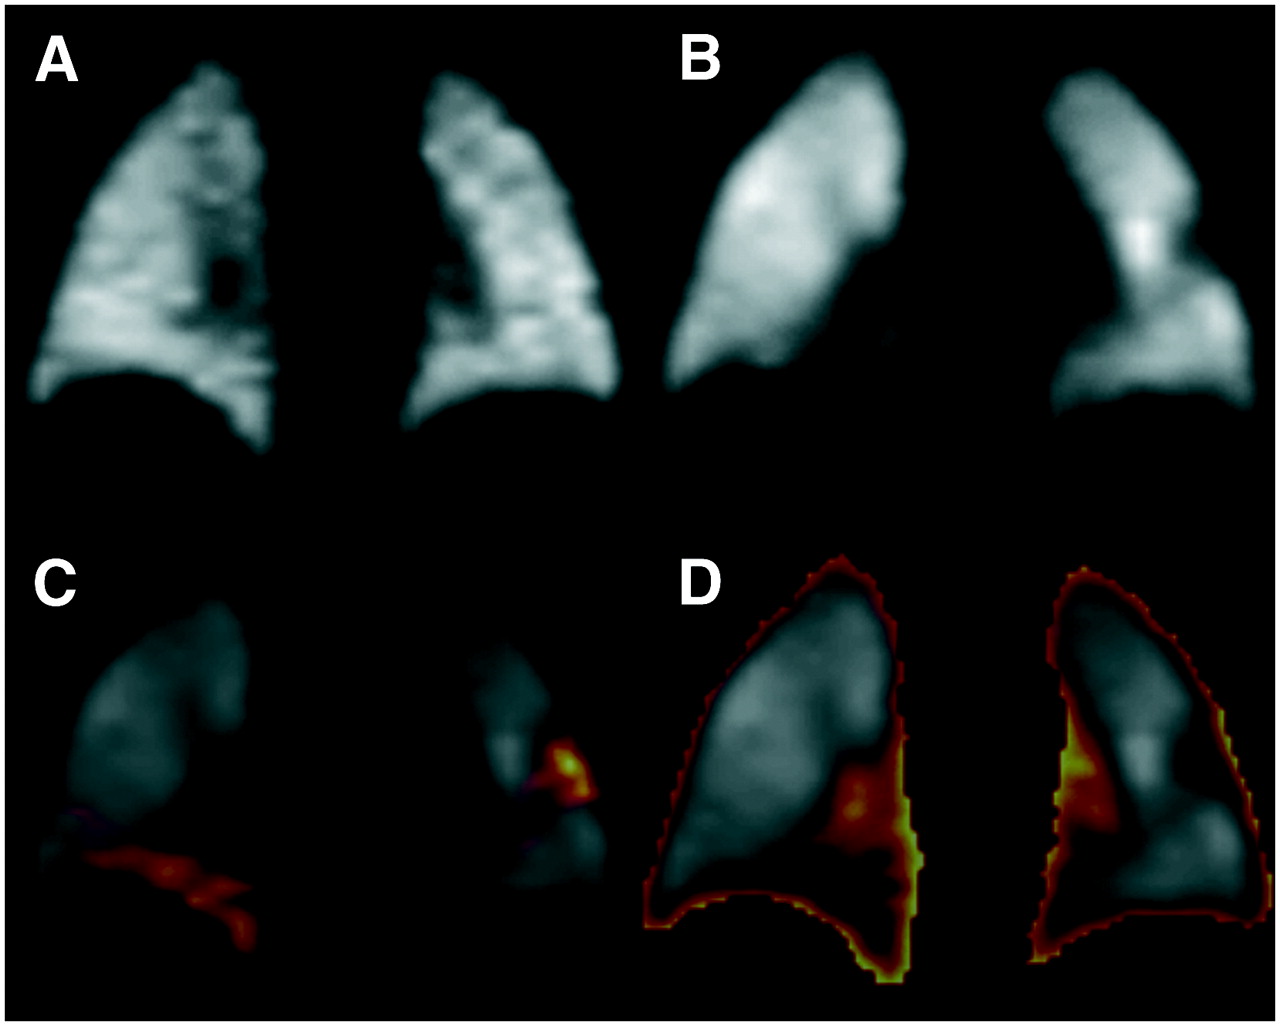
In principle, the automated detection of match defects was realized analogous to the algorithm just described. In comparison, it required only 1 additional step: after normalization of the studies, the ventilation scan had to be inverted, which means that regions with a low counting statistic were transformed into regions with a high counting statistic and vice versa. After subtraction of the perfusion from the normalized and inverted ventilation, the resulting image contained only match defects, which are characterized as pulmonary regions affected by a severe reduction or complete loss of perfusion while the ventilation in these regions is likewise distinctly reduced. Again, all negative values were set to zero. As described earlier, the subtracted image was fused with the perfusion scan to improve topographic orientation. An example of this process is given in Figure 2.

Process flow of automated algorithm for detecting match defects: patient with heterogeneous ventilation (A) and perfusion (B) due to severe chronic obstructive pulmonary disease. After normalization, registration, inversion, and subtraction, image contains only match defects (C = AInverse − B). To improve topographic orientation, the subtracted image (C) is fused with the perfusion scan (D = C + B). Multiple match defects in both lungs are displayed in yellow (D). An exemplary coronal slice is shown.
MDCT
MDCT examinations for pulmonary thromboembolism were done using a 16-slice scanner (SOMATOM Sensation 16; Siemens) after intravenous application of 120 mL contrast medium at a flow rate of 3 mL/s (iopromide [Ultravist 370]; Schering). A saline chaser bolus of 30 mL was administered directly after the contrast agent with a flow rate of 3.5 mL using a double-head power injector (Injektron CT 2; Medtron). On the basis of bolus-tracking methodology, an individual start delay was chosen for each patient. A scan of the entire chest was performed during a single inspiratory breath-hold. Scan parameters were 120 kV and 100 mA, using a thin collimation of 16 × 0.75 mm and a table speed of 15–18 mm per rotation (pitch, 1.25–1.5). Tube rotation time was 0.5 s. Therefore, the entire thorax was examined in approximately 10 s. Three sets of images were reconstructed with an adapted field of view in correspondence with body height and weight. For hard-copy printouts, axial slices were reconstructed and displayed in 5-mm-thick sections, using 2 different reconstruction algorithms (“smooth”, Siemens B30; “sharp”, Siemens B50). However, diagnoses regarding pulmonary embolism were established by soft-copy reading using thin axial slices (effective slice thickness STeff = 1.0 mm) that were reconstructed with an overlap of 30% (reconstruction increment RI = 0.7 mm).
Assessment
In a first run the V/Q SPECT scans were assessed conventionally by 2 experienced referees who were unaware of the results of other examinations and clinical data. For each case, coronal, transversal, and sagittal slices were analyzed visually. Contrary to the proceedings in our earlier study (2), planar images were not taken into consideration for this investigation. A consensus between the 2 referees was reached by discussing each case. After an interval of 1 wk, the results of the automated algorithm were evaluated in the course of a second run. A segmental lung reference chart was used for both analyses. With the help of this chart, the localization of each defect was recorded as well as its type (match or mismatch) and extent (segmental or subsegmental). All cases with mismatch defects of at least half-segment size were assessed as pulmonary embolisms. The final diagnosis was made at a consensus meeting while taking into account all imaging modalities (V/Q SPECT, MDCT), clinical data, D-dimer levels, the opinions of the physicians responsible for treatment, and a clinical follow-up of at least 6 mo (maximum, 12 mo). However, the images produced by the automated algorithm were not taken into consideration for this purpose.
Statistical Analysis
Statistical analysis was done using SPSS for Windows, release 12.0. Results are expressed as mean ± SD. Significance was tested using the nonparametric χ2 test, with P < 0.05 being considered significant.
RESULTS
Image processing took only about 10 min per case as the registration of the V/Q scans was done automatically within seconds by the MultiModality software. Forty-seven patients (88.7%) required spatial adjustments of varying extent, whereas the remaining 6 patients (11.3%) showed a satisfactory agreement so that no further corrections were necessary. Of the 47 patients requiring registration, 26 (49.1%) were adjusted by translational corrections, 3 (5.7%) were adjusted by rotation, and 18 (34.0%) were adjusted by both translation and rotation.
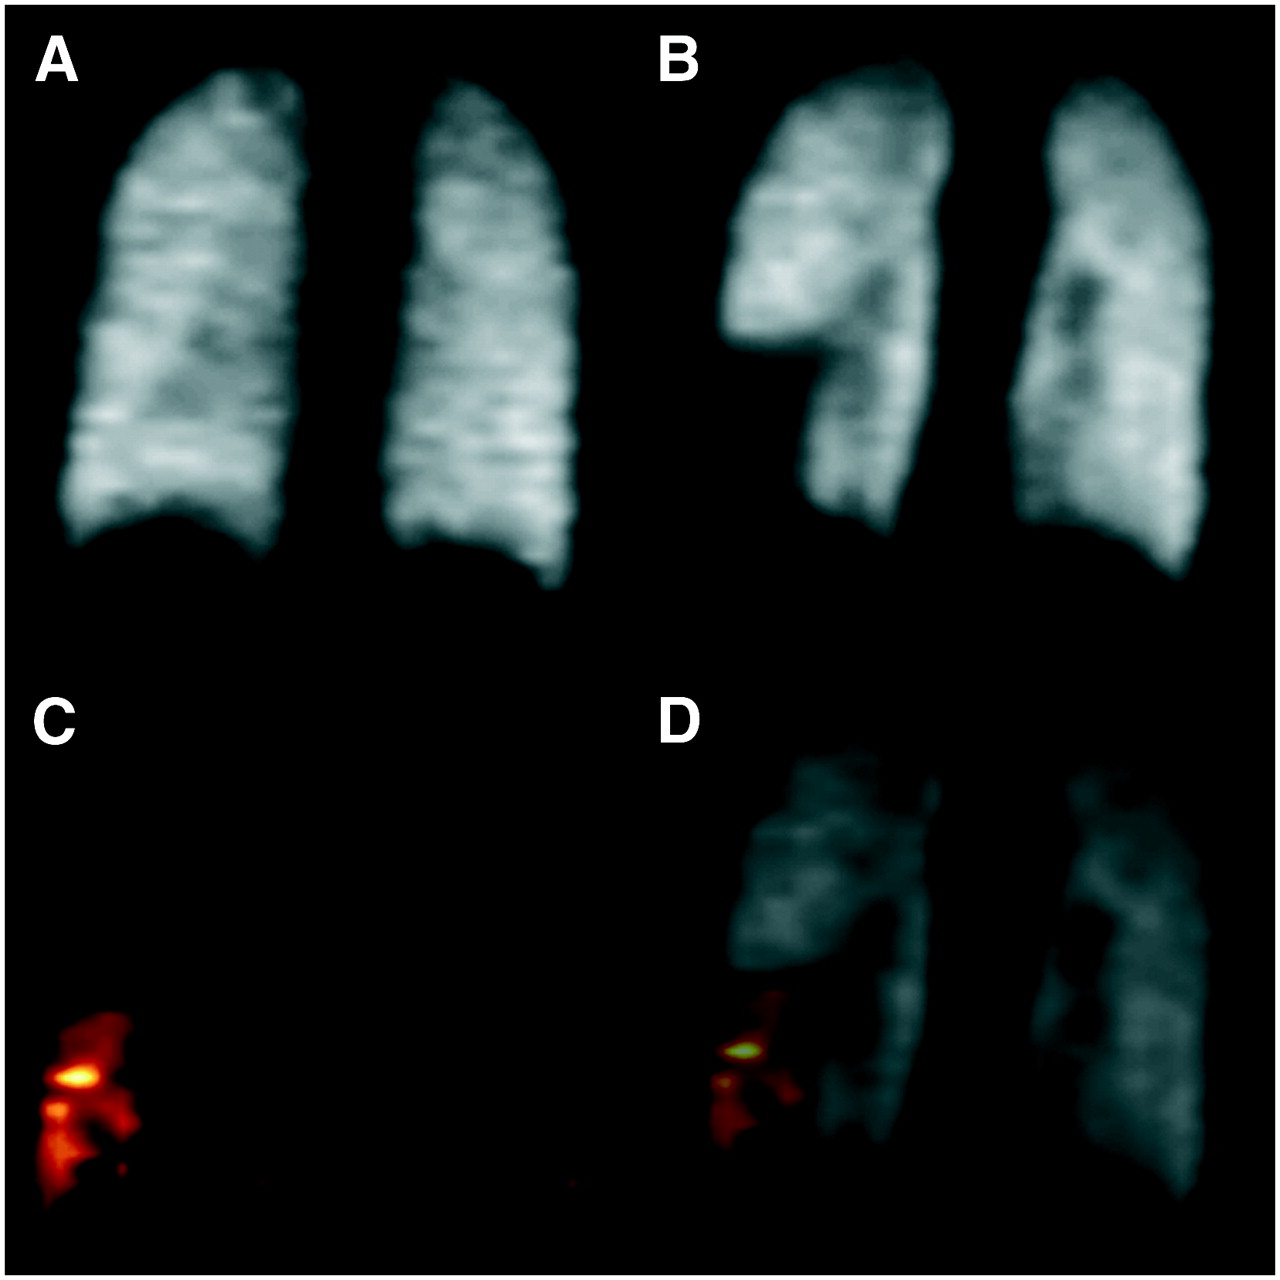
At the consensus meeting, pulmonary embolism was diagnosed in 22 of the 53 patients (41.5%). The correct diagnosis was made by conventional image interpretation in 50 of 53 patients (94.3%), whereas the automated algorithm yielded correct findings in 47 patients (88.7%). An example of a positive case is shown in Figure 3. The exact results of the evaluation as well as the corresponding statistical data are given in Table 1. Artifacts in the region of the pulmonary recesses, as shown in Figure 4, were the cause of the higher number of false-positive cases and, thus, of the lower specificity of the automated analysis. Image artifacts of this kind were found in 15 patients and led to a false-positive diagnosis in 5 patients. In 13 of the 15 patients (86.7%), the artifacts were located in the costodiaphragmatic recesses, whereas the costomediastinal recesses were affected in only 2 patients (13.3%).

Patient with pulmonary embolism. Although ventilation (A) shows no pathologic changes, perfusion defects were found in both lungs (B). Automated algorithm detected both embolisms (C). Match defects, on the other hand, were found neither by automated approach (D) nor by conventional image interpretation. An exemplary coronal slice is shown.
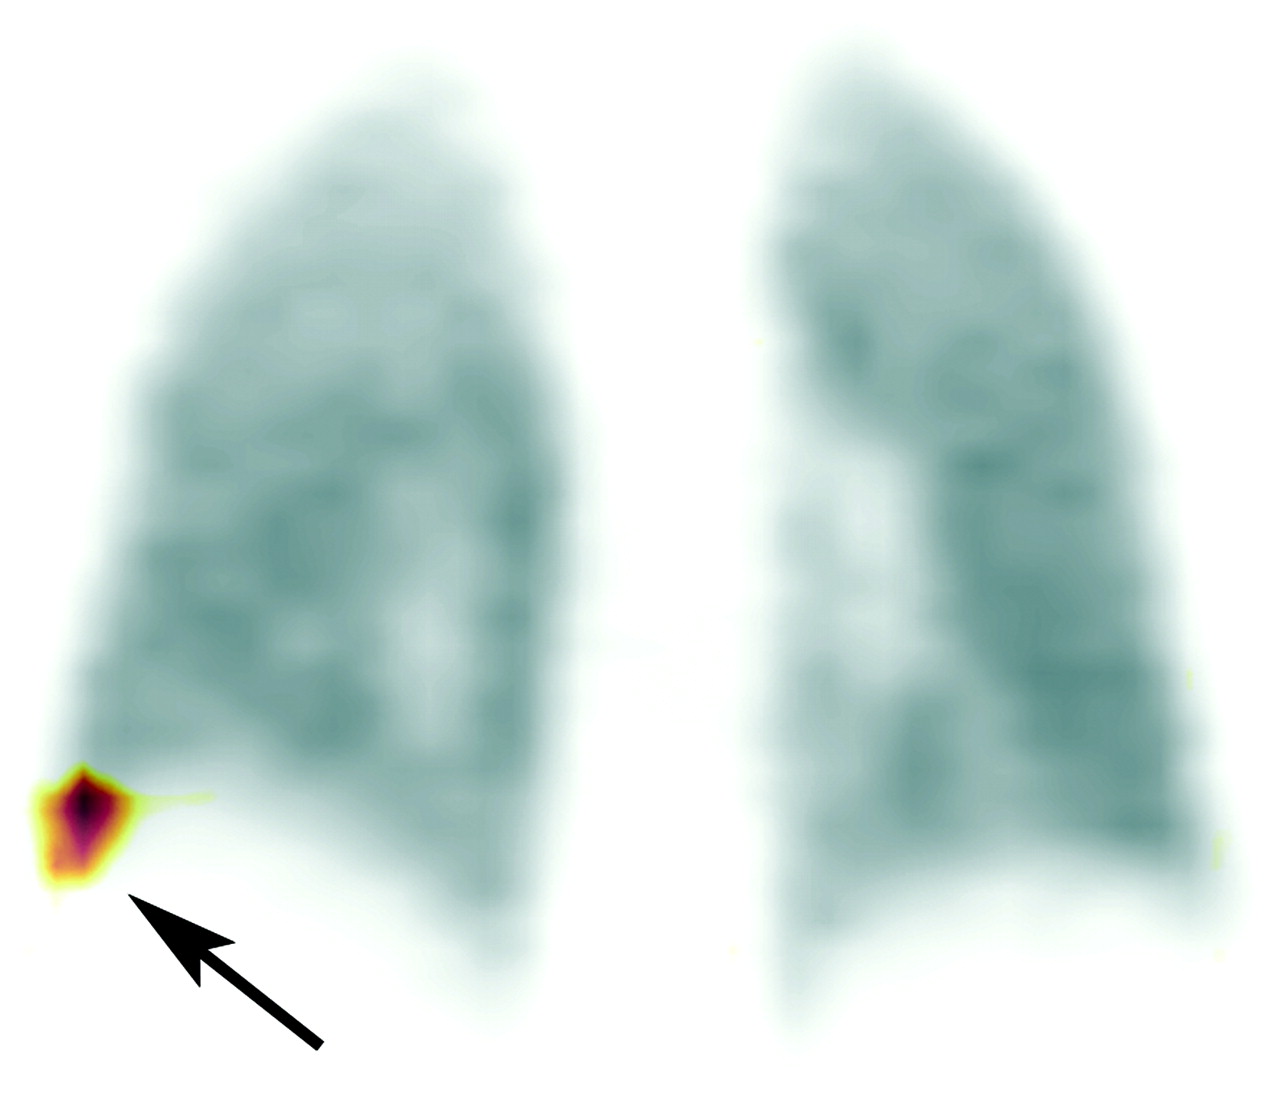
Result of automated mismatch detection in a patient with a false-positive diagnosis attributed to an artifact in right costodiaphragmatic recess (arrow). In conventional reconstructed images, corresponding region showed neither perfusion defect nor hyperventilation. An exemplary coronal slice is shown.
Diagnostic Efficiency of Automated Algorithm (Automated) in Comparison with Conventional Image Interpretation (Conventional) to Detect Pulmonary Embolism (n = 53)
Because of obstructive or restrictive pulmonary disease, the V/Q scans of 12 patients (22.6%) were highly heterogeneous. Remarkably, all of these patients were diagnosed correctly by the automated algorithm.
Figure 5 shows the results of a comparison between the automated analysis and the conventional assessment with regard to the detection rate of pathologic lesions. Overall, the automated algorithm increased the number of identified defects significantly by 29.0% (+31 defects, P = 0.034). However, a more sophisticated comparison that differentiates between match and mismatch defects as well as between segmental and subsegmental lesions yielded no significant increase. For this analysis, the artifacts in the pulmonary recesses were removed from the dataset.
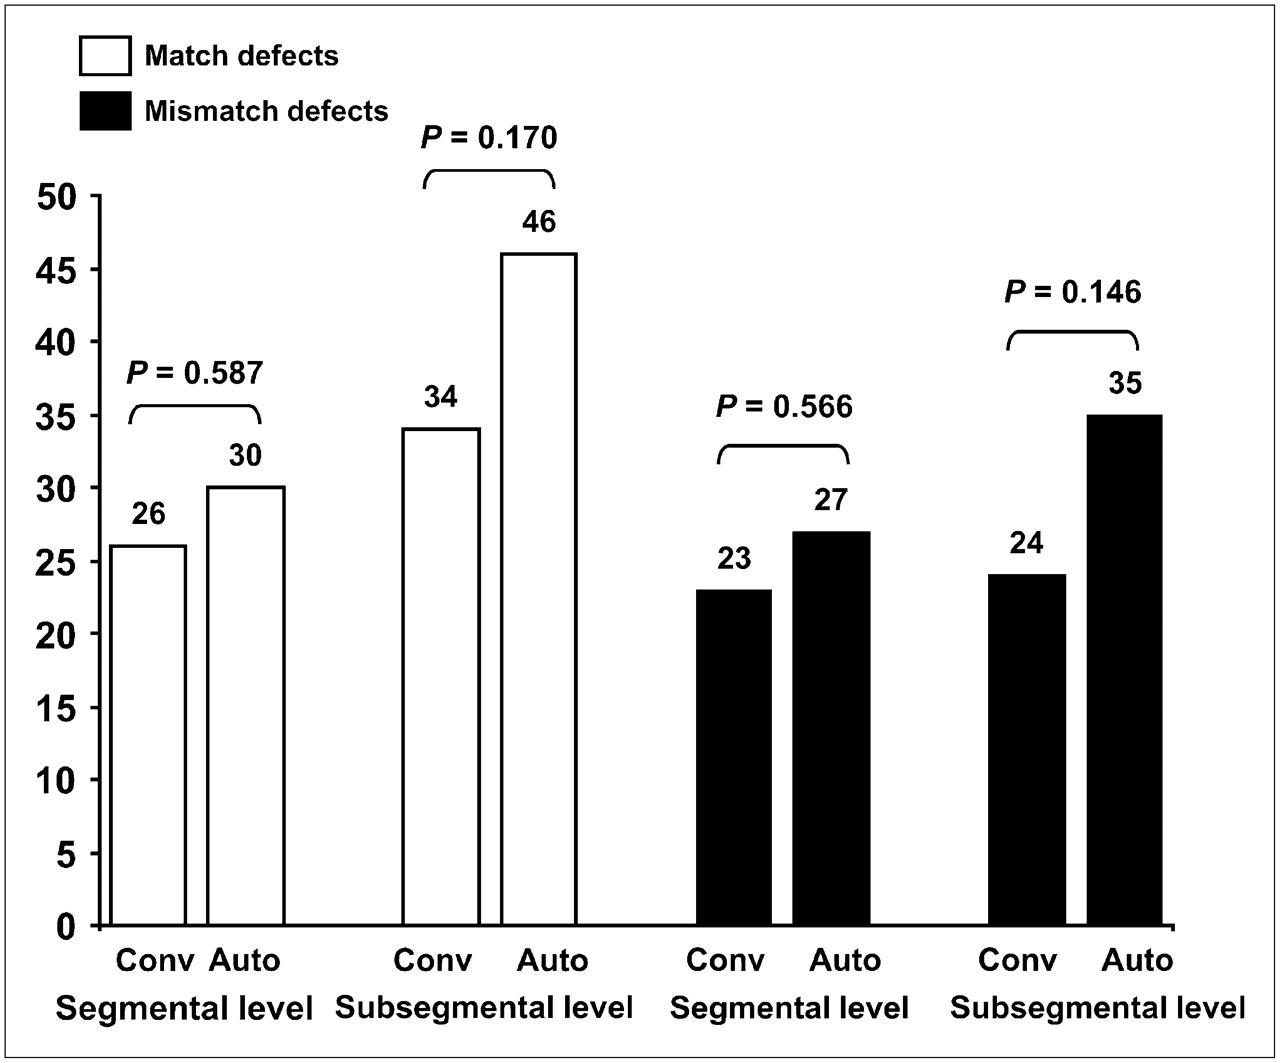
Comparison between conventional image interpretation (Conv) and automated evaluation (Auto) with regard to number of match and mismatch defects detected on segmental and subsegmental levels. For this analysis, artifacts in pulmonary recesses were removed from dataset.
DISCUSSION
In comparison with conventional image reconstruction, the data processing required for the automated algorithm prolonged the work flow by about 10 min per patient. This prolongation is due to the fact that not all parts of the procedure are fully automated yet because of missing program interfaces in the commercially available camera software. Should these interfaces be made available, the whole process could be computerized completely so that the automated analysis would be finished in <1 min. In this context it must be mentioned that, in principle, the automated approach can also be applied to planar V/Q scans. To do so, the process must be repeated for each view separately—thus, leading to 6–8 production steps.
With regard to the detection rate of pathologic lesions, the automated algorithm led to a significant improvement (P < 0.05). Especially at the subsegmental level, the number of detectable defects was increased substantially by 39.7% (+23 defects, P < 0.05) in comparison with the conventional analysis. At the segmental level, the increase proved to be statistically not significant (+16.3%, +8 defects, P = 0.424). Even so, the data show that the detection rate of the method definitely benefits from the objectified evaluation.
In our cohort, the prevalence for pulmonary embolism was 41.5%, which agrees well with reported literature values of between 30% and 48% (2,12–16). The conventional evaluation yielded a diagnostic accuracy of 0.94, which is concordant with the results from our earlier study in which we analyzed the efficiency of V/Q SPECT and multislice spiral CT in the diagnosis of pulmonary embolism (2). In comparison, the automated approach yielded an accuracy of 0.89. All patients with a positive diagnosis for embolism by the conventional analysis also had a correct detection by the computerized algorithm. Beyond that, in 1 patient the automated approach revealed a pulmonary embolism that was overlooked in the conventional evaluation because of the small size of the corresponding mismatch defect and its localization near the pulmonary surface. Therefore, the sensitivity of the automated algorithm even exceeds that of the conventional analysis, although not significantly. On the other hand, the artifacts in the pulmonary recesses introduced by the automated approach led to a relatively low specificity of only 0.84 and, thus, to a diagnostic accuracy inferior to that of the conventional evaluation. Even so, the computerized analysis of the SPECT data at least surpasses the efficiency of planar V/Q imaging, which yields values with an accuracy of between 0.77 and 0.81 (2,3,14). The best results were achieved by combining both the automated analysis and the conventional evaluation. In that way, all artifacts could be easily identified, reducing the number of false-positive cases to 1 and, thus, yielding a sensitivity, specificity, and accuracy of 0.95, 0.97, and 0.96, respectively.
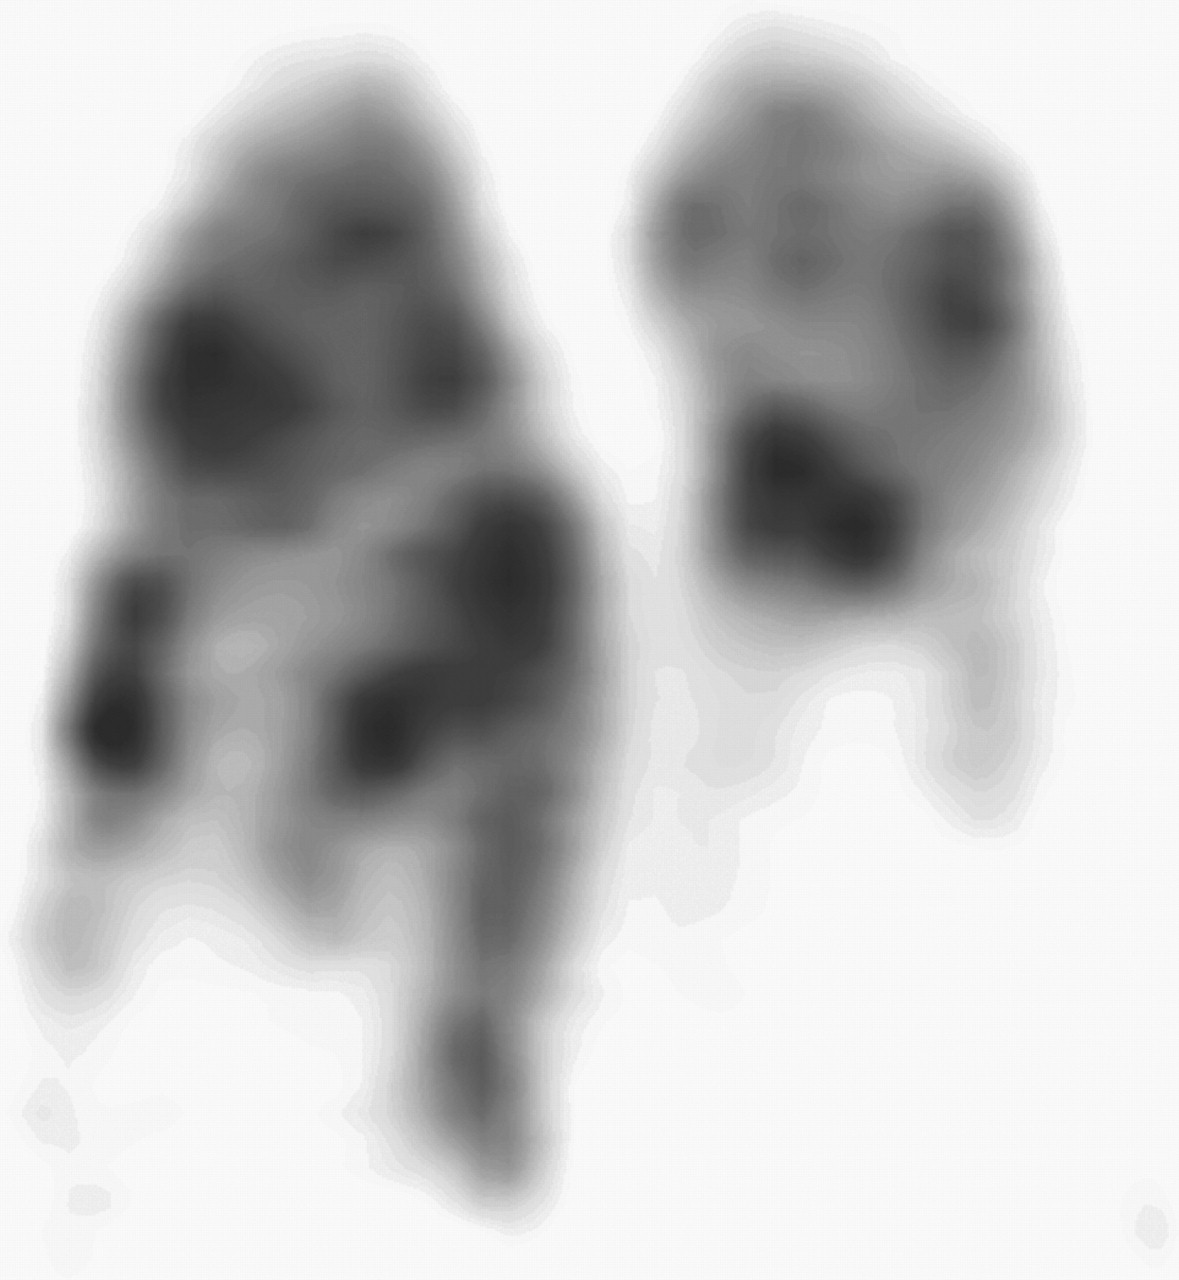
Furthermore, it must be stressed that the automated approach yielded no false-positive result in any of the patients with heterogeneous ventilation and perfusion. This fact is relevant because the interpretation of such cases can be time-consuming and difficult. Exemplarily, Figure 6 shows the result of the automated mismatch detection in a patient with severe chronic obstructive pulmonary disease. The corresponding results of the automated match detection are displayed in Figure 2.

Result of automated mismatch detection in a patient with highly heterogeneous perfusion due to severe chronic obstructive pulmonary disease. An exemplary coronal slice is shown. Automated algorithm correctly confirmed absence of embolism. Affected regions would have been displayed in red. Corresponding results of computerized match detection are shown in Figure 2.
With regard to the 2 patients with a false-negative diagnosis by V/Q scintigraphy, CT showed a nonocclusive central embolism in both cases. In 1 of these patients a peripheral mismatch defect was found but was considered to be smaller than half-segment size and, therefore, was not assessed as a pulmonary embolism. Yet, on the image produced by the automated algorithm, the defect exceeded half-segment size, so an embolism was diagnosed. With regard to the second case, no mismatch defects were found, either conventionally or in the automated detection.
The cause of the artifacts in the pulmonary recesses introduced by the automated algorithm remains unclear. Potentially, they are induced by a change in the depths of respiratory excursion during the acquisitions. At the beginning of the examination, most patients are somewhat anxious and nervous, whereas in the latter part of the examination they become more accustomed to the process and the environment. This could lead to a decrease in the depth of respiratory excursion and, thus, cause the mismatch artifacts in the pulmonary recesses where respiratory motion is most intense. In that case, the acquisition of respiratory-gated SPECT scans as described by Suga et al. might be helpful (17,18). Could those artifacts be overcome, the sensitivity, specificity, and accuracy of the automated algorithm would rise to 0.95, 0.97, and 0.96, respectively, and therefore reach a level comparable to that of conventional image interpretation.
CONCLUSION
SPECT of V/Q lung scans not only increases the diagnostic accuracy of the method but also permits the application of advanced image-processing techniques. With the help of these techniques, the detection of match and mismatch defects can be automated and objectified. In comparison with conventional image interpretation, the automated analysis leads to a significant improvement in the detection rate of pathologic lesions. The images are easy to read and well suited for demonstration. As far as sensitivity is concerned, the computerized procedure proved to be excellent, especially in complex cases with heterogeneous ventilation and perfusion. Yet, it could not surpass the accuracy of conventional image interpretation, primarily because of artifacts in the pulmonary recesses. Could these artifacts be overcome, the efficiency of the automated algorithm would be at least equivalent to that of the conventional approach. At present, the best results can be achieved by combining both the automated analysis and the conventional evaluation.
Acknowledgments
The authors thank Tyco Healthcare Germany for covering the expenses for the color reproduction.
References
- Received for publication December 5, 2005.
- Accepted for publication February 11, 2006.


