


Abstract
We investigated whether PET/CT angiography using 11C-(R)-PK11195, a selective ligand for the translocator protein (18 kDa) expressed in activated macrophages, could allow imaging and quantification of arterial wall inflammation in patients with large-vessel vasculitis. Methods: Seven patients with systemic inflammatory disorders (3 symptomatic patients with clinical suspicion of active vasculitis and 4 asymptomatic patients) underwent PET with 11C-(R)-PK11195 and CT angiography to colocalize arterial wall uptake of 11C-(R)-PK11195. Tissue regions of interest were defined in bone marrow, lung parenchyma, wall of the ascending aorta, aortic arch, and descending aorta. Blood-derived and image-derived input functions (IFs) were generated. A reversible 1-tissue compartment with 2 kinetic rate constants and a fractional blood volume term were used to fit the time–activity curves to calculate total volume of distribution (VT). The correlation between VT and standardized uptake values was assessed. Results: VT was significantly higher in symptomatic than in asymptomatic patients using both image-derived total plasma IF (0.55 ± 0.15 vs. 0.27 ± 0.12, P = 0.009) and image-derived parent plasma IF (1.40 ± 0.50 vs. 0.58 ± 0.25, P = 0.018). A good correlation was observed between VT and standardized uptake value (R = 0.79; P = 0.03). Conclusion: 11C-(R)-PK11195 imaging allows visualization of macrophage infiltration in inflamed arterial walls. Tracer uptake can be quantified with image-derived IF without the need for metabolite corrections and evaluated semiquantitatively with standardized uptake values.
Molecular imaging with PET and 18F-FDG has proven suitable to detect vascular inflammation mainly in vascular beds that are not accessible for biopsy (1,2). The increasing use of hybrid PET scanners and concomitant CT angiography offers the advantage of a precise colocalization of the signal onto a clearly delineated vessel wall anatomy (3–5).
[N-methyl-11C]-(R)-1-(2-chlorophenyl)-N-(1-methylpropyl)-3-isoquinoline carboxamide, or 11C-(R)-PK11195, is a radioligand that specifically binds to the translocator protein (18 kDa), formerly also referred to as ω3 receptor, or peripheral benzodiazepine receptor (6). High levels of translocator protein (18 kDa) are expressed in macrophages when activated by cytokines, making them a potential imaging target for large-vessel inflammation (5,7,8).
Over the last 2 decades, 11C-(R)-PK11195 has been extensively used to study neuroinflammation in a wide range of brain disorders (9–14). The quantitative analysis of 11C-(R)-PK11195 brain studies has been challenging because of the relatively small amount of specific binding, the absence of an anatomically defined reference region in the brain, and the specific binding of 11C-(R)-PK11195 in brain blood vessels (15–19). Therefore, specific methodology for the analysis of dynamic brain PET studies with 11C-(R)-PK11195 has been developed to extract reference tissue kinetics with cluster analysis (9,17) and to account for vascular activity in the reference region (18).
Quantitative studies of inflammatory processes in the lungs (20,21) and joints (22,23) have been performed by means of kinetic modeling with plasma input functions (IFs) derived from direct blood sampling (20–22) or obtained from the blood pool in the image (24). The tissue uptake was expressed as tissue-over-plasma activity concentration ratio, and only the most recent of these studies used compartmental modeling to obtain total volume of distribution (VT) estimates (22).
The discriminatory power of this tracer was assessed comparing patients with active giant cell arteritis and Takayasu's arteritis of the great vessels with patients with systemic lupus erythematosus.
The primary objective was to develop a quantitative methodology for imaging large-vessel inflammation with 11C-(R)-PK11195 deriving both plasma and image IFs, alongside the question of whether the plasma IF needs correction for the fraction of unmetabolized radioligand.
Dynamic scanning with continuous blood sampling might not be feasible in a solely clinical environment. Hence, to explore the agreement of quantitative and semiquantitative measurements, we compared the performance of the standardized uptake value (SUV) (5) with the results of quantitative kinetic analysis.
MATERIALS AND METHODS
Study Population
From Hammersmith Hospital rheumatology outpatient clinic, 7 patients with the systemic inflammatory disorders giant cell arteritis, Takayasu's arteritis, or systemic lupus erythematosus were enrolled. Three patients had signs and symptoms of active vasculitis, defined as onset within the previous 6 wk of any of the following symptoms: visual disturbance, headache, bruit or vascular pain/tenderness, new claudication, fever, night sweats, or arthralgia. The remaining 4 patients were asymptomatic. Exclusion criteria for all patients were known intolerance to iodinated contrast agent, inability to lie flat, a prior PET scan within 1 y of the study, age lower than 25 y or higher than 75 y, or claustrophobia. The study protocol was approved by the local Research Ethics Committee, and all patients gave written informed consent. Radiation exposure was licensed by the U.K. Administration of Radioactive Substances Advisory Committee.
PET/CT Protocol
Imaging was performed using a 16-slice PET/CT scanner (Discovery RX; GE Healthcare) with a 15-cm field of view positioned in the region of the aortic arch and its branches. A low-dose CT scan was acquired in helical mode for attenuation correction with the following parameters: 120 kV, 20 mAs, 8 × 2.5-mm slice thickness, pitch of 1.675, and 0.5-s rotation time. After intravenous injection of 6.85 MBq of 11C-(R)-PK11195 per kilogram of body weight, PET emission data were acquired over 60 min in list-mode format and rebinned into 18 temporal frames (30-s background, 1 × 15 s, 1 × 5 s, 1 × 10 s, 1 × 30 s, 4 × 60 s, 7 × 300 s, and 2 × 600 s).
After the PET scan, CT angiography was performed with the same field of view as the PET scan. A bolus of 70 mL of contrast material (Ultravist 370; Schering) was injected at a rate of 3.5 mL/s into an antecubital vein. The CT angiography acquisition parameters were 120 kV, 180 mAs, 16 × 0.625-mm slice thickness, pitch of 1.0, and 0.5-s rotation time.
Image Reconstructions
All PET emission scans were normalized for detector inhomogeneity and corrected for randoms, dead time, scatter, and attenuation. Two different image reconstructions were performed. First, the 18 frames of the dynamic emission scans were reconstructed using the 3-dimensional reprojection algorithm (25) with the ramp filter set to Nyquist frequency to obtain fully quantitative images. Second, the dynamic frames were also reconstructed using an ordered-subset expectation maximization algorithm with 2 iterations and 21 subsets (26) to obtain images with superior visual quality allowing manual definition of regions of interest (ROIs). For both reconstruction algorithms, a matrix size of 128 × 128 × 47 voxels was used, with a voxel size of 2.28 × 2.28 × 3.27 mm.
Initial reconstruction parameters for CT angiography were 0.625-mm slice thickness, 0.625-mm increment, 30-cm-wide reconstruction field of view, window width of 300 Hounsfield units, and window level of 30 Hounsfield units.
Definition of ROIs
ROIs were defined on the PET images overlaid with the rebinned CT images using dedicated software developed in-house within Matlab 6.5 (The MathWorks) (Data Supplement I provides full details; supplemental materials are available online only at http://jnm.snmjournals.org).
Blood Sampling and Generation of the Plasma IF
Arterialized venous blood was sampled continuously for the initial 20 min of the scan from the antecubital vein of a heated arm or the dorsal vein of a heated hand.
Arterialization was confirmed by a venous blood oxygen partial pressure greater than 60 mm Hg (27). Plasma samples were analyzed for radiolabeled metabolites (Data Supplement I provides full details of the sampling protocol).
11C-(R)-PK11195 has never been evaluated for large-vessel disease, and it is unknown whether radiolabeled metabolites reach the target region. Therefore, 2 different IFs were generated: they represent either the total activity concentration in plasma (total plasma) or the activity concentration in plasma due to parent 11C-(R)-PK11195 (parent plasma). For the generation of the plasma IFs, the time course of the plasma-over-blood (POB) ratio obtained from the 8 discrete arterialized venous samples was fitted to a straight-line model:
The models for the POB ratio and for the parent fraction were used for both the blood sampler–derived IFs (BSIFs) and the image-derived IFs (IDIFs). This latter was cross-calibrated with the first 4 discrete blood samples, corresponding to the first 20 min of the scan. The IFs were generated using dedicated software developed in-house within Matlab 6.5.
Kinetic Analysis
To fit the computed time–activity curves, we have used a reversible 1-tissue compartment with 2 kinetic rate constants and a fractional blood volume term proposed by Kropholler et al. (22). This model describes the uptake of radiotracer from plasma into tissue (K1), and washout from tissue (k2). Parameters of interest evaluated were the VT defined as
To discard noisy data, we included only the results with a coefficient of variation (mean\SD) below 50% . Only 2 of 116 fits were affected.
The delay between the arrival of the 11C-(R)-PK11195 bolus at the organ of interest and the IF was estimated for each individual ROI. The tracer arrival delay was determined by varying the discrete delay parameter over a predefined set of values and performing the model fit. The delay value that corresponded to the smallest weighted residual sum of squared errors was chosen (28).
SUVs were calculated as the average tissue activity concentration in each ROI (in Bq/mL) divided by total injected activity per body weight (in Bq/g).
Data are reported as mean values ± SD, and comparisons were made by means of the unpaired 2-tailed Student t test. Correlation between SUV and VT was tested by means of Pearson correlation. Statistical analyses were performed using the Statistical Package for Social Science, version 16.0.1 (SPSS Inc.). A P value of less than 0.05 was considered statistically significant.
RESULTS
IFs
A representative comparison between the total-blood IDIF and the total-blood BSIF from 1 subject (Fig. 1) shows that the peak value of the BSIF is only about 30% of the peak value of the IDIF. However, because the IDIF is derived from framed images, its peak value may still be underestimated. The BSIF has a lower kurtosis and is skewed to the right.

Representative example of whole-blood BSIF and IDIF derived from 1 asymptomatic patient. Dispersion of whole-blood BSIF, in comparison with IDIF, can clearly be seen.
The area under the curve formed by the IDIF and the BSIF (corrected for radioactive decay) was computed for the 7 patients (Supplemental Table 1 and Data Supplement I). The mean difference between the 2 areas under the curve over the whole study population was 30%, 13%, and 9.8% at 5, 30, and 60 min after the injection, respectively. This observation indicates that the BSIF is likely to be the dispersed representation of the arterial IF. These pronounced differences between arterial and venous blood were expected for a high-extraction tracer such as 11C-(R)-PK11195 (29).
Parameter Estimates of Reversible 1-Tissue-Compartment Model for Symptomatic Patients
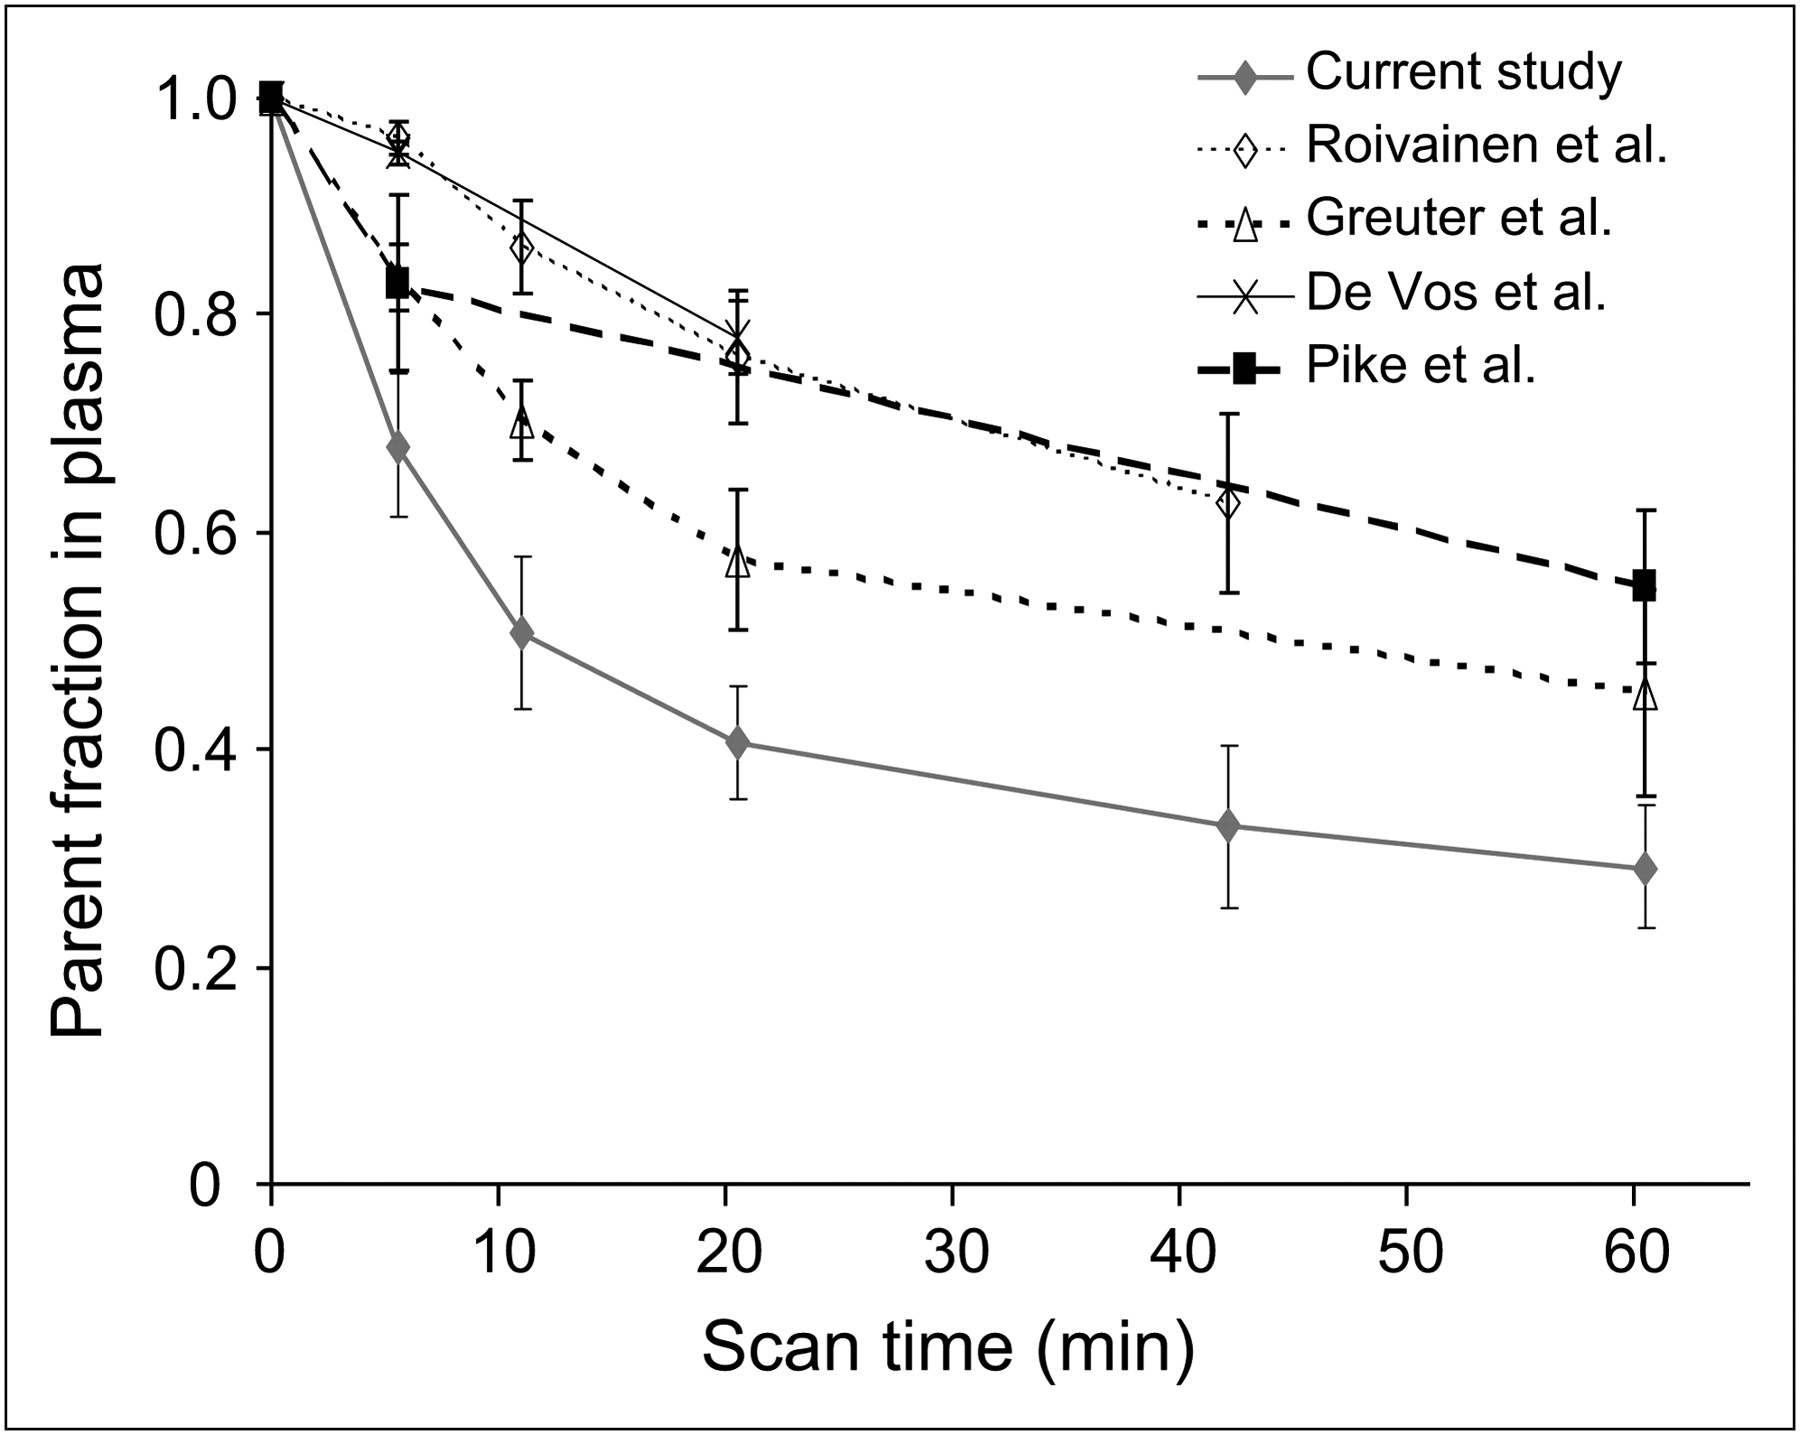
The POB ratio changed little over the duration of the PET scan and did not show any significant difference among subjects (further details are presented in Data Supplement II and Fig. 2) The population mean parent fraction in plasma decreased from 68.0% ± 6.6% at 5 min to 29.1% ± 5.7% at 60 min after injection (Fig. 2). No significant difference was detected in the computed parent fractions in plasma at 5 and 60 min after injection between the 2 groups of patients (P > 0.59). The fits to the fraction of radioactivity originating from 11C-(R)-PK11195 in plasma and metabolites were fitted using Equation 2.

Manual blood sample analysis: POB ratio obtained from the 7 subjects (mean values with their SD are given for each of the 10 discrete arterial blood samples) (A); fraction of unmetabolized parent compound in arterial plasma (filled dots represent mean values and SD from the 7 PET studies) (B). Data previously reported in literature (32–35) are presented for comparison.
Tracer Kinetic Modeling
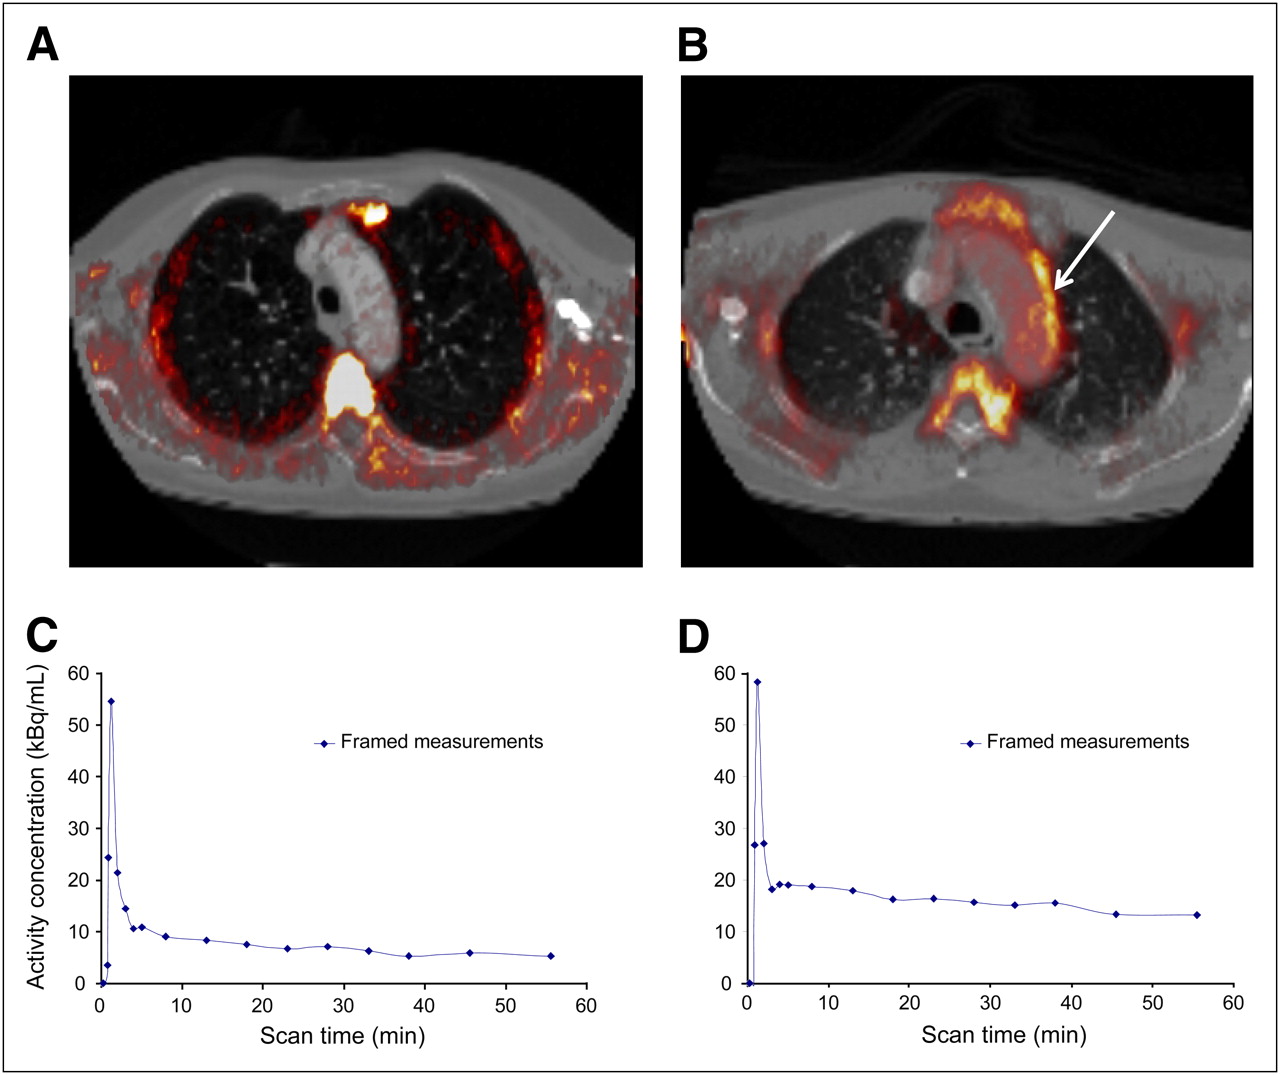
Representative examples of 11C-(R)-PK11195 uptake in an asymptomatic (A) and a symptomatic patient (B) at the level of the aortic arch are shown in Figure 3. The comparison of the time–activity curves of the aortic vessel wall shows that, after the peak, the activity concentration in a symptomatic patient (D) is 2-fold that in an asymptomatic patient (C).

Example of asymptomatic (A) and symptomatic (B) patient. Gray-scale image is CT angiography coregistered with PET ordered-subset expectation maximization image. Each patient is shown in transverse view. Arrow indicates inflamed region of aortic arch. (C and D) Respective time–activity curves (corrected for radioactive decay) derived from aortic vessel wall.
For all 5 different tissue regions, the data were fitted using 4 different IFs: either total-plasma BSIF or IDIF or parent-plasma BSIF or IDIF. The tracer arrival delay values are reported in Data Supplement II and Supplemental Table 2 for each region and IF for the entire study population. For 1 region and 1 type of IF (i.e., either BSIF or IDIF) there was no difference in the observed tracer arrival delay between total-plasma and parent-plasma IFs. With BSIF, the largest delay was observed in the lung region. In the aortic wall, the tracer arrival delay is smaller than for the lungs but similar to or greater than that in the bone marrow. When IDIFs are used, the tracer arrival delay for the aortic walls is close to zero because of the proximity of the tissue ROI and the ROI of the IDIF sampling. In the bone marrow, the tracer arrival delay may be negative because the activity in the IDIF rises before the activity in the bone ROI.
Tables 1 and 2 detail all the kinetic parameters estimated for the 2 cohorts of patients. The use of the BSIFs (total plasma or parent plasma) led to negative K1 estimates and fractional blood volumes larger than 1 for the 3 aortic ROIs or the ROI drawn in the lung parenchyma. Consequently, the VT estimates are negative for these regions. Using the IDIFs to fit the data from the aortic wall ROIs resulted in plausible estimates for K1, blood volume, and VT. Furthermore, in the last column of Tables 1 and 2, there is a significant reduction in the residual sum of squared errors in the aortic wall ROIs indicating a better fit of the data with IDIF than with BSIF. The time–activity curves fitted with the 1-tissue-compartment model were similar using either total-plasma or parent-plasma IDIF (further details are provided in Data Supplement II and Supplemental Fig. 3). VT estimated from parent plasma tended to be higher in all the tissues (Eq. 3). In the aortic wall (Fig. 4), VT was significantly higher in symptomatic patients with both total-plasma IDIF (0.55 ± 0.15 vs. 0.27 ± 0.12, P = 0.009) and parent-plasma IDIF (1.40 ± 0.50 vs. 0.58 ± 0.25, P = 0.018) The box plot showed no overlap in discriminating the 2 groups of patients.
Parameter Estimates of Reversible 1-Tissue-Compartment Model for Asymptomatic Patients

VT for aortic wall. Mean values with their SD for the 4 asymptomatic and 3 symptomatic patients are given. Continuous line = VT parent-plasma IDIF. Hatched line = VT total-plasma IDIF. *P = 0.009 vs. total plasma asymptomatic patients. †P = 0.018 vs. parent plasma asymptomatic patients.
SUV fell short of significance (P = 0.07) in discriminating symptomatic (1.21 ± 0.29) from asymptomatic (0.87 ± 0.1) patients. Nonetheless, as shown in Figure 5, SUV strongly correlated with total-plasma VT (R = 0.79; P = 0.036) but not with parent-plasma VT (R = 0.53; P = 0.22).
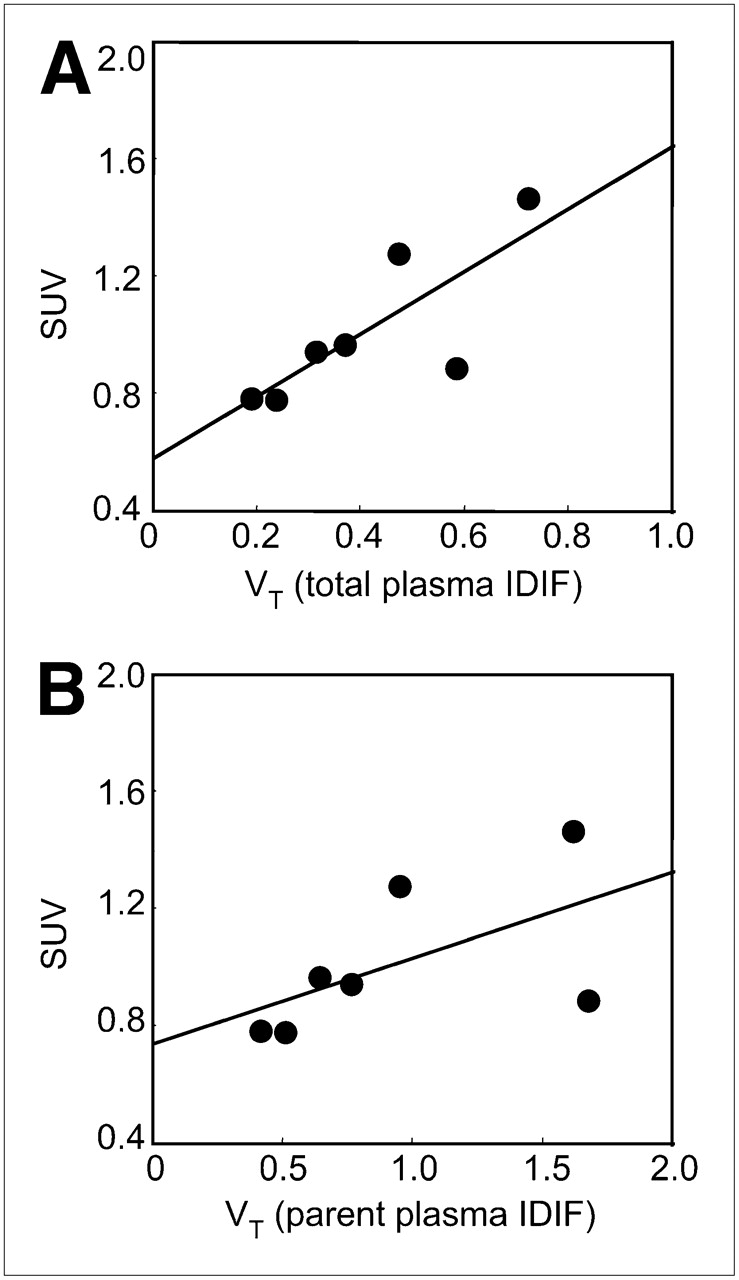
(A) Scatterplot between VT total-plasma IDIF and SUV. y = 0.5793 + 1.068x; R = 0.79. (B) Scatterplot between VT parent plasma IDIF and SUV. y = 0.7574 + 0.2846x; R = 0.52.
Symptomatic and asymptomatic patients did not differ in lung parenchyma either with total-plasma IDIF (0.15 ± 0.03 vs. 0.19 ± 0.04, respectively, P = not statistically significant [NS]) or with parent-plasma IDIF (0.25 ± 0.07 vs. 0.31 ± 0.12, respectively, P = NS). A similar pattern was seen in the bone marrow with total-plasma IDIF (2.50 ± 0.85 vs. 2.51 ± 0.54, respectively, P = NS) and with parent-plasma IDIF (5.26 ± 1.51 vs. 6.02 ± 0.93, respectively, P = NS).
DISCUSSION
Our findings demonstrate that active vasculitides in patients with systemic inflammatory disorders can be visualized (5) and quantified by macrophage targeting using 11C-(R)-PK11195. The lack of significant uptake in asymptomatic patients confirms the sensitivity and selectivity of 11C-(R)-PK11195 in imaging macrophage infiltrates (30,31).
As a probe suitable for brain imaging, 11C-(R)-PK11195 is a highly lipophilic compound thought to cross the blood–brain barrier by passive diffusion. Because of the similar properties of the cell membranes of red blood cells, 11C-(R)-PK11195 would also be expected to enter the red blood cells. However, a POB ratio of 1.38 at 5 min indicates that a large proportion of 11C-(R)-PK11195 activity is concentrated in the plasma rather than in the red cells. The subsequent appearance of radiolabeled metabolites has only a small effect on the POB ratio, suggesting a similar partitioning of 11C-(R)-PK11195 radioactivity and its radiolabeled metabolites between plasma and red blood cells. The POB ratio obtained in venous arterialized blood is approximately 10% smaller than the mean POB ratio of 1.55 reported by Kropholler et al. for measurements obtained in arterial blood (22).
In Figure 2, measurements of the parent fraction in plasma from previous studies with 11C-(R)-PK11195 in humans (32–35) are shown in comparison with our results. Our data can be equally described by a single exponential; however, the absolute values measured in arterialized venous plasma are only about 60% of the average parent fractions in arterial plasma previously published.
We have tested the most appropriate compartmental model (data not shown), and our data are in keeping with the findings of Kropholler et al. (22) in the knee joint. The reversible 1-tissue, 2-rate-constant compartmental model with a free blood volume term has proven satisfactory to describe the kinetics in the vessel wall; conversely, other models with more parameters do not provide fits that are significantly superior.
The use of the BSIFs, either total plasma or parent plasma, to estimate the kinetic parameters in the 2 cohorts led to negative K1 estimates and fractional blood volumes larger than 1 for the 3 aortic ROIs or the ROI drawn in the lung parenchyma. The result was negative VT estimates for these regions. A partial explanation could be the use of arterialized venous blood, which is a dispersed representation of the true arterial IF such that the peak is flattened but the area under the curve preserved (27). Arterial sampling, although considered the gold standard for deriving arterial IF, is laborious and sensitive to errors, and we therefore elected to avoid arterial cannulation to prevent the potential complications related to this invasive procedure.
On the other hand, when using IDIFs to fit the time–activity curves of the same tissue regions, we obtained plausible estimates for K1, blood volume, and VT. More important, the use of the IDIFs instead of the BSIFs led to a better fit of the data, as was substantiated by the reduction of the sum of squared errors of the fit, thus identifying IDIF as the more appropriate IF for tracer kinetic modeling.
The comparison of the regional VT estimates in the 2 cohorts of patients showed a slightly higher discriminatory power for the total plasma IF. The close similarity of the VT estimates indicates the negligible effect of labeled metabolites in these 2 small cohorts of patients. The same conclusion was reached by Kropholler et al. in their study on the inflammation of knee joints in patients with rheumatoid arthritis using 11C-(R)-PK11195 (22). The advantage of this approach is the simplification of the acquisition protocol, obviating the sampling and measurement of radiolabeled compounds in plasma. In addition to the small variability of the POB ratio, this simplified method using IDIF can be used for the quantitative analysis of dynamic 11C-(R)-PK11195 studies in vasculitides.
The simplified SUV showed a good correlation with VT total-plasma IDIF even though in this small cohort the discriminating power was not significant. Nevertheless, in a larger cohort of patients the semiquantitative evaluation with the target-to-background ratio has proven potentially valuable in clinical practice (5).
Other less selective tracers, such as 18F-FDG, have been used in the clinical setting to discriminate active inflammation and macrophage-rich infiltrates in large-vessel vasculitides (1); however, to improve the sensitivity in the case of smaller lesions, it might be more suitable to quantify glucose transport Ki with partial-volume correction as recently described by Izquierdo-Garcia et al. in inflamed carotid atherosclerotic plaques (36). In a retrospective study in patients with prostate cancer, Kato et al. have proposed 11C-choline as a diagnostic tool potentially quantifiable in aortic atherosclerotic lesions (37).
In the thin aortic arterial wall, partial-volume effects can hamper the recovery of the true radioactivity; partial-volume correction is attained in this model through the use of the free blood volume term, which accounts for spillover from the blood pool into target regions. Partial-volume effect should affect both asymptomatic and symptomatic patients to the same extent and is unlikely to account for the differences observed between the 2 cohorts.
Further studies on larger cohorts implementing reconstruction-based partial-volume correction and respiration-gated acquisitions are warranted to minimize the blurring effect of breathing on small lesions and to explore the suitability of 11C-(R)-PK11195 to monitor the course of vasculitides and disclose clinical remission after therapeutic interventions.
Acknowledgments
Oliver Gaemperli was financially supported by the Swiss National Science Foundation (SNSF). We are thankful to Hammersmith Imanet radiographers Andrew Blyth, Hope McDevitt, and Andreanna Williams and to Safiye Osman for their excellent technical support.
- © 2011 by Society of Nuclear Medicine
REFERENCES
- Received for publication May 11, 2010.
- Accepted for publication October 18, 2010.


Jump to section
Related Articles
Cited By...
- Total-Body PET/CT Applications in Cardiovascular Diseases: A Perspective Document of the SNMMI Cardiovascular Council
- Radiotracers to Address Unmet Clinical Needs in Cardiovascular Imaging, Part 2: Inflammation, Fibrosis, Thrombosis, Calcification, and Amyloidosis Imaging
- Molecular Imaging of Vulnerable Coronary Plaque: A Pathophysiologic Perspective