


Abstract
No validated predictive biomarkers for antiangiogenic treatment of metastatic renal cell carcinoma (mRCC) exist. Tumor vascular endothelial growth factor A (VEGF-A) level may be useful. We determined tumor uptake of 89Zr-bevacizumab, a VEGF-A–binding PET tracer, in mRCC patients before and during antiangiogenic treatment in a pilot study. Methods: Patients underwent 89Zr-bevacizumab PET scans at baseline and 2 and 6 wk after initiating either bevacizumab (10 mg/kg every 2 wk) with interferon-α (3–9 million IU 3 times/wk) (n = 11) or sunitinib (50 mg daily, 4 of every 6 wk) (n = 11). Standardized uptake values were compared with plasma VEGF-A and time to disease progression. Results: 89Zr-bevacizumab PET scans visualized 125 evaluable tumor lesions in 22 patients, with a median SUVmax (maximum standardized uptake value) of 6.9 (range, 2.3–46.9). Bevacizumab/interferon-α induced a mean change in tumor SUVmax of −47.0% (range, −84.7 to +20.0%; P < 0.0001) at 2 wk and an additional −9.7% (range, −44.8 to +38.9%; P = 0.015) at 6 wk. In the sunitinib group, the mean change in tumor SUVmax was −14.3% at 2 wk (range, −80.4 to +269.9; P = 0.006), but at 6 wk the mean change in tumor SUVmax was +72.6% (range, −46.4 to +236%; P < 0.0001) above baseline. SUVmax was not related to plasma VEGF-A at all scan moments. A baseline mean tumor SUVmax greater than 10.0 in the 3 most intense lesions corresponded with longer time to disease progression (89.7 vs. 23.0 wk; hazard ratio, 0.22; 95% confidence interval, 0.05–1.00). Conclusion: Tumor uptake of 89Zr-bevacizumab is high in mRCC, with remarkable interpatient and intrapatient heterogeneity. Bevacizumab/interferon-α strongly decreases tumor uptake whereas sunitinib results in a modest reduction with an overshoot after 2 drug-free weeks. High baseline tumor SUVmax was associated with longer time to progression.
Angiogenesis inhibitors have single-agent activity and double median progression-free survival in patients with metastatic renal cell carcinoma (mRCC) (1–3). However, not all patients respond, and angiogenesis inhibitors are expensive and can have side effects. Furthermore, studies indicated potential tumor-promoting effects of tyrosine kinase inhibitors (4,5). Therefore, it is crucial to develop a predictive biomarker for selecting patients who will benefit from these treatments. Circulating vascular endothelial growth factor A (VEGF-A) levels do not predict benefit from antiangiogenic treatment (6–10). VEGF-A, however, comprises different splice variants; small isoforms can diffuse freely whereas larger isoforms are primarily matrix-bound and have biologic activity in the tumor microenvironment (11). Local VEGF-A concentration potentially reflects whether angiogenesis drives tumor progression and might predict sensitivity to antiangiogenic treatment. Therefore, we developed the PET tracer 89Zr-bevacizumab, which enables noninvasive whole-body VEGF-A imaging and quantification (12–14). Sunitinib and bevacizumab plus interferon-α (IFNα) are standard treatments for mRCC (1,2). Bevacizumab, a monoclonal antibody with a half-life of ±20 d, binds VEGF-A, thus preventing the growth factor to activate its receptor. Sunitinib is a small molecule with a half-life of ±2 d that blocks VEGF receptors and other tyrosine kinases intracellularly.
We conducted a pilot study in mRCC patients. Renal cell carcinoma (RCC) is characterized by Von Hippel–Lindau gene inactivation, resulting in high VEGF-A production and characteristic vascular tumors. The primary aim was to quantify 89Zr-bevacizumab uptake in tumor lesions before treatment and changes in uptake during the early course of antiangiogenic therapy in mRCC patients. Furthermore, we wanted to explore whether 89Zr-bevacizumab PET can early identify primary resistant disease (defined as progressive disease at first evaluation), whether tumor 89Zr-bevacizumab uptake correlates with plasma VEGF-A, and the effect of 2 drug-free weeks after 4 wk of sunitinib on tumor 89Zr-bevacizumab uptake.
MATERIALS AND METHODS
Patients
Adult mRCC patients with measurable disease were eligible. Exclusion criteria included uncontrolled hypertension, known untreated brain metastases, clinically significant cardiovascular disease, surgery, and tyrosine kinase inhibitor treatment up to 4 wk or bevacizumab up to 4 mo before trial entry. The study was approved by the institutional review board, and all subjects signed a written informed consent form. The trial is registered with ClinicalTrials.gov (NCT00831857).
Study Design and Treatment
The primary endpoint was change of tumor standardized uptake values (SUVs) at 2 and 6 wk after the start of treatment. Patients were randomized to bevacizumab (10 mg/kg intravenously every 14 d) with IFNα (3 million IU 3 times/wk), which was increased after 2 wk to 6 and then to 9 million IU when tolerated, or sunitinib (50 mg daily orally during 4 of every 6 wk). Treatment was continued until disease progression or unacceptable toxicity. After inclusion of 3 patients, the study was amended to a nonrandomized design because of slow accrual. Because no formal comparison of treatment groups was planned, randomization was not essential for conduct of the study. The secondary endpoint was progressive disease at 3 mo according to the Response Evaluation Criteria in Solid Tumors, version 1.1 (RECIST1.1).
Imaging Techniques
Patients underwent 89Zr-bevacizumab PET imaging at baseline and 2 and 6 wk after the start of treatment. PET scanning was performed 4 d after intravenous administration of 37 MBq of 89Zr-bevazicumab (5 mg protein dose). Two weeks was the minimum interval required to avoid interference of activity of the first 89Zr-bevacizumab injection. Six weeks was chosen to explore a rebound phenomenon after 2 sunitinib-free weeks and to explore whether a scan after 3 therapeutic bevacizumab doses shows a further change. Conjugation and labeling were done as described earlier (13). Patients were scanned from the upper thigh to the head in up to 8 consecutive bed positions, with a final reconstruction resolution of approximately 11 mm. Patients underwent routine CT imaging at baseline and every 3 mo thereafter. CT was performed with intravenous contrast with a maximal slice thickness of 5.0 mm (supplemental methods [available at http://jnm.snmjournals.org]). In the case of symptoms, bone scintigraphy and MR imaging were performed.
Imaging Data Analysis
Baseline PET scans were qualitatively assessed by a nuclear medicine physician and fused with the baseline CT scans to verify location and anatomic substrate of hot spots. All regions with high focal tracer uptake relative to normal-organ background were considered as lesions. Lesions were defined evaluable when identified as tumor lesion on routine imaging, greater than 10 voxels, delineable from normal-organ background, and not irradiated. Quantification was performed with AMIDE Medical Image Data Examiner software (version 0.9.1; Stanford University) (15). Maximum and mean SUV (SUVmax and SUVmean, respectively) were calculated for evaluable lesions and normal organs. All lesions on the baseline CT were measured for comparison with PET. Treatment response was assessed according to RECIST1.1 by a radiologist who was masked to patient characteristics and PET results.
Biomarker Analysis
Plasma VEGF-A was measured in samples drawn at days −3, 11, and 39 before tracer administration and stored at −80°C until analysis. Samples were analyzed with the immunologic multiparametric chip technique (7).
Statistical Assessments
We assumed that the difference in SUV between the baseline scan and the scan after 2 and 6 wk was 1.25 SDs or greater and that there was no correlation between the first and second scans and estimated that 11 patients were required in each treatment group to predict with 80% power (2-sided α = 0.05) that there is a true difference. To compensate for an anticipated 15% early discontinuation, 26 patients were included. For comparison of paired and nonpaired data, Wilcoxon paired-rank and the Mann–Whitney tests were used. The association between SUVmean and SUVmax was analyzed with Spearman rank correlation and between imaging results and time to disease progression (TTP) with the Kaplan–Meier method. Analyses were performed with SPSS (version 20; IBM).
RESULTS
Patients
Between February 2009 and July 2011, 26 patients were included. Two patients did not meet eligibility criteria because of recent bevacizumab treatment and were excluded from the analysis. One patient was not evaluable, and 1 patient withdrew consent. Therefore, 22 patients, 11 per treatment group, who underwent at least the baseline and 2-wk scans, were evaluable (Supplemental Fig. 1). One patient reported nausea, redness of the face, and cold extremities for 24 h after the third tracer injection but continued bevacizumab treatment without adverse events. Patient characteristics are shown in Table 1.
Patient Demographics and Clinical Characteristics
Baseline 89Zr-Bevacizumab PET
Normal-Organ 89Zr-Bevacizumab Uptake
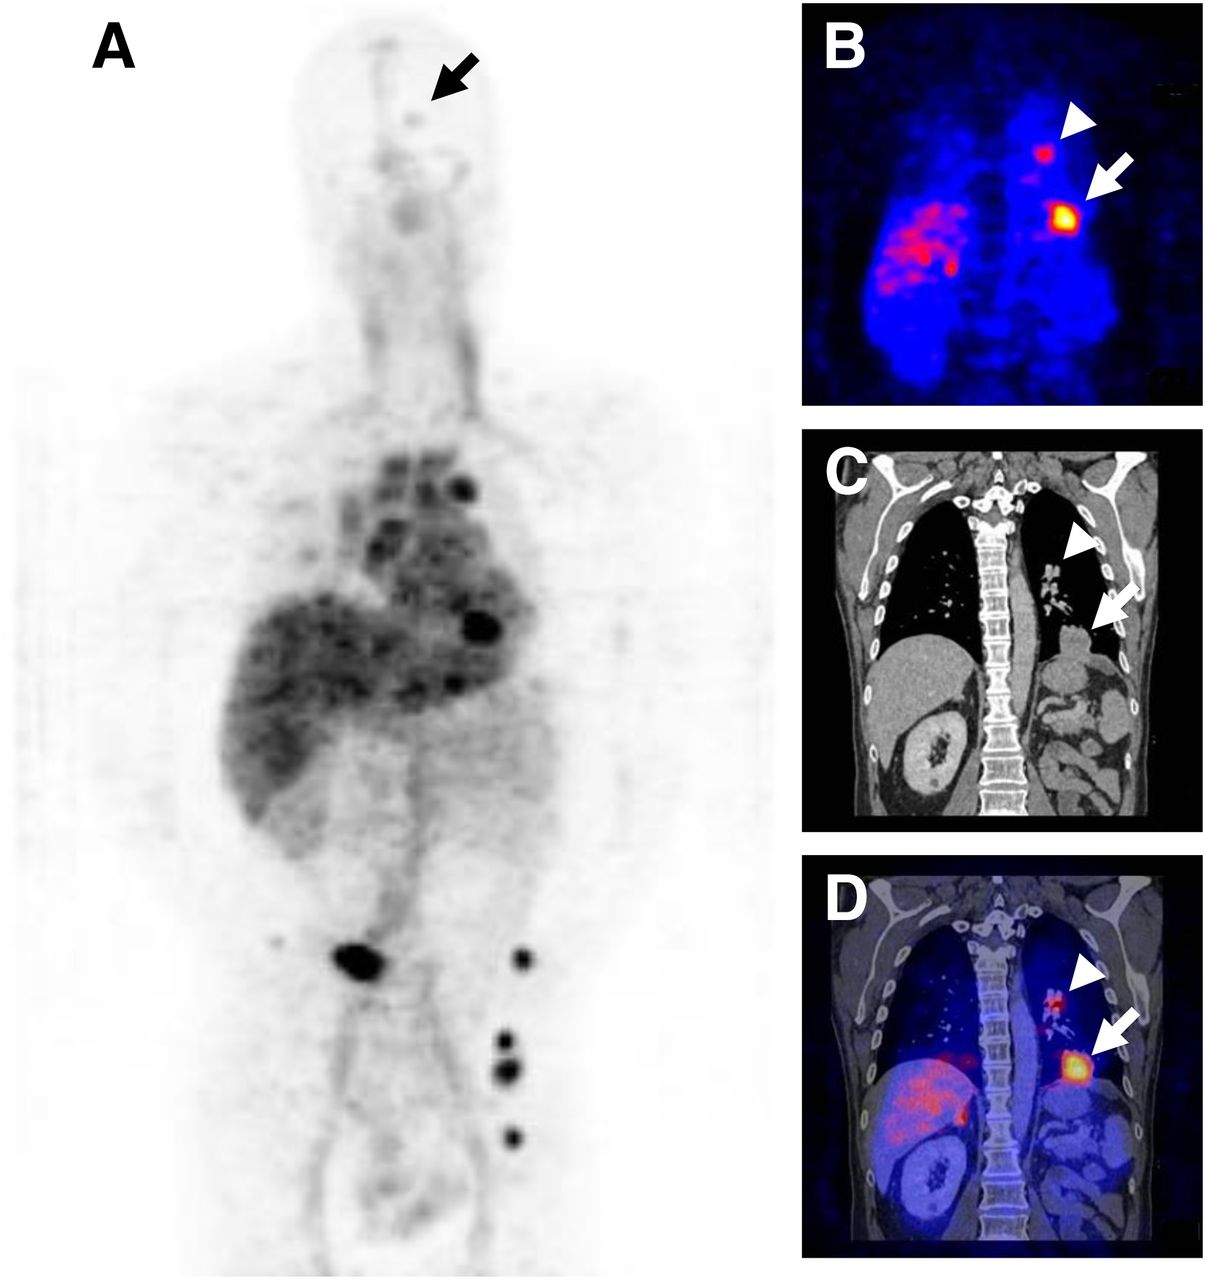
An example of a baseline scan is shown in Figure 1. SUVmean and SUVmax of normal organs were strongly correlated (r2 = 0.99, P < 0.0001, Supplemental Fig. 2A). SUVmax is less operator-dependent, so we used SUVmax. Normal-organ uptake (Fig. 2A) was consistent with a previous study (14) and with distribution of other antibody tracers (16,17).

(A) Baseline 89Zr-bevacizumab PET scan of mRCC patient showing tracer in blood pool and liver and metastases in bone, lung, lymph nodes, and brain (arrow). Coronal 89Zr-bevacizumab PET (B), CT (C), and fusion image (D) of chest showing lung (large arrow) and lymph node (small arrow) metastases.

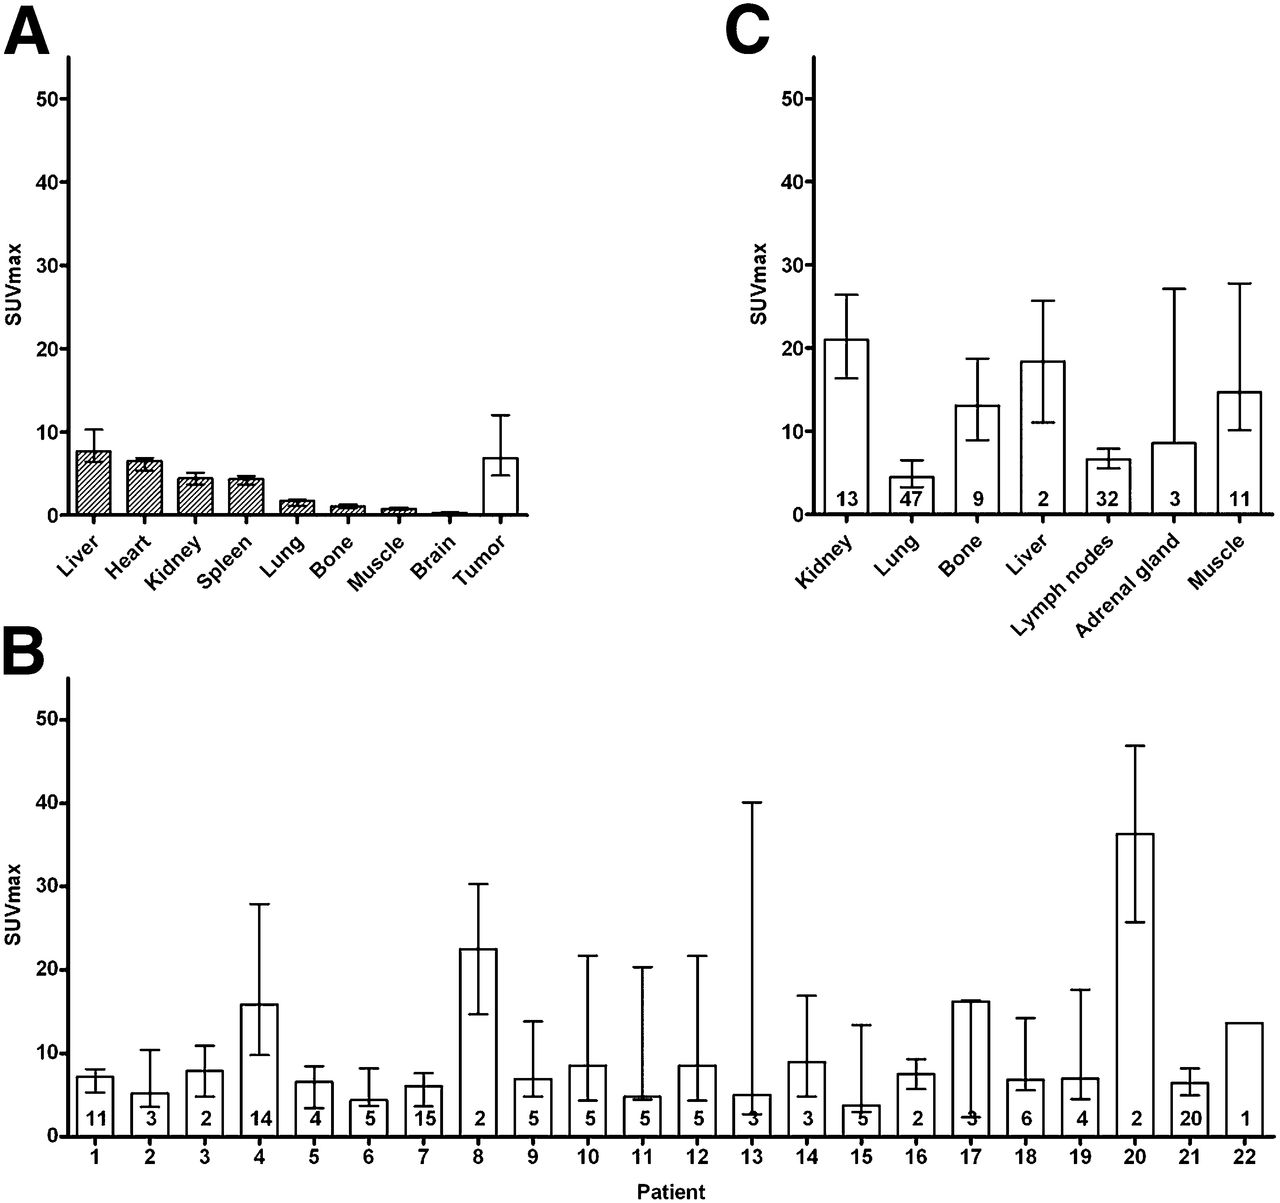
(A) Median uptake at baseline in normal organs and all evaluable tumor lesions (n = 125) on 89Zr-bevacizumab PET scan, with interquartile range. Uptake in tumor lesions per patient (B) and according to organ localization (C). In bar, number of lesions is indicated.
Tumor 89Zr-Bevacizumab Uptake
89Zr-bevacizumab PET visualized lesions in all patients. In total, 213 lesions were identified, of which 194 were in the field of view of the routine CT scan; 159 were also identified as tumor lesions on CT. The 35 lesions that were not detected on CT were located in the bone (n = 12), lymph nodes (n = 6), muscles (n = 7), kidneys (n = 4), and intraperitoneal (n = 4) and retroperitoneal compartments (n = 2). The 19 lesions outside the field of view of the CT scan were localized in the brain (n = 5 in 3 patients), bone (n = 4), lymph nodes (n = 2), and muscles (n = 8) (Table 2). Two patients with known brain metastases had radiotherapy before entry in the study. In the third patient, no MR imaging was performed. Sunitinib was started immediately because of rapidly progressive systemic disease without neurologic symptoms. On the CT scan, 562 lesions were identified, 145 in the bevacizumab/IFNα group and 417 in the sunitinib group, of which 231 were 10 mm or greater. The smallest lesion detected by 89Zr-bevacizumab PET was 5.0 mm. The detection percentage increased with lesion size on CT (Supplemental Fig. 3); 56.7% of lesions 10 mm or greater were visible with 89Zr-bevacizumab PET. The 125 tumor lesions evaluable for quantification showed a strong correlation between SUVmean and SUVmax (r2 = 0.99, P < 0.0001, Supplemental Fig. 2B). Therefore, only SUVmax is reported. Median tumor SUVmax was 6.9 (range, 2.3–46.9), varying from 3.8 (range, 2.7–15.4) for the patient with the lowest tumor uptake to 36.3 (range, 25.7–46.9) for the patient with the highest uptake (Fig. 2B). Furthermore, tumor tracer uptake differed according to organ localization (Fig. 2C).
Lesions Visualized with 89Zr-Bevacizumab PET and CT
Serial 89Zr-Bevacizumab PET Before and During Bevacizumab/IFNα
At baseline, median SUVmax in 34 tumor lesions in the bevacizumab/IFNα-treated patients was 8.1 (range, 2.3–46.9). At 2 wk, a mean change of −47.0% in tumor SUVmax (range, −84.7 to +20.0%; P < 0.0001) was found, resulting in a median SUVmax of 4.7 (range, 1.4–10.1; Fig. 3A). This pattern was found in all patients (Supplemental Fig. 4A). Tumor SUVmax consistently decreased to 10 or less, even in lesions with high baseline uptake (Fig. 3B). A third 89Zr-bevacizumab PET scan, available in 9 patients, showed a further mean change of −9.7% (range, −44.8 to +38.9%; P = 0.015) in tracer uptake in the 23 tumor lesions (Fig. 3A). Figure 4A shows an example of serial scans. Small changes over time in normal-organ 89Zr-bevacizumab uptake were detected (Supplemental Fig. 5A).

89Zr-bevacizumab tumor uptake before and during antiangiogenic treatment: 11 patients were treated with bevacizumab/IFNα (A and B) and 11 patients with sunitinib (C and D). Bars = median SUVmax with interquartile range; lines = individual tumor lesions. *P < 0.05.
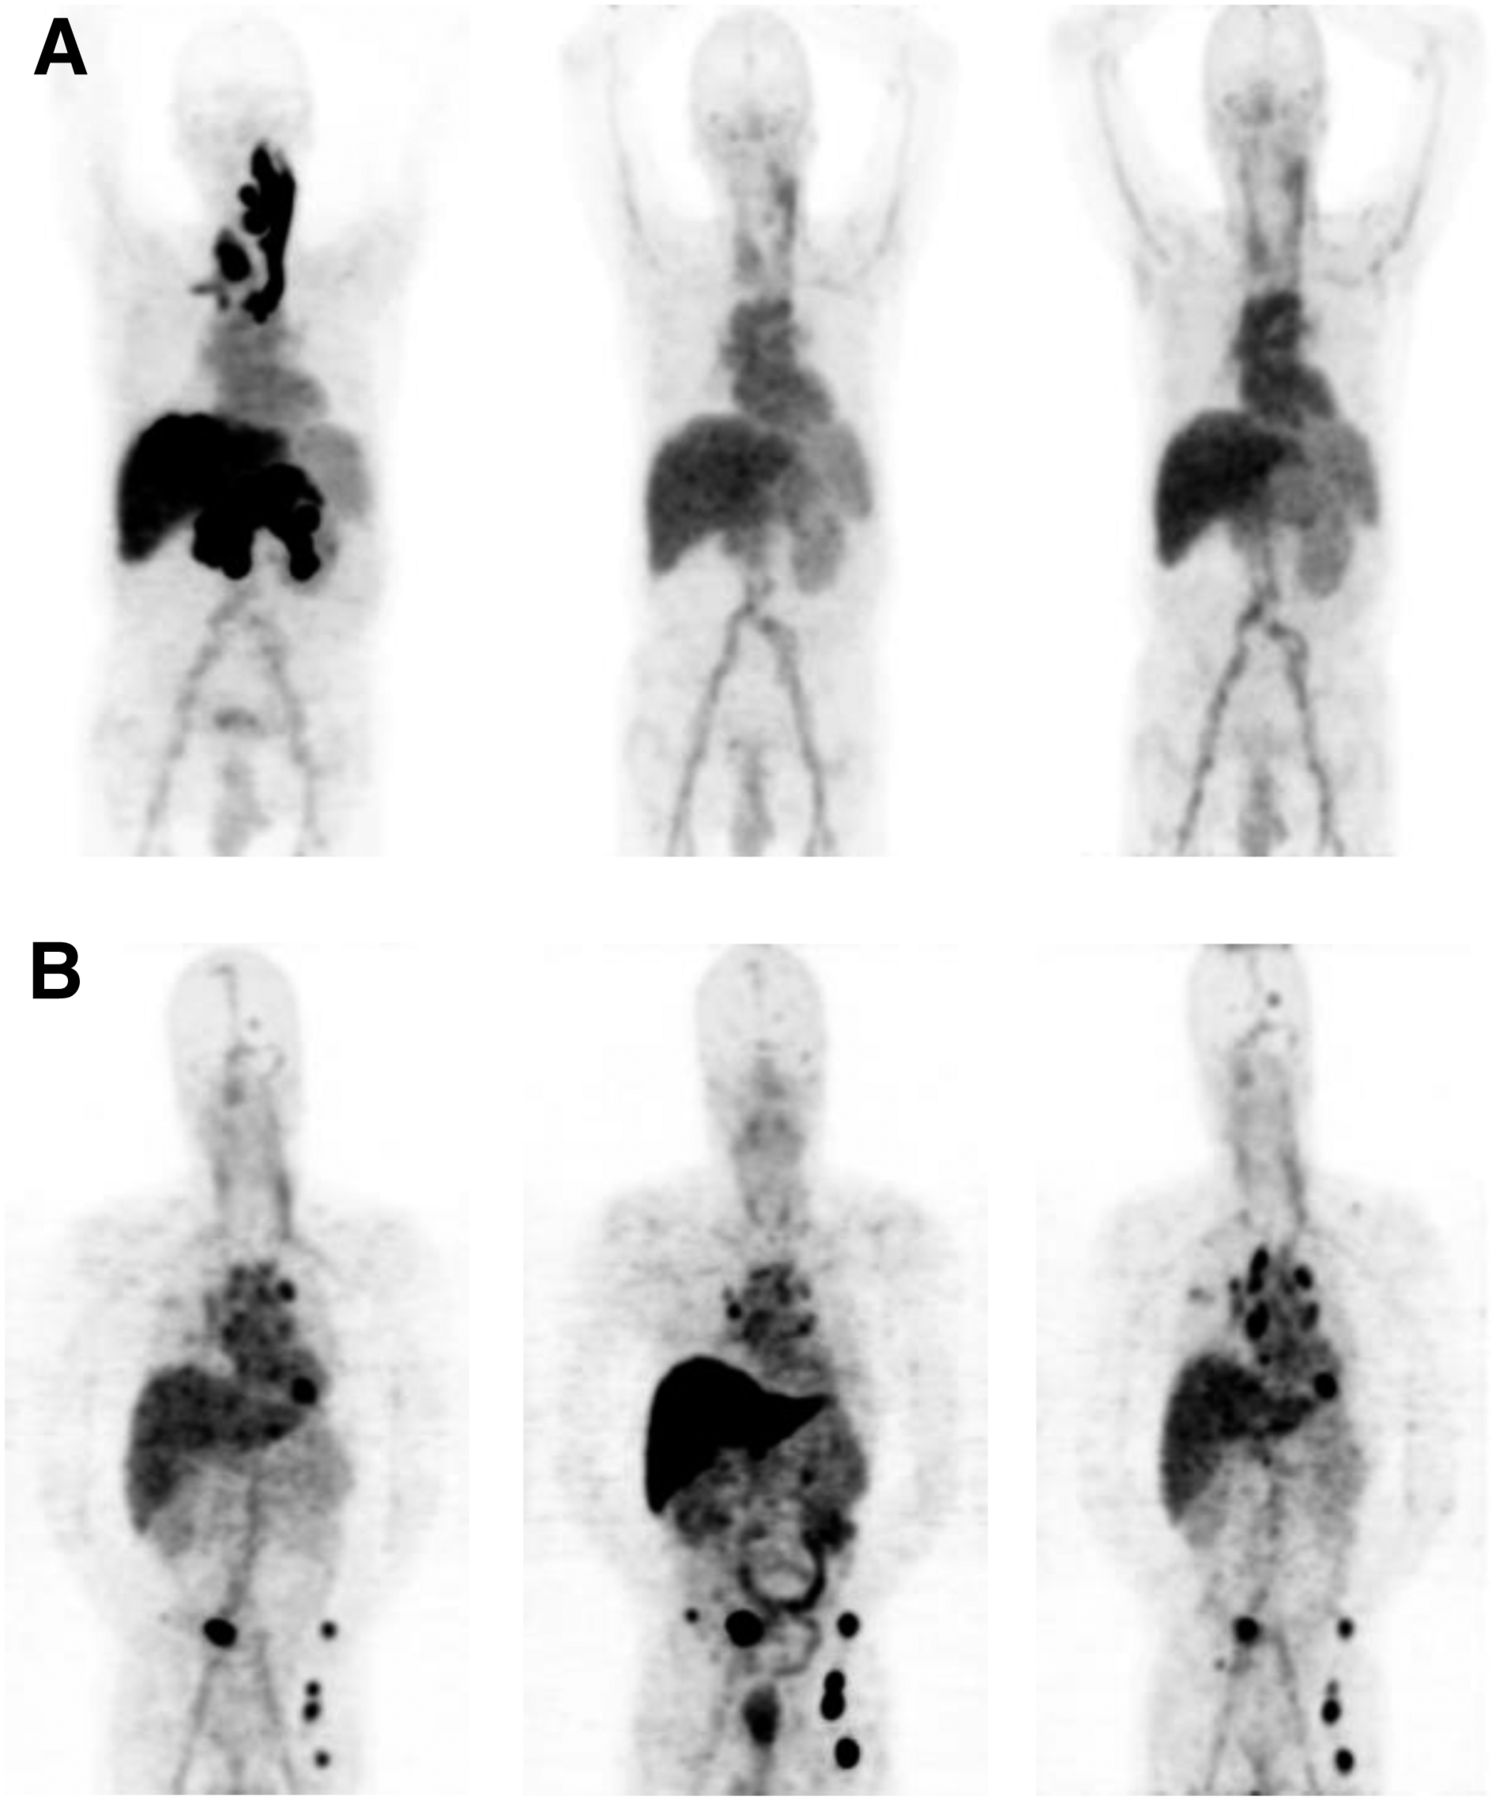
(A) Serial 89Zr-bevacizumab PET scans of patient with RCC metastases in pancreas, liver, and thyroid, with associated jugular and portal vein thrombosis at baseline (left) and 2 (middle) and 6 wk (right) after start of bevacizumab/IFNα. Tumor uptake decreased whereas normal-organ uptake was stable over time. (B) Serial 89Zr-bevacizumab PET scans of patient with RCC metastases in lungs, mediastinal lymph nodes, bone, and brain at baseline (left) and 2 (middle) and 6 wk (right) after start of sunitinib—that is, after 2 sunitinib-free weeks. Tumor 89Zr-bevacizumab uptake decreased during treatment in lung and brain metastases but increased in normal liver and bone metastases, with reverse pattern after 2 drug-free weeks.
Serial 89Zr-Bevacizumab PET Before and During Sunitinib
Median SUVmax in 91 tumor lesions in patients receiving sunitinib was 6.7 at baseline (range, 2.4–34.2). After 2 wk of treatment, a mean change in tumor SUVmax of −14.3% was found (range, −80.4 to +269.9; P = 0.006), with a median SUVmax of 4.3 (range, 0.7–83.8) at 2 wk (Figs. 3C and 3D). At the patient level, patterns were divergent (Supplemental Fig. 4B). Mean change in tumor SUVmax differed according to organ site. In kidney tumors (n = 7), a mean increase of 66.2% (range, −19.4 to +201.8%) was found, whereas in lung (n = 36) and lymph node metastases (n = 24) SUVmax decreased −52.3% (range, −80.4 to +8.2%; P < 0.0001) and −26.0% (range, −65.2 to +26.2%; P = 0.002), respectively. A third 89Zr-bevacizumab PET scan in 6 patients showed 42 evaluable lesions. A mean increase of 89.3% (range, −37.2 to +411%; P = 0.0001) in tumor SUVmax was found after 2 sunitinib-free weeks, corresponding to a mean increase of 72.6% above baseline (range, −46.4 to +236.0%; P < 0.0001, Fig. 3C). Figure 4B shows an example of serial scans. Normal liver, kidney, and spleen uptake increased during sunitinib by 51.1%, 32.7%, and 25.0%, respectively, and returned to baseline after 2 drug-free weeks. In other normal organs, mean absolute changes did not exceed 1.0 SUVmax (Supplemental Fig. 5B).
89Zr-Bevacizumab PET and Treatment Outcome
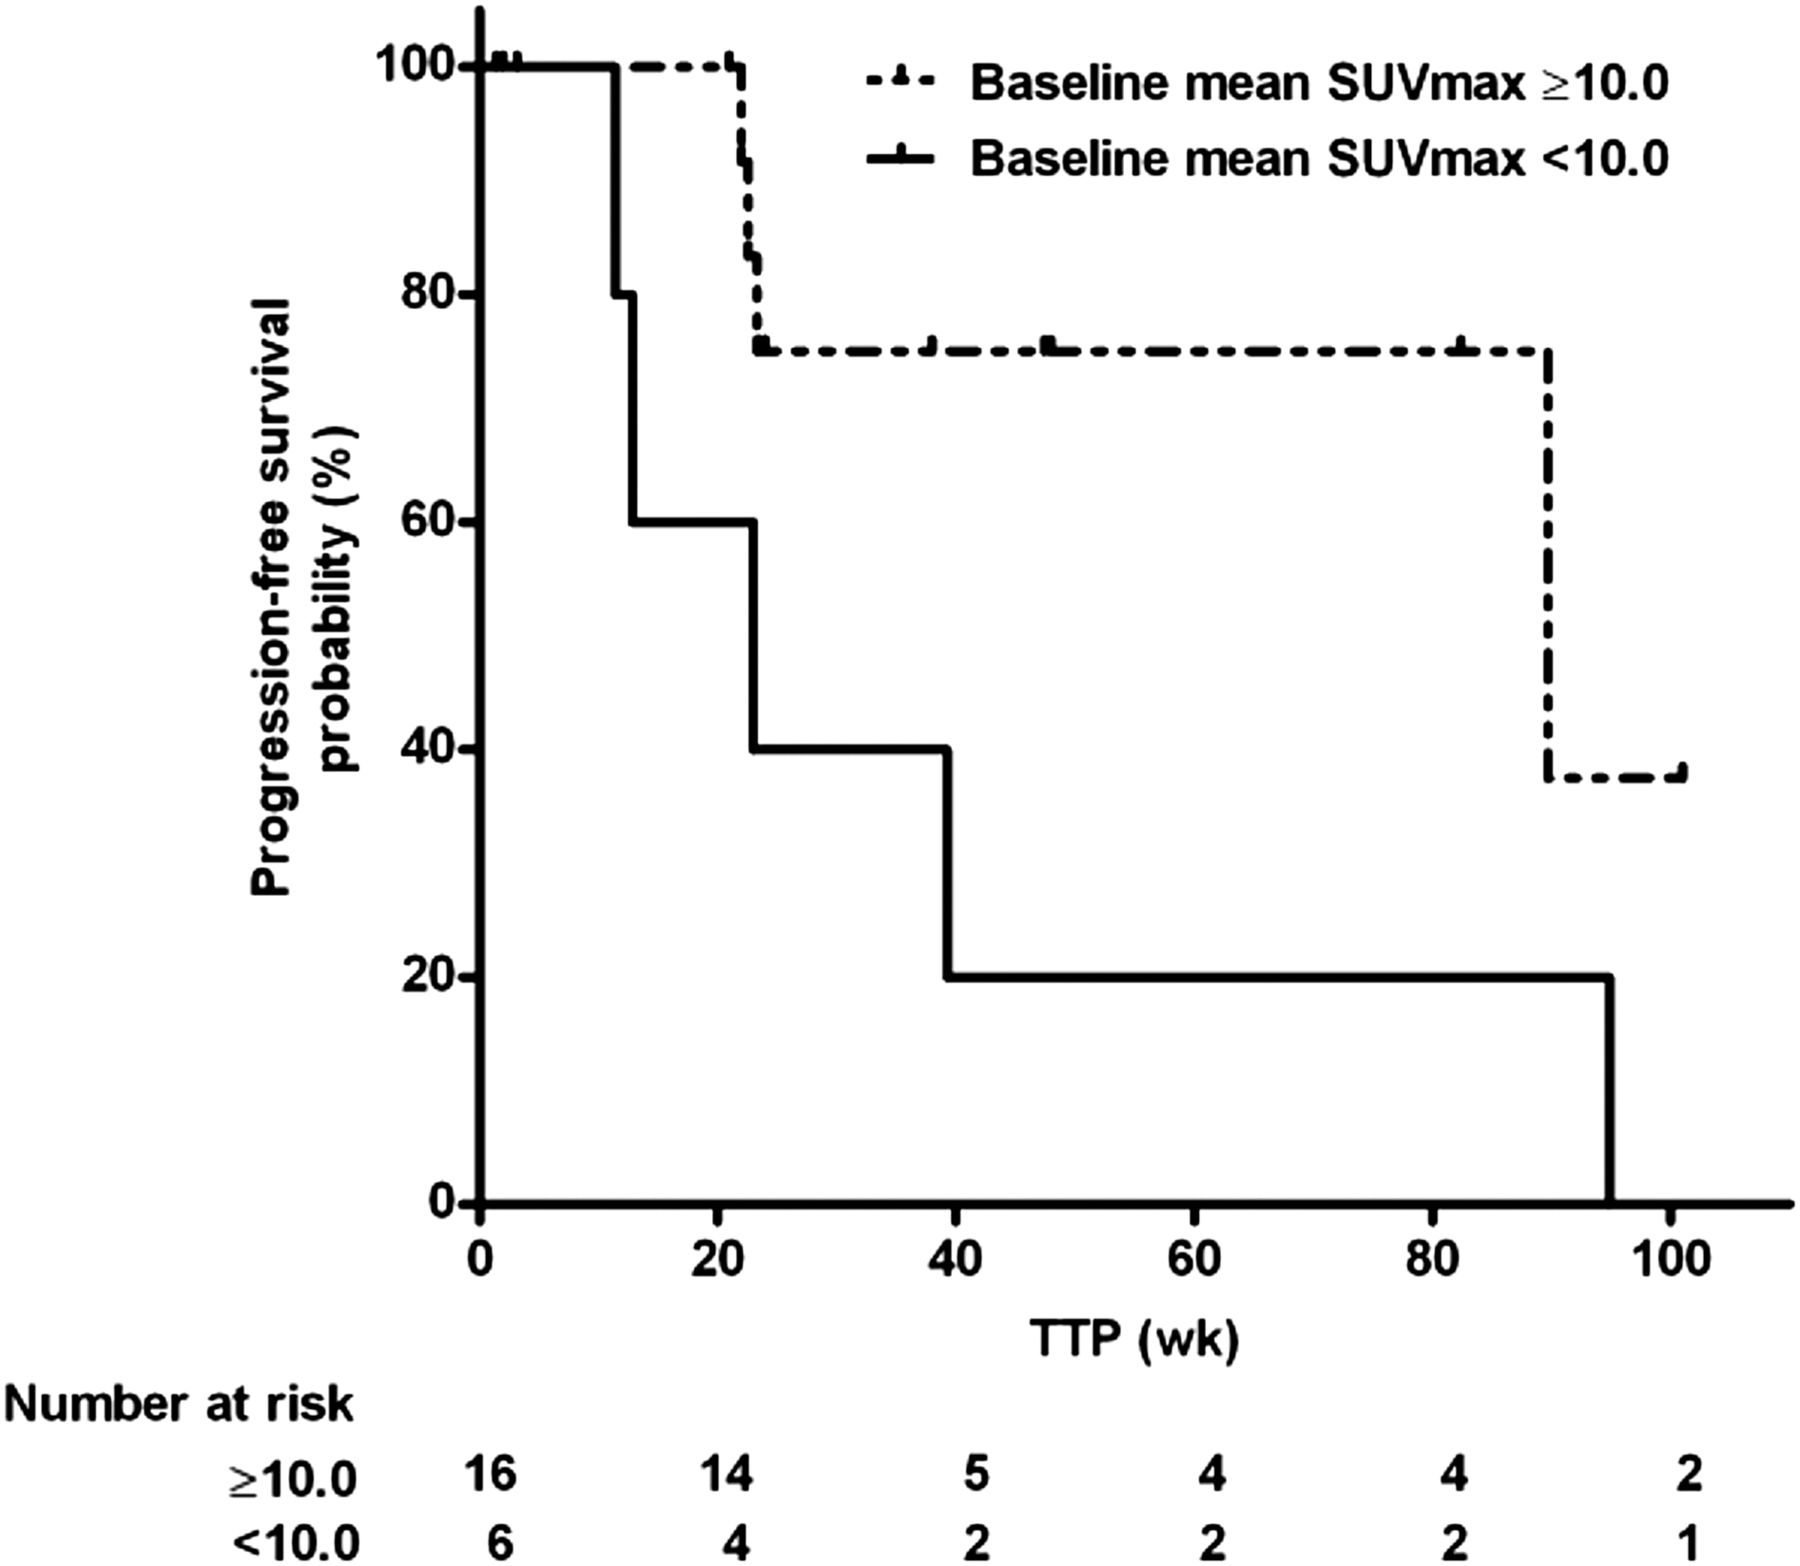
Eighteen patients were evaluable for tumor response at 3 mo (Table 3). One patient with a sarcomatoid tumor component on bevacizumab/IFNα had progressive disease, 1 patient had a partial response, and 16 patients had stable disease. The patient with progressive disease had a mean baseline tumor SUVmax of 6.4, which had decreased by 34% at 2 wk. Post hoc analysis showed that 16 patients (8 of both treatment groups) with a baseline tumor SUVmax greater than 10.0 in the 3 most intense lesions had a longer TTP than 6 patients (3 of both treatment groups) with lower baseline tumor SUVmax, with a median TTP of 89.7 versus 23.0 wk (hazard ratio, 0.22; 95% confidence interval, 0.05–1.00; P = 0.050; Fig. 5). A cutoff of 10 was chosen because mean normal-organ SUVmax was less than 10, and bevacizumab treatment reduced tumor uptake to less than 10. Change in tumor uptake and TTP did not correlate.
Treatment Outcome

Kaplan–Meier analysis of TTP according to baseline 89Zr-bevacizumab tumor uptake of 3 most intense tumor lesions. P = 0.05.
Plasma VEGF-A
Baseline plasma VEGF-A (n = 20; median, 101.2 pg/mL; range, 15.4–445.1 pg/mL) did not correlate with tumor SUVmax and mean tumor SUVmax of all evaluable lesions and of the 3 most intense lesions. Plasma VEGF-A during bevacizumab treatment was unreliable and therefore not analyzed. In the sunitinib group, no relationship was found between plasma VEGF-A and tumor SUVmax and mean tumor SUVmax of all evaluable lesions and of the 3 most intense lesions at 2 and 6 wk. Also, changes in plasma VEGF-A did not correspond with changes in tumor SUVmax parameters.
DISCUSSION
This pilot study in 22 mRCC patients demonstrates that 89Zr-bevacizumab PET visualizes tumor lesions, with major differences in tumor 89Zr-bevacizumab uptake both between and within patients. Antiangiogenic therapy alters tumor 89Zr-bevacizumab uptake; a consistent large decrease occurs after the start of bevacizumab/IFNα and a heterogeneous response during sunitinib.
There was a striking heterogeneity in 89Zr-bevacizumab tumor accumulation at baseline. In a subset of tumors, uptake did not exceed normal-organ background, reflected by visualization of only 56.7% of tumor lesions 10 mm or greater. Moreover, in evaluable lesions, large differences in SUVmax were found, possibly indicating a difference in biology. Tracer accumulation is dependent on delivery by tumor vasculature and on the amount of target. Heterogeneity may therefore reflect differences in vascular characteristics and tumor VEGF-A production. We did not perform biopsies in the current study. However, a correlation between 111In-bevacizumab tumor uptake and VEGF-A expression in melanoma lesions and between 89Zr-bevacizumab tumor uptake and VEGF-A expression in primary breast cancer has been shown previously (13,18).
Interpatient tumor heterogeneity is increasingly recognized and used for personalized treatment. The heterogeneity of 89Zr-bevacizumab tumor uptake between patients may offer a possibility to differentiate patient groups based on tumor biology. Intrapatient tumor heterogeneity has also drawn increasing attention (19,20). Exome sequencing of different parts of primary RCCs and associated metastatic sites demonstrated substantial mutational heterogeneity (19). PET imaging has the potential to noninvasively visualize and quantify effects of mutations on expression of treatment targets across tumor lesions (21). Whole-body insight in heterogeneity of tumor characteristics might guide choices of drug combinations or combinations of different treatment modalities in the future.
Formal comparison of treatment groups was not the aim of this pilot study. Nevertheless, the finding of increased 89Zr-bevacizumab tumor accumulation at 2 wk in a subset of lesions during sunitinib suggests a difference in biologic effect of the 2 antiangiogenic regimens, probably related to the different mechanisms of action. Unlike bevacizumab, sunitinib induces a systemic VEGF release that may be partly tumor-derived (22,23).
Our finding that therapeutic bevacizumab/IFNα reduced 89Zr-bevacizumab tumor delivery may be explained by competition between cold and labeled antibody. However, results of preclinical and clinical studies suggest that bevacizumab-induced vascular changes are responsible (24–26). Two studies in mice bearing human epidermal growth factor receptor-2–expressing tumors demonstrated that VEGF-A antibody treatment reduced tumor accumulation of the human epidermal growth factor receptor-2 antibody trastuzumab and a nonspecific antibody, whereas normal-tissue distribution was not altered (24,25). Decreased tumor accumulation was accompanied by reduced tumor vascular density and blood flow and increased pericyte coverage of tumor vessels. Furthermore, in non–small cell lung cancer patients, tumor delivery of docetaxel diminished after 1 therapeutic bevacizumab dose, which was paralleled by reduced tumor perfusion (26).
The small decrease that we observed in mean tumor 89Zr-bevacizumab uptake after 2 wk of sunitinib and the rebound exceeding baseline after 2 wk off treatment correspond with our preclinical findings (27). Preclinical studies showed increased invasiveness and metastasis after a short sunitinib course (4,5). Moreover, a profound expansion of proliferating endothelial cells was demonstrated in primary RCCs after neoadjuvant sunitinib (28), which was not observed after bevacizumab, despite similar histologic features suggestive of vascular normalization (28). These findings support our observation of different tumor biology after sunitinib and bevacizumab/IFNα. Interestingly, the increased uptake in renal tumors during sunitinib treatment differs from results of 111In-bevacizumab SPECT in 7 RCC patients treated with the tyrosine kinase inhibitor sorafenib for 4 wk (29). Reduced tumor 111In-bevacizumab uptake correlated with areas of necrosis (29). The increase in 89Zr-bevacizumab accumulation in the normal liver, spleen, and kidneys during sunitinib treatment is probably due to sunitinib-induced release of VEGF-A by normal cells. This corresponds with the observation of elevated VEGF protein in the liver, spleen, and kidney tissue of sunitinib-treated mice (5).
Baseline tumor 89Zr-bevacizumab uptake in our study was higher than in patients with early breast cancer and in patients with metastatic neuroendocrine tumors (13,14). This observation probably reflects the unique pathobiology of Von Hippel–Lindau gene inactivation in RCC, resulting in high VEGF-A production by tumor cells.
We had only 1 patient with progressive disease at 3 mo, and therefore no conclusions can be drawn about the ability of 89Zr-bevacizumab PET to identify primary resistant patients. Patients with intense 89Zr-bevacizumab tumor accumulation at baseline had a longer TTP. This exploratory analysis should be interpreted with caution but may indicate that those tumors are more VEGF-driven and -dependent and therefore can be effectively controlled with antiangiogenic treatment.
The absence of a correlation between SUVmax parameters and plasma VEGF-A might be due to a different composition of circulating and microenvironmental VEGF-A isoforms.
CONCLUSION
We demonstrated heterogeneous 89Zr-bevacizumab tumor uptake in mRCC patients. Bevacizumab/IFNα strongly decreases 89Zr-bevacizumab tumor uptake whereas sunitinib results in modest reduction with an overshoot after 2 drug-free weeks. High baseline tumor SUVmax appears to be associated with longer TTP. Further studies are required to determine whether baseline 89Zr-bevacizumab tumor uptake can be used to predict benefit from antiangiogenic treatment. To differentiate between prognostic and predictive value, a randomized study is required.
DISCLOSURE
The costs of publication of this article were defrayed in part by the payment of page charges. Therefore, and solely to indicate this fact, this article is hereby marked “advertisement” in accordance with 18 USC section 1734. This research was supported by a grant from F. Hoffmann-La Roche to the University Medical Center Groningen. Sanne de Haas is an employee of Roche. Stefan J. Scherer is a former employee of Genentech. Jourik A. Gietema and Elisabeth G.E. de Vries had research grants from Roche, which were made available to the UMCG. Elisabeth G.E. de Vries served as an advisory board member of Roche-Genentech. No other potential conflict of interest relevant to this article was reported.
Footnotes
Published online Dec. 4, 2014.
- © 2015 by the Society of Nuclear Medicine and Molecular Imaging, Inc.
REFERENCES
- Received for publication June 30, 2014.
- Accepted for publication November 6, 2014.


Jump to section
Related Articles
Cited By...
- Spatiotemporal Heterogeneity across Metastases and Organ-Specific Response Informs Drug Efficacy and Patient Survival in Colorectal Cancer
- Spatiotemporal Response Heterogeneity Across Metastatic Lesions Informs Drug Efficacy and Patient Survival in Colorectal Cancer
- 89Zr-labeled Bispecific T-cell Engager AMG 211 PET Shows AMG 211 Accumulation in CD3-rich Tissues and Clear, Heterogeneous Tumor Uptake
- PET Imaging of Receptor Tyrosine Kinases in Cancer
- Molecular Imaging in Cancer Drug Development
- 89Zr-Lumretuzumab PET Imaging before and during HER3 Antibody Lumretuzumab Treatment in Patients with Solid Tumors
- Theranostics Using Antibodies and Antibody-Related Therapeutics
- Tumor-Specific Uptake of Fluorescent Bevacizumab-IRDye800CW Microdosing in Patients with Primary Breast Cancer: A Phase I Feasibility Study
- 89Zr-Bevacizumab PET: Potential Early Indicator of Everolimus Efficacy in Patients with Metastatic Renal Cell Carcinoma
- Molecular Drug Imaging: 89Zr-Bevacizumab PET in Children with Diffuse Intrinsic Pontine Glioma
- Radiation-Induced Enhancement of Antitumor T-cell Immunity by VEGF-Targeted 4-1BB Costimulation
- Preclinical Evaluation and First Patient Application of 99mTc-PSMA-I&S for SPECT Imaging and Radioguided Surgery in Prostate Cancer
- 89Zr-Bevacizumab PET Visualizes Disease Manifestations in Patients with von Hippel-Lindau Disease
- Predictive Biomarkers for Molecularly Targeted Therapies in Renal Cell Carcinoma
- ImmunoPET with Anti-Mesothelin Antibody in Patients with Pancreatic and Ovarian Cancer before Anti-Mesothelin Antibody-Drug Conjugate Treatment
- Molecular Fluorescence Endoscopy Targeting Vascular Endothelial Growth Factor A for Improved Colorectal Polyp Detection
- Pretargeted Immuno-PET: Overcoming Limitations of Space and Time
- Molecular Imaging of Post-Src Inhibition Tumor Signatures for Guiding Dasatinib Combination Therapy
- Harnessing the Power of Molecular Imaging for Precision Medicine
- Antibody Positron Emission Tomography Imaging in Anticancer Drug Development