


Abstract
Brain metastases are frequently treated with radiation. It is critical to distinguish recurrent or progressive brain metastases (RPBM) from late or delayed radiation injury (LDRI). The purpose of this study was to examine the diagnostic accuracy as well as the prognostic power of 6-18F-fluoro-l-dopa (18F-FDOPA) PET for differentiating RPBM from LDRI. Methods: Thirty-two patients who had 83 previously irradiated brain metastases and who underwent 18F-FDOPA PET because of an MR imaging–based suggestion of RPBM were studied retrospectively. PET studies were analyzed semiquantitatively (lesion-to-striatum and lesion-to-normal brain tissue ratios based on both maximum and mean standardized uptake values) and visually (4-point scale). The diagnostic accuracy of PET was verified by histopathologic analysis (n = 9) or clinical follow-up (n = 74) on a lesion-by-lesion basis. Receiver operating characteristic curve analysis was used to identify the best diagnostic indices. The power of 18F-FDOPA PET to predict disease progression was evaluated with the Kaplan–Meier and Cox regression methods. Results: The best overall accuracy was achieved by visual scoring, with which a score of 2 or more (lesion uptake greater than or equal to striatum uptake) resulted in a sensitivity of 81.3% and a specificity of 84.3%. Semiquantitative 18F-FDOPA PET uptake indices based on lesion-to-normal brain tissue ratios were significantly higher for RPBM than for LDRI. Among the various predictors tested, 18F-FDOPA PET was the strongest predictor of tumor progression (hazard ratio, 6.26; P < 0.001), and the lesion-to-normal brain tissue ratio or visual score was the best discriminator. The mean time to progression was 4.6 times longer for lesions with negative 18F-FDOPA PET results than for lesions with positive 18F-FDOPA PET results (76.5 vs. 16.7 mo; P < 0.001). 18F-FDOPA PET findings tended to predict overall survival. Conclusion: Metabolic imaging with 18F-FDOPA PET was useful for differentiating RPBM from LDRI. Semiquantitative indices, particularly lesion-to-normal uptake ratios, could be used. A visual score comparing tumor 18F-FDOPA uptake and striatum 18F-FDOPA uptake provided the highest sensitivity and specificity and was predictive of disease progression.
Brain metastases from systemic cancers arise in 20%–40% of all cancer patients. They account for up to 170,000 new cases per year in the United States (1). Primary tumors that are most likely to metastasize to the brain include non–small cell lung cancer (50%), breast cancer (15%–25%), and melanoma (5%–20%) (2,3). Prognosis is poor, with reported median survival times of 7–9 mo for metastatic lung cancer (4), 2–9 mo for breast cancer (5), and 2–5 mo for melanoma (6). Patients with solitary lesions have longer survival times than those with multiple lesions (4–6).
The management of cerebral metastases usually involves a combination of surgery, radiotherapy, and chemotherapy tailored to individual patients on the basis of the location and number of lesions, performance status, and extent of systemic disease. Radiation therapy can be administered conventionally (whole-brain radiation therapy [WBRT]) or stereotactically (stereotactic radiosurgery [SRS] or stereotactic radiotherapy [SRT]). Most management strategies include surgical excision or SRS plus WBRT (7). Thus, most patients with cerebral metastases receive primary, adjunct, or salvage radiation therapy during the course of their disease.
Radiation injury to normal brain tissue is a significant side effect. Classically, radiation injury has been divided into acute and delayed reactions. Late or delayed radiation injury (LDRI) (i.e., “radiation necrosis”) has been reported to occur in 3%–24% of patients from 3 mo to 13 y after the completion of radiation therapy (8).
After radiation treatment, patients are monitored clinically and radiographically with serial MR imaging. It is challenging to noninvasively distinguish recurrent or progressive brain metastases (RPBM) from LDRI. First, both types of lesions can have similar clinical presentations, such as seizures, focal neurologic deficits, and increased intracranial pressure (9). Second, both types of lesions can have similar MR imaging appearances, such as perilesion edema, rimlike enhancement, and central hypointensity on T2-weighted imaging (9–11). As opposed to what occurs in RPBM, the enhancement usually becomes more discrete and the lesion volume tends to decrease with time in LDRI (9–12). Treatment options, including invasive modalities, differ for RPBM and LDRI. Therefore, accurate and timely differentiation of these 2 types of lesions can significantly affect patient care and outcome.
PET provides metabolic information that can be used to differentiate RPBM from LDRI (13). 18F-FDG PET has been used with variable success because of the high normal glucose metabolic activity of the brain (14,15). More promising results—mostly in the setting of primary brain tumors—have been reported with the amino acid PET tracers 11C-methionine (16) and O-(2-18F-fluoroethyl)-l-tyrosine (18F-FET) (17). Preliminary results of PET imaging with 6-18F-fluoro-l-dopa (18F-FDOPA) have also been promising (18).
The aims of this study were to assess the diagnostic accuracy of 18F-FDOPA PET imaging for the differentiation of RPBM from LDRI in patients whose brain metastases were treated with radiation and to evaluate the prognostic power of 18F-FDOPA PET imaging in predicting progression-free survival and overall survival.
MATERIALS AND METHODS
Patients and Lesions
From November 2004 to March 2012, 32 patients (26 women and 6 men) with 83 irradiated brain metastases were studied with 18F-FDOPA PET. The institutional review board approved this retrospective study, and the requirement to obtain informed consent was waived. The characteristics of the patients are summarized in Table 1. The median age was 58 y (range, 21–77 y). Primary tumors were lung (11 patients; 34 lesions), breast (11 patients; 29 lesions), thyroid (3 patients; 6 lesions), melanoma (3 patients; 4 lesions), testis (2 patients; 3 lesions), ovary (1 patient; 6 lesions), and colon (1 patient; 1 lesion) cancers.
Characteristics of Patients and Lesions Studied with 18F-FDOPA PET
All patients had undergone radiation therapy (SRS, 50 lesions; SRT, 3 lesions; WBRT, 12 lesions; WBRT plus SRS, 18 lesions) before the PET scan. Median treatment doses were 18 Gy for SRS (range, 9–25 Gy), 30 Gy for SRT (range, 24–30 Gy, in 6–10 fractions), and 37.5 Gy for WBRT (range, 30–45 Gy, in 15–18 fractions). SRT was administered as a postoperative boost to the tumor bed in all cases. The median time interval from the completion of radiation treatment to PET was 13.7 mo (range, 3.7–112.5 mo).
Patients were referred for 18F-FDOPA PET imaging to distinguish LDRI from RPBM suggested by MR imaging or clinical symptoms. Nine patients (27 lesions) were treated with corticosteroids on the basis of a change in symptoms and were still receiving corticosteroids at the time of PET.
18F-FDOPA PET
PET was performed on a dedicated system (ECAT HR or HR+; Siemens) for 13 patients; the remaining 19 patients were imaged with a dual-detector PET/CT system (Biograph Duo; Siemens). The dedicated PET system was equipped with bismuth germinate crystal detectors, and the PET/CT system was equipped with lutetium oxyorthosilicate crystal detectors and a dual-detector helical CT scanner. Phantom studies ascertained that activities measured with both scanners were comparable (mean difference of 2.5% in each case). Patients were asked to fast for at least 4 h before image acquisition. 18F-FDOPA was synthesized according to previously reported procedures (19,20) and was injected intravenously at a dose of 1.1–6.6 MBq/kg.
For dedicated PET, data were acquired in a 3-dimensional mode. Attenuation correction was calculated as reported previously (21). For PET/CT, a CT scan (120 kV, 80 mAs, 1-s tube rotation, 3-mm slice collimation) was acquired first. The CT data were used for attenuation correction as reported previously (22). For both PET and PET/CT scans, the emission scan was started 10 min after tracer injection. Images were acquired for 30 min in the 3-dimensional mode. Image data acquired between 10 and 30 min were summed to obtain a 20-min static image. PET images were reconstructed by use of iterative techniques with ordered-subset expectation maximization consisting of 6 iterations with 8 subsets (23). A gaussian filter with a full width at half maximum of 4 mm was applied. Radiotracer uptake was normalized to the injected dose per kilogram of patient’s body weight to obtain the standardized uptake value (SUV).
Image Analysis
Two experienced nuclear medicine physicians unaware of the clinical information interpreted the PET scans independently by using MR images acquired within 1 wk before the PET scans as a reference. PET images were coregistered with MR images. Images were first inspected visually. The axial PET image slice displaying the maximum lesion 18F-FDOPA uptake was selected and compared with the axial PET image slice displaying the maximum striatum 18F-FDOPA uptake. Both semiquantitative and qualitative approaches were applied for image analysis.
For semiquantitative analysis, a 10-mm circular region was placed over the area with the peak activity. This region of interest was used to derive the maximum SUV (SUVmax) and the mean SUV (SUVmean). Normal reference regions were defined in 2 ways. For the determination of tracer uptake in normal striatum, a region of interest was obtained by drawing an 80% peak-voxel-intensity isocontour over the contralateral striatum. The normal reference brain region was defined by drawing a region of interest involving the entire contralateral hemisphere at the level of the centrum semiovale to derive tumor-to-normal hemispheric brain tissue ratios as described previously (18). These normal reference regions were used to derive maximum lesion-to-striatum (L/Smax), mean lesion-to-striatum (L/Smean), maximum lesion-to-normal (L/Nmax), and mean lesion-to-normal (L/Nmean) uptake ratios.
For qualitative analysis, a 4-point visual scale was proposed and used to qualify lesions as follows: 0, lesion not visible on PET; 1, lesion visible but uptake less than striatum uptake; 2, lesion uptake and striatum uptake isointense; and 3, lesion uptake greater than striatum uptake.
Final Diagnosis and Follow-up of Patients
Patients were monitored clinically at least every 3 mo unless otherwise indicated by symptoms. PET findings were validated with a pathologic diagnosis of samples from surgical resection (9 lesions) or the radiologic course (74 lesions) within 6 mo of the PET scans. For patients who underwent surgical resection, the available tissue from excised tumors was fixed with formalin overnight (12–18 h) and embedded in paraffin. The paraffin blocks were cut into 5-μm-thick sections. All sections were stained with hematoxylin and eosin. A board-certified neuropathologist reviewed the samples to determine the presence of tumor, necrosis, and sequelae of radiation effects, including hyaline and fibrinoid changes in blood vessels, atypia of brain cells, and necrotic brain tissue associated with these findings.
For patients who did not undergo surgery, the radiographic diagnosis was determined as follows. Lesions that showed shrinkage or remained stable on contrast-enhanced, T1-weighted MR imaging after at least 6 mo of follow-up were considered to be LDRI (9–12), whereas lesions that showed increases in volume of 25% or more were considered to represent RPBM (24,25). Maximum enhanced lesion diameters in 3 orthogonal planes (sagittal [d1], axial [d2], and coronal [d3]) were used to calculate lesion ellipsoid volumes with the formula (4/3) × π[(d1 × d2 × d3)/2] (24).
Follow-up of patients was continued after diagnosis for outcome assessment. Progression-free survival and overall survival were calculated from the date of the baseline PET scan to the date of progression or death or to the date of the last follow-up, which was June 15, 2012.
Statistical Analysis
Statistical analysis was performed with PASW software (version 18.0; IBM). Significance was defined as a probability value of less than 0.05. The values of the 18F-FDOPA PET semiquantitative indices for RPBM and LDRI were compared with the Student t test. Receiver operating characteristic curve analysis was used to identify the optimal cutoff values of the various 18F-FDOPA PET indices for the differential diagnosis of RPBM versus LDRI. Threshold values were selected when the product of their respective sensitivities and specificities reached its maximum while both sensitivity and specificity were optimized.
The prognostic power of 18F-FDOPA PET in predicting progression-free survival and overall survival was analyzed by use of the Kaplan–Meier and Cox regression methods. Cox regression analysis was also used to compare the predictive power of 18F-FDOPA PET with that of other outcome predictors, such as age, primary tumor type, prior radiation treatment modality (stereotactic, conventional, or stereotactic and conventional), time from radiation treatment completion to PET, and steroid use.
RESULTS
Final Diagnosis
The final diagnosis of RPBM versus LDRI is summarized in Table 2. Nine lesions were surgically resected, with a median time from PET to resection of 35.5 d (range, 16–65 d). The radiologic course established the final diagnosis for the remaining 74 lesions. Thirty-two lesions were considered to be RPBM (32/83 [38.6%]), and 51 lesions were considered to be LDRI (51/83 [61.4%]).
Final Diagnosis of Lesions Studied with 18F-FDOPA PET
18F-FDOPA Uptake Indices
18F-FDOPA uptake was quantified as SUVmean, SUVmax, L/Smean, L/Smax, L/Nmean, and L/Nmax. Furthermore, lesions were scored visually as described earlier. Four examples are shown in Figure 1.
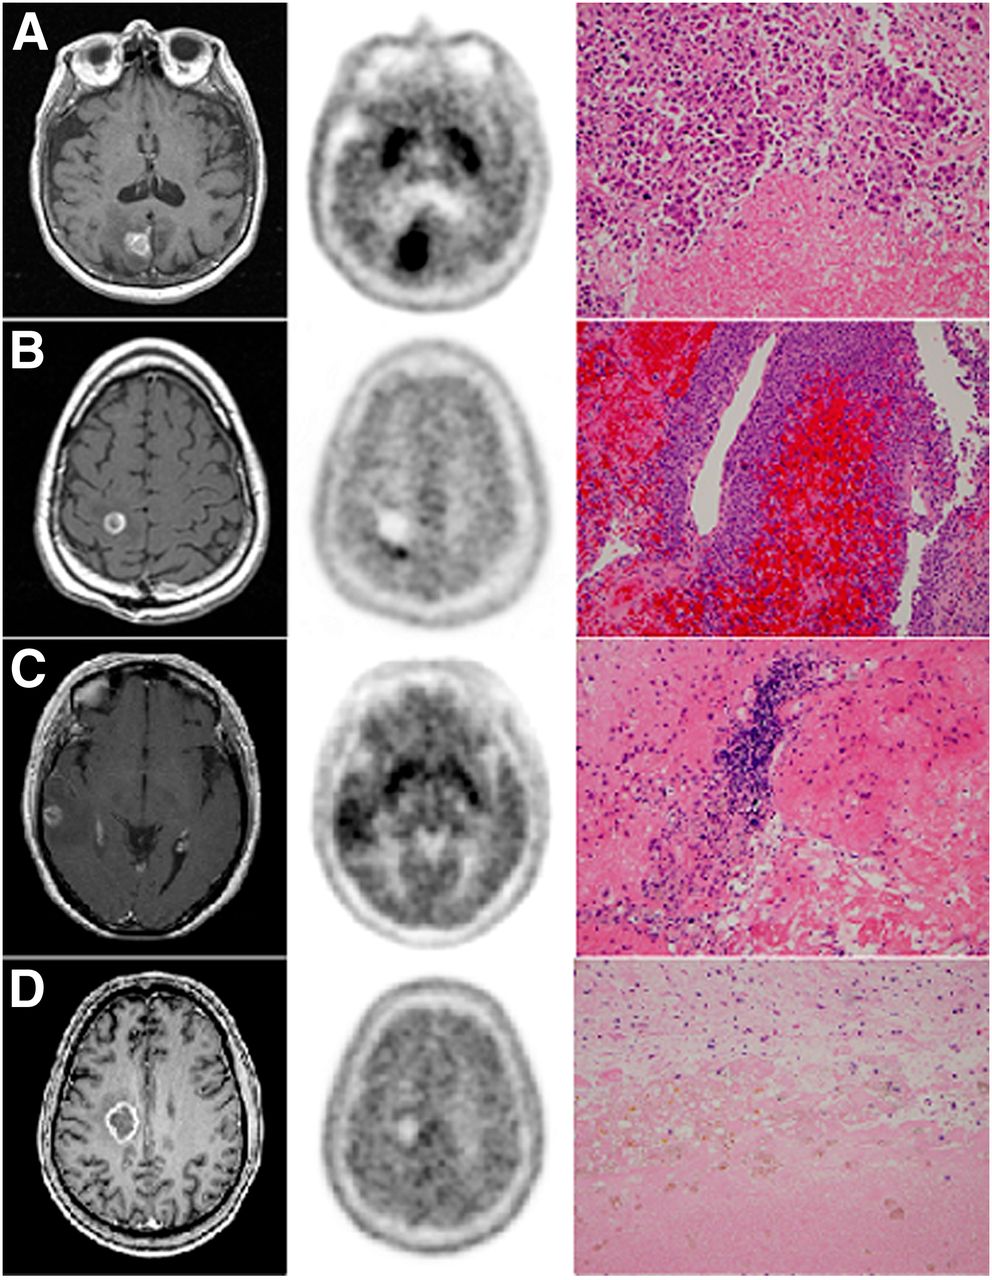
Illustrative examples. (A) L/Nmax, 3.53; L/Nmean, 3.20; L/Smax, 1.24; L/Smean, 1.67; visual scale score, 3; biopsy, RPBM (breast). (B) L/Nmax, 2.31; L/Nmean, 1.76; L/Smax, 1.06; L/Smean, 0.99; visual scale score, 2; biopsy, RPMB plus hemorrhage (melanoma). (C) L/Nmax, 2.04; L/Nmean, 1.73; L/Smax, 0.88; L/Smean, 0.94; visual scale score, 1; biopsy, LDRI plus inflammatory cells (lung). (D) L/Nmax, 1.75; L/Nmean, 1.31; L/Smax, 0.62; L/Smean, 0.63; visual scale score, 1; biopsy, LDRI plus hemosiderin macrophages (testis).
Semiquantitative PET scan data are shown in Table 3. All PET uptake indices were significantly higher for RPBM than for LDRI, particularly when lesions had been previously irradiated stereotactically.
Semiquantitative Analysis of 18F-FDOPA PET Imaging Data
Table 4 summarizes the receiver operating characteristic curve analysis of the 18F-FDOPA PET indices. The qualitative visual score provided the best sensitivity and specificity. When this visual scale was used, a score threshold of greater than or equal to 2 (i.e., uptake equal to or higher than that of the striatum) resulted in a sensitivity of 81.3%, a specificity of 84.3%, and an accuracy of 83.1% for differentiating RPBM from LDRI. Among the semiquantitative indices, the L/Nmax and L/Nmean uptake ratios had the highest accuracy (75.9%) for differentiating RPBM from LDRI. A sensitivity of 81.3% and a specificity of 72.5% were obtained with both L/Nmax values of greater than or equal to 2.02 and L/Nmean values of greater than or equal to 1.70.
Receiver Operating Characteristic Curve Analysis of 18F-FDOPA PET Diagnostic Criteria for Differentiating RPBM from LDRI
Predictive Value of 18F-FDOPA PET
The probability of disease progression determined with the visual scale is shown in Figure 2. A positive PET reading (defined by a visual scale score of greater than or equal to 2) had significant predictive power for time to progression of the evaluated lesion (P < 0.001, as determined with the log rank test). The predictive power for progression in a patient-based analysis was also significant (P < 0.05, as determined with the log rank test). There was a significant difference in mean time to progression between lesions with positive PET results (visual scale score of 2 or 3; 16.7 mo) and lesions with negative PET results (visual scale score of 0 or 1; 76.5 mo) (P < 0.001). There was a trend toward better survival for patients who had lesions with negative PET results (P = 0.06, as determined with the log rank test).
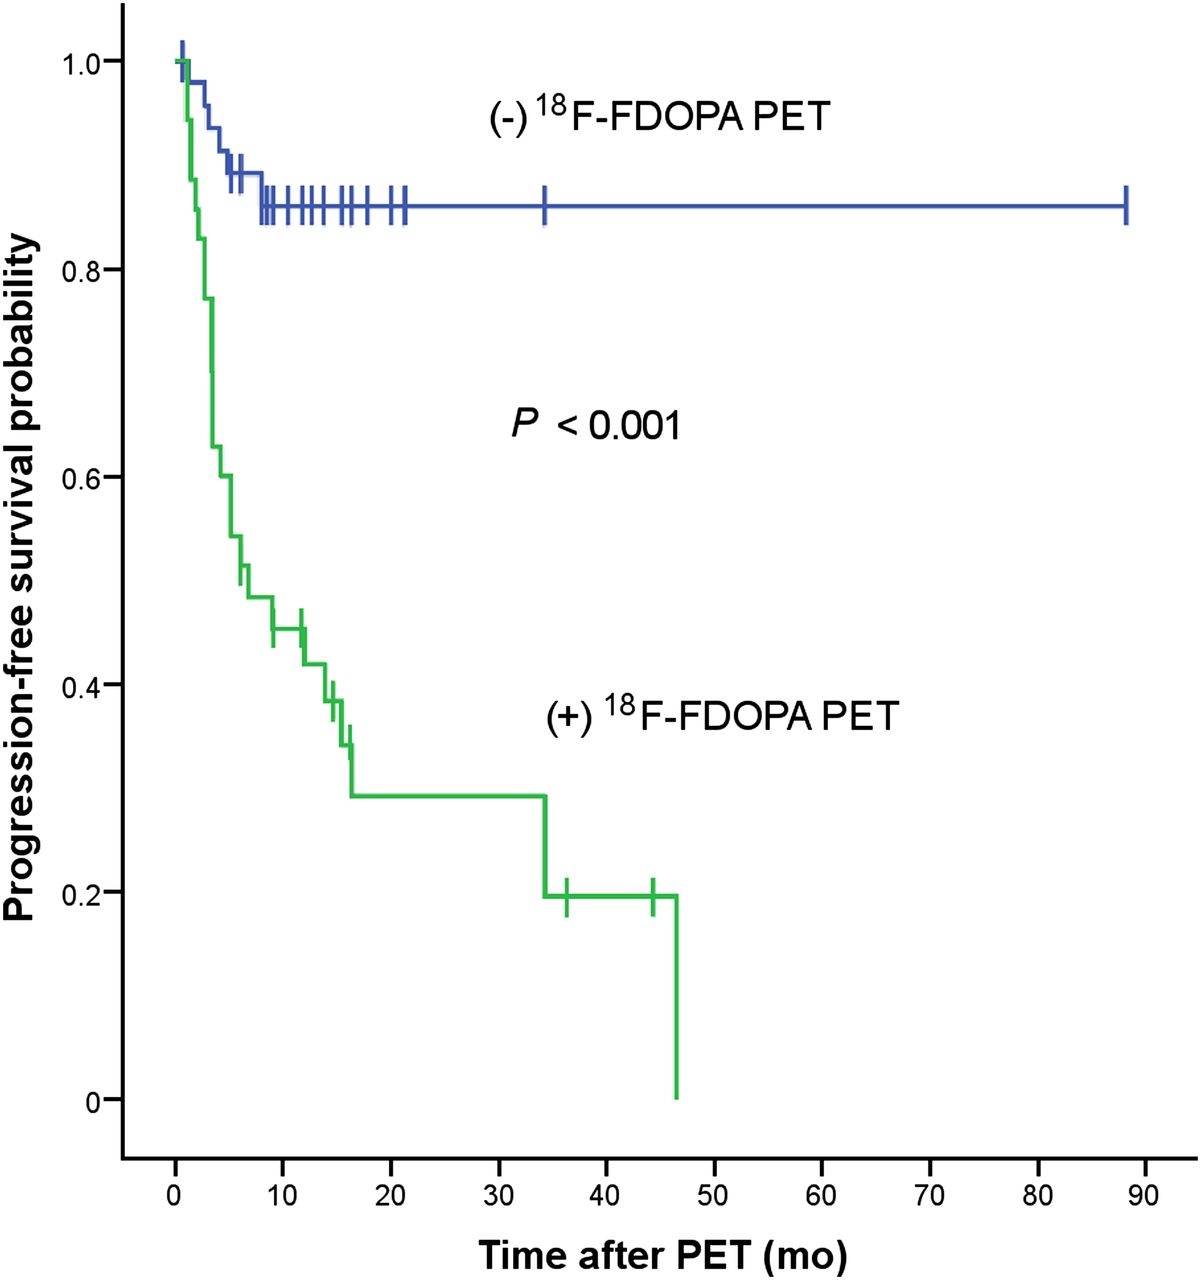
Predictive power of proposed 18F-FDOPA PET visual scale for lesion progression, as calculated by Kaplan–Meier method.
The univariate Cox regression analysis (Table 5) showed that prior conventional radiation treatment (P < 0.001), time from radiation treatment completion to 18F-FDOPA PET imaging of less than 6 mo (P = 0.003), and positive 18F-FDOPA PET results (P < 0.001) were predictive of progression, with hazard ratios of 4.54, 3.64, and 6.95, respectively. The multivariate analysis showed that only prior conventional treatment (P = 0.005) and positive PET results (P < 0.001) were predictive of progression, with hazard ratios of 3.50 and 6.26, respectively.
Cox Regression Analysis of Probability of Lesion Progression After 18F-FDOPA PET Imaging
Other clinical factors, such as a patient’s age (P = 0.306), primary tumor type (P = 0.217), prior stereotactic radiation treatment (P = 0.083), prior stereotactic and conventional radiation treatments (P = 0.521), and steroid use during PET imaging (P = 0.449), were not predictive (Table 5).
DISCUSSION
To our knowledge, this is the first study to investigate the diagnostic value of 18F-FDOPA PET for the differentiation of RPBM from LDRI in metastatic brain tumors. First, the results of the present study demonstrated that 18F-FDOPA PET could distinguish between RPBM and LDRI with a high diagnostic accuracy—83.1% (sensitivity, 81.3%; specificity, 84.3%)—in a population of patients in whom RPBM was suggested by MR imaging. Second, evaluation with 18F-FDOPA PET was highly prognostic of progression-free survival. Lesions with negative 18F-FDOPA PET results had a mean time to progression that was 4.6 times longer than that of lesions with positive 18F-FDOPA PET results (76.5 mo vs. 16.7 mo; P < 0.001). Third, both semiquantitative indices (L/Nmax and L/Nmean) and the qualitative assessment (visual scale score) comparing the intensity of lesion uptake with the intensity of striatum uptake performed comparably well in providing diagnosis and prognosis. Fourth, a trend toward predicting overall survival was seen.
18F-FDG was the first PET tracer used to distinguish RPBM from LDRI (26). A sensitivity of 65% and a specificity of 80% were reported (14). 18F-FDG uptake by normal cerebral cortex is high and variable. In addition, 18F-FDG uptake can be modified by nonneoplastic and radiation-related effects (inflammation, radiation injury, repair mechanisms, chemotherapy, and steroid treatment) (14,15,27). It was hypothesized that delineation of gliomas from gray matter with 18F-FDG PET could be improved by extending the interval between 18F-FDG administration and PET data acquisition (28). Indeed, in 12 of 19 patients studied, visual analysis showed that delayed images—obtained at 180–240 min after injection—better distinguished the high uptake in tumors relative to the uptake in gray matter. SUV comparisons also revealed higher uptake in tumors than in gray matter, brain, or white matter at delayed times (28). Furthermore, delayed imaging with 18F-FDG PET was investigated in 22 patients with previously irradiated gliomas being evaluated for recurrence versus necrosis (29). Regardless of histologic type, the differentiation of necrosis from metastatic brain lesions was improved by use of the change in the ratio of lesion SUVmax to gray matter SUVmax as a function of time.
18F-FDOPA is an amino acid analog PET tracer that is taken up by brain tumors because of increased amino acid transport in tumor tissue (17,30–33). The increased uptake in tumor tissue is most likely purely due to this increased transport, without involving a dopaminergic metabolism, because uptake time–activity curves showed a pattern different from that of striatum (18,31). In fact, in one of our early studies (18), the diagnostic accuracy of 18F-FDOPA PET was examined in 81 patients with gliomas by comparison of indices based on SUVmax, SUVmean, tumor-to-striatum ratio, tumor-to-normal hemisphere ratio, and tumor-to-normal white matter ratio. The conclusion was that all of these indices had comparable diagnostic accuracies. The idea of using a visual scale based on the lesion-to-striatum ratio came from clinicians. Although it is true that, because of its intrinsic dopaminergic metabolism, background striatum 18F-FDOPA uptake could be influenced by several physiologic, pharmacologic, and pathophysiologic processes (34), it could prove practically useful by providing an internal reference standard for clinically applicable visual scale scoring. This simple and clinically practical approach would be especially useful when 18F-FDOPA uptake quantitative measurements are not available, such as in a clinic setting. In fact, the proposed qualitative visual scale provided the best results overall in the present study.
Studies in which amino acid PET tracers have been used to distinguish recurrent tumor from radiation-induced changes are limited. 11C-methionine is the amino acid analog PET tracer that has been studied the most. In 1 study, a sensitivity of 77.8% and a specificity of 100% were obtained, with a mean uptake ratio threshold of 1.41, for distinguishing RPBM from LDRI (16). In a second, larger study, a sensitivity of 79% and a specificity of 75%, with a similar cutoff value, were reported (35). 18F-FET PET was recently reported to have a similar sensitivity (74%) and improved specificity (90%), with a mean uptake ratio threshold of 1.95 (36). Our findings of an 18F-FDOPA L/Nmax of greater than or equal to 2.02 and an L/Nmean of greater than or equal to 1.70, providing a sensitivity of 81.3% and a specificity of 72.5%, are consistent with the findings of these earlier studies. Notably, the addition of tracer kinetic analysis and time–activity curve patterns of 18F-FET PET significantly improved both sensitivity (84%) and specificity (100%) (36).
A multivariate analysis showed 2 significant predictors of progression. In addition to having positive 18F-FDOPA PET results, lesions previously treated with conventional radiation (i.e., WBRT) alone were 3.5 times more likely to progress (P < 0.005) (Table 5). Significantly better local control with WBRT plus SRS than with WBRT alone has been discussed elsewhere (37). In addition, patients who were treated with WBRT might have had more severe disease than those treated with SRS alone. Only a trend for predicting overall survival was seen (P = 0.06). This result was not surprising because the mortality of patients with metastatic brain tumors can result from systemic disease as well. Finally, a time from radiation completion to PET imaging of less than 6 mo was predictive of progression in the univariate analysis but not in the multivariate analysis. This loss of significance might have been due to the presence of other variables, such as a higher likelihood of RPBM versus LDRI in this time period (7,37).
Different radiation therapy modalities (e.g., WBRT, SRS, and SRT) might affect 18F-FDOPA uptake differently in normal brain tissue. Interestingly, in the LDRI group, striatum 18F-FDOPA uptake was lower in patients treated with WBRT than in those treated with stereotactic radiation (Table 3). This result could have been due to reduced amino acid transport in normal tissue affected by radiation in WBRT, because stereotactic radiation targets tumors more focally. Moreover, the effects of radiation might include specific dopaminergic alterations. Remarkably, in both the LDRI group and the RPBM group, normal brain uptake indices were also lower in patients treated with WBRT than in those treated with stereotactic radiation alone (Table 3). Further studies are needed to establish whether and how the radiation modality influences 18F-FDOPA uptake in normal brain tissue, RPBM, and LDRI.
False-negative PET scan results could be caused by smaller lesions, variability in the upregulation of amino acid transport among different tumors, or different cell proliferation rates. False-positive 18F-FDOPA findings might have arisen from previous treatment effects, such as breakdown of the blood–brain barrier, which could increase tumor 18F-FDOPA uptake (38). Moreover, inflammation might affect 18F-FDOPA uptake in normal tissue, an issue that has not been investigated to date. Steroid therapy, age, and tumor type were not predictive of progression in the present study. Determining the predictive significance of these factors for progression requires further investigation.
The present study has several limitations. First, the study population was small. Second, the retrospective nature of the study could have introduced selection bias. Third, the time between the completion of radiation treatment and PET had a long range, from 4 mo to 9 y. Although LDRI has been reported up to 13 y after radiation (8), the probabilities of RPBM and LDRI may vary considerably in this time period. Fourth, MR imaging and PET imaging techniques have evolved in this time period. Fifth, because multiple lesions occur frequently in cerebral metastases and biopsy is usually not performed for all lesions, pathologic verification was available only in a small subset of patients and radiologic criteria were used for the final diagnosis in a large percentage of patients. However, with hybrid technologies such as PET/CT or software fusion of PET and MR images, localization and follow-up of lesions are feasible. Finally, the image analysis method and the radiologic criteria used to determine the final diagnosis have not been standardized (24,25).
PET measurements may be affected by clinical as well as technical variables. In addition, the possible coexistence of RPBM and LDRI in the same lesion can render quantitative measurements even more complicated. Hence, the implementation of standard cutoff values across multiple centers can be challenging. The use of visual scales and lesion-to-normal tissue ratios, such as those proposed in the present study, represents a practical approach that could be easily implemented in routine clinical practice.
CONCLUSION
Metabolic imaging with 18F-FDOPA PET provided high diagnostic accuracy for differentiating RPBM from LDRI. Semiquantitative parameters, particularly an L/Nmax of greater than or equal to 2.02 and an L/Nmean of greater than or equal to 1.70, were useful. However, a qualitative visual scale score of greater than or equal to 2 (i.e., lesion uptake equal to or higher than contralateral striatum uptake) was best at predicting the course of the disease. These findings need to be validated in larger prospective studies.
DISCLOSURE
The costs of publication of this article were defrayed in part by the payment of page charges. Therefore, and solely to indicate this fact, this article is hereby marked “advertisement” in accordance with 18 USC section 1734. This study was supported in part by institutional funding at the Department of Molecular and Medical Pharmacology, David Geffen School of Medicine, UCLA. No other potential conflict of interest relevant to this article was reported.
Acknowledgments
We thank Dr. David Elashoff and Tristan Grogan, Department of General Internal Medicine, David Geffen School of Medicine, UCLA, for statistical review of the article.
Footnotes
Published online Oct. 28, 2013.
- © 2014 by the Society of Nuclear Medicine and Molecular Imaging, Inc.
REFERENCES
- Received for publication February 7, 2013.
- Accepted for publication July 25, 2013.


Jump to section
Related Articles
Cited By...
- Amino Acid PET in Neurooncology
- Utility of Amino Acid PET in the Differential Diagnosis of Recurrent Brain Metastases and Treatment-Related Changes: A Meta-analysis
- Amino Acid PET in Neurooncology
- Treatment Monitoring of Immunotherapy and Targeted Therapy Using 18F-FET PET in Patients with Melanoma and Lung Cancer Brain Metastases: Initial Experiences
- Diagnostic Accuracy of Amino Acid and FDG-PET in Differentiating Brain Metastasis Recurrence from Radionecrosis after Radiotherapy: A Systematic Review and Meta-Analysis
- Differentiation between Treatment-Induced Necrosis and Recurrent Tumors in Patients with Metastatic Brain Tumors: Comparison among 11C-Methionine-PET, FDG-PET, MR Permeability Imaging, and MRI-ADC--Preliminary Results
- 18F-FET PET Uptake Characteristics in Patients with Newly Diagnosed and Untreated Brain Metastasis
- Molecular Imaging to Plan Radiotherapy and Evaluate Its Efficacy