


Abstract
There is evidence in some solid tumors that textural features of tumoral uptake in 18F-FDG PET images are associated with response to chemoradiotherapy and survival. We have investigated whether a similar relationship exists in non–small cell lung cancer (NSCLC). Methods: Fifty-three patients (mean age, 65.8 y; 31 men, 22 women) with NSCLC treated with chemoradiotherapy underwent pretreatment 18F-FDG PET/CT scans. Response was assessed by CT Response Evaluation Criteria in Solid Tumors (RECIST) at 12 wk. Overall survival (OS), progression-free survival (PFS), and local PFS (LPFS) were recorded. Primary tumor texture was measured by the parameters coarseness, contrast, busyness, and complexity. The following parameters were also derived from the PET data: primary tumor standardized uptake values (SUVs) (mean SUV, maximum SUV, and peak SUV), metabolic tumor volume, and total lesion glycolysis. Results: Compared with nonresponders, RECIST responders showed lower coarseness (mean, 0.012 vs. 0.027; P = 0.004) and higher contrast (mean, 0.11 vs. 0.044; P = 0.002) and busyness (mean, 0.76 vs. 0.37; P = 0.027). Neither complexity nor any of the SUV parameters predicted RECIST response. By Kaplan–Meier analysis, OS, PFS, and LPFS were lower in patients with high primary tumor coarseness (median, 21.1 mo vs. not reached, P = 0.003; 12.6 vs. 25.8 mo, P = 0.002; and 12.9 vs. 20.5 mo, P = 0.016, respectively). Tumor coarseness was an independent predictor of OS on multivariable analysis. Contrast and busyness did not show significant associations with OS (P = 0.075 and 0.059, respectively), but PFS and LPFS were longer in patients with high levels of each (for contrast: median of 20.5 vs. 12.6 mo, P = 0.015, and median not reached vs. 24 mo, P = 0.02; and for busyness: median of 20.5 vs. 12.6 mo, P = 0.01, and median not reached vs. 24 mo, P = 0.006). Neither complexity nor any of the SUV parameters showed significant associations with the survival parameters. Conclusion: In NSCLC, baseline 18F-FDG PET scan uptake showing abnormal texture as measured by coarseness, contrast, and busyness is associated with nonresponse to chemoradiotherapy by RECIST and with poorer prognosis. Measurement of tumor metabolic heterogeneity with these parameters may provide indices that can be used to stratify patients in clinical trials for lung cancer chemoradiotherapy.
Personalized medicine is a goal in modern cancer therapy, with the aim that optimal treatment can be selected for an individual patient depending on tumor characteristics in that individual. The ability to predict the behavior of a tumor to treatment before therapy is started would be invaluable in enabling stratification in clinical trials or personalizing future cancer treatments in the clinic.
In clinical routine and, increasingly, in clinical trials, serial 18F-FDG PET/CT is being used successfully in several cancers to detect early treatment effects before morphologic changes can be seen on CT or MRI. However, it has been harder to demonstrate the ability to predict response to treatment or to predict survival from a single baseline scan before therapy has been started.
In non–small cell lung cancer (NSCLC), several studies have shown the utility of serial 18F-FDG PET/CT to measure response to neoadjuvant chemotherapy (1–6), chemoradiotherapy (7,8), or novel biologic therapies (9,10). There is also more limited evidence that the level of uptake on pretreatment scans, as measured by various standardized uptake value (SUV) parameters, may be predictive (11–14), but results conflict as to whether high or low SUVs are predictive depending on treatment modality (13,14).
Beyond the relatively simple measurements of the level of tumor uptake or size, there is increasing recognition that measurement of the spatial heterogeneity of 18F-FDG PET image characteristics can give predictive information on baseline, pretherapy, imaging in several solid tumors including sarcoma (15), head and neck and cervix tumors (16–18), and esophageal carcinoma (19). In NSCLC, a potential heterogeneity parameter using SUV volume histograms has been described but not clinically tested (20). Multimodality image feature modeling including 18F-FDG PET and CT has also been described as a possible predictor of locoregional recurrence in NSCLC after radiotherapy (21).
Several different textural parameters have been reported in 18F-FDG PET, but parameters derived from neighborhood gray-tone (intensity) difference matrices (NGTDM), describing features such as coarseness, contrast, busyness, and complexity (22), have shown the ability to differentiate primary and nodal tumor from normal tissue in head and neck cancer (17) and allow the delineation of radiotherapy plans (18). In addition, coarseness has been reported as one of the textural parameters that can predict response to chemoradiotherapy in esophageal cancer (19).
We hypothesized that the textural features derived from NGTDMs that reflect differences between the intensity of each voxel and its neighboring voxels in 18F-FDG PET images may be associated with differences in response to treatment and survival in NSCLC. The aim of this study was to assess the predictive and prognostic value of these parameters in patients with NSCLC being treated with concurrent chemoradiotherapy, compared with SUV parameters such as mean SUV (SUVmean), maximum SUV (SUVmax), and peak SUV (SUVpeak); metabolic tumor volume (MTV); and total lesional glycolysis (TLG).
MATERIALS AND METHODS
A waiver of institutional review board approval was obtained for this retrospective analysis. Fifty-three consecutive patients (mean age, 65.8 y; 31 men, 22 women) with NSCLC who were treated with definitive radiotherapy and concurrent chemotherapy in our tertiary cancer center between January 2007 and December 2009 were included. All patients who were considered for definitive treatment in our center were staged with 18F-FDG PET/CT. 18F-FDG PET/CT was performed at a median of 45 d (mean, 53 d; range, 0–174 d; 25th percentile, 35 d; 75th percentile, 63 d) before treatment. There were 21 patients with adenocarcinoma, 24 with squamous cell carcinoma, and 8 for whom histologic results were not available. Clinical staging was as follows: stage 1B (n = 3), stage 2B (n = 5), stage 3A (n = 24), and stage 3B (n = 21) (23). No patient had metastatic M1 disease. Thus, most patients had locally advanced (stage 3) lung cancer and were not considered suitable for surgery or were medically inoperable. Clinical follow-up after treatment was performed according to departmental protocol: every 4 wk for the first 3 mo, every 2 mo for the first year, and every 3 mo thereafter.
Patients were treated with 64 Gy of radiotherapy and concurrent vincristine–cisplatin or vincristine–carboplatin chemotherapy. Patient response was assessed with Response Evaluation Criteria in Solid Tumors (RECIST) using diagnostic contrast-enhanced CT at 12 wk, with results available in 48 of the 53 patients. Overall survival (OS), progression-free survival (PFS), and local PFS (LPFS) or time to last censoring was recorded from the date of the PET scan. Data were abstracted by a single oncologist investigator who had previous experience with similar oncology study data collection and was masked to the PET results before data collection. OS was defined as the time in months between the PET scan and the date of death, PFS as time between the PET scan and locoregional or distant relapse, and LPFS as the time between the PET scan and locoregional relapse. Patients who were alive were censored at the time of the last clinical follow-up.
18F-FDG PET/CT scans were all acquired using the same protocol in the same institution on either a Discovery VCT or a Discovery DST (both GE Healthcare), which were cross-calibrated to within 3% (24). Patients fasted for at least 6 h before the administration of 350–400 MBq of 18F-FDG. Ninety minutes after injection, scans were acquired from the upper thigh to the base of skull. Images were reconstructed using ordered-subset expectation maximization with a slice thickness of 3.27 mm and a pixel size of 5 mm. The CT component of the scans was acquired at 120 kVp and 65 mAs without the administration of an oral or intravenous contrast agent.
SUVmean, SUVmax, and SUVpeak (25), as well as MTV and TLG (SUVmean × MTV), were calculated for the primary tumors using semiautomated software for volume-of-interest (VOI) placement (Gold 3; Hermes). An initial threshold of 45% was applied for automated definition of volumes of interest and adjusted by the operator if nontumoral tissues were incorrectly included in the volume of interest by the software (26). Nodal disease was not included in the analysis. For purposes of textural analysis, regions of interest were drawn manually around the active primary tumors on each transaxial slice on which the tumor was visible. One observer with more than 15 y of experience with 18F-FDG PET in NSCLC and region-of-interest definition performed the analyses and was masked to the patient outcome data before analysis. Primary tumor texture was measured by coarseness, contrast, busyness, and complexity derived from 3-dimensional matrices, and differences between each PET image voxel and its neighbor were calculated, taking into consideration the neighboring voxels in the 2 adjacent planes for each voxel, as previously described (19,22). Reproducibility for 18F-FDG PET textural features in NSCLC has previously been reported as being as good as or better than that for SUVs (27).
Statistical analyses were performed using a software package (SPSS Statistics, version 20; IBM). A sample size calculation was not made for this retrospective cohort study, and corrections for multiple comparisons were not used. Differences in coarseness, contrast, busyness, and complexity, as well as differences in each of the SUV parameters, MTV, and TLG, were compared in nonresponders (stable disease/progressive disease) and responders (complete response/partial response) by CT RECIST with the Mann–Whitney U test. Areas under the receiver-operating-characteristic (ROC) curves were calculated for the textural features and the SUV parameters to assess the accuracy in predicting response according to RECIST.
Differences in Kaplan–Meier survival curves were evaluated using a nonparametric log-rank test. An optimum cut point for the level of the textural features was calculated, maximizing the sum of sensitivity and specificity from ROC curves, and was used to compare groups with either high or low textural values. Estimates of the sensitivity and specificity were calculated at this cut point, along with corresponding exact binomial confidence intervals (CIs). Cox regression was used to examine the effects of the textural parameters and other variables on the survival outcomes. Initially, the individual effect of each variable on the outcomes was examined in a series of univariable analyses. Subsequently, a multivariable analysis was performed to jointly examine the variables. Because of the relatively small number of events, the multivariable analysis was restricted to variables with univariable P values of less than 0.25. In addition, because of a highly skewed distribution of TLG, this variable was analyzed on the log scale. Furthermore, SUVmean and SUVmax, which are highly correlated with SUVpeak, and MTV, which is highly correlated with TLG, were not included in the regression analyses. Log–log plots were used to visually examine whether the proportional hazards assumptions were met. P values of less than 0.05 were considered statistically significant, and 95% CIs were calculated.
RESULTS
The demographic and clinical characteristics of patients are summarized in Table 1. The distribution of the SUV, MTV, TLG, and textural parameters is summarized in Table 2.
Patient Demographic and Clinical Characteristics
Range, Mean, and SD of SUV Parameters, MTV, TLG, and Measured Textural Features
Response Prediction
None of the SUV parameters, MTV, or TLG was significantly different between responders (partial response/complete response) and nonresponders (stable disease/progressive disease). RECIST responders showed statistically significantly lower coarseness and higher contrast and busyness than nonresponders, but no statistical difference was seen for complexity (Table 3).
Mean Values for Calculated Textural Features for Responders and Nonresponders by CT RECIST
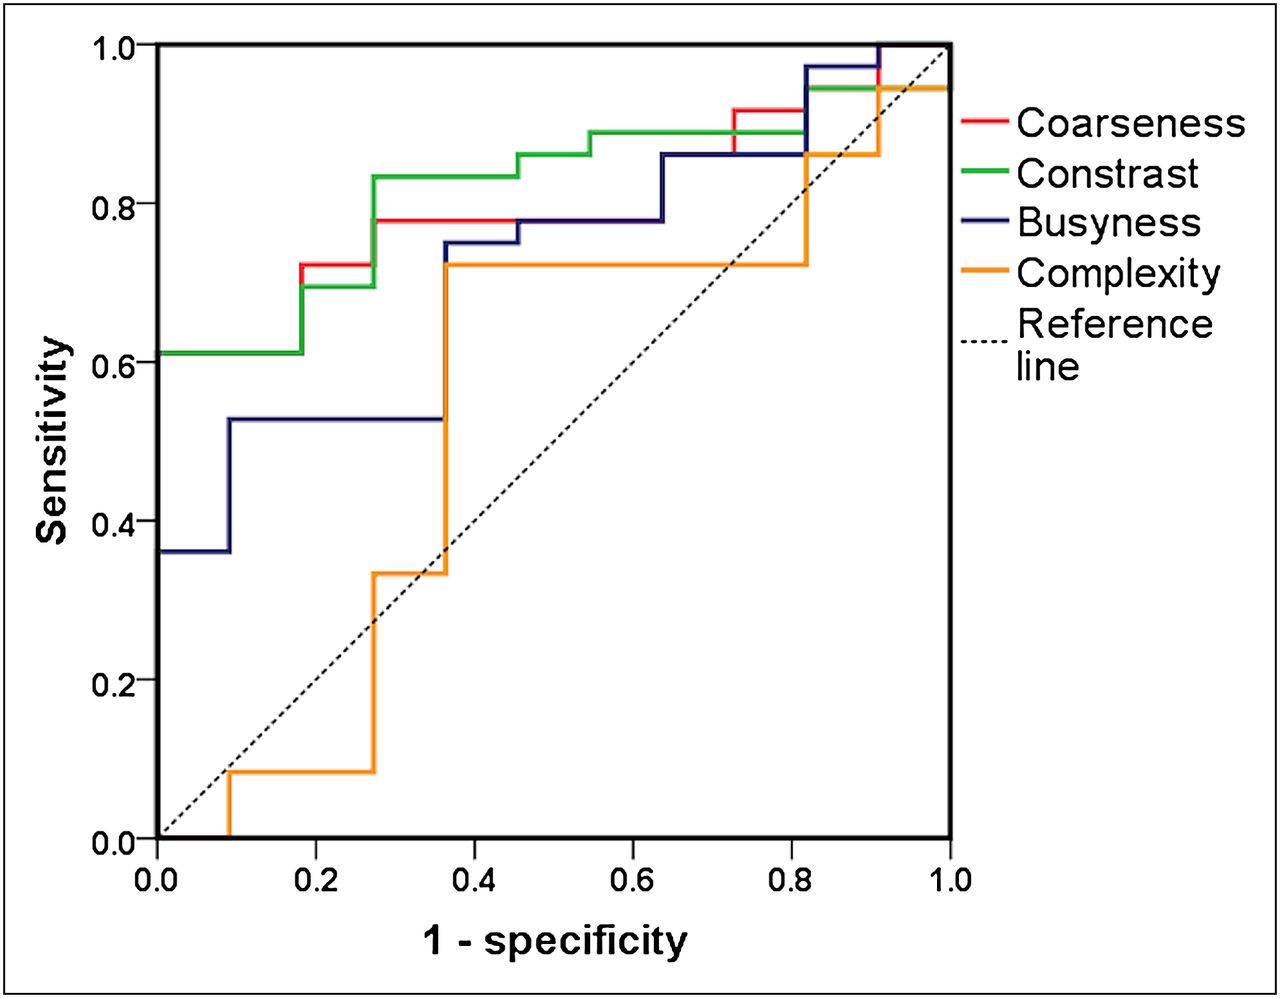
The areas under the ROC curves for the ability to predict RECIST response for the textural features were 0.8 for coarseness (CI, 0.67–0.92; P = 0.003), 0.82 for contrast (CI, 0.7–0.94; P = 0.002), 0.72 for busyness (CI, 0.57–0.89; P = 0.027), and 0.54 for complexity (CI, 0.32–0.75; P = 0.71). Details are recorded in Table 4 and Figure 1. No significant differences from the line of reference were seen for any of the SUV parameters, MTV, or TLG.
Area Under ROC Curves for Ability of Measured Textural Features, SUV Parameters, MTV, and TLG to Predict Response Using RECIST

ROC curves for baseline 18F-FDG PET primary tumor coarseness, contrast, busyness, and complexity for identification of responders vs. nonresponders by RECIST at 12 wk. Table 4 shows areas under ROC curve.
Survival Prediction
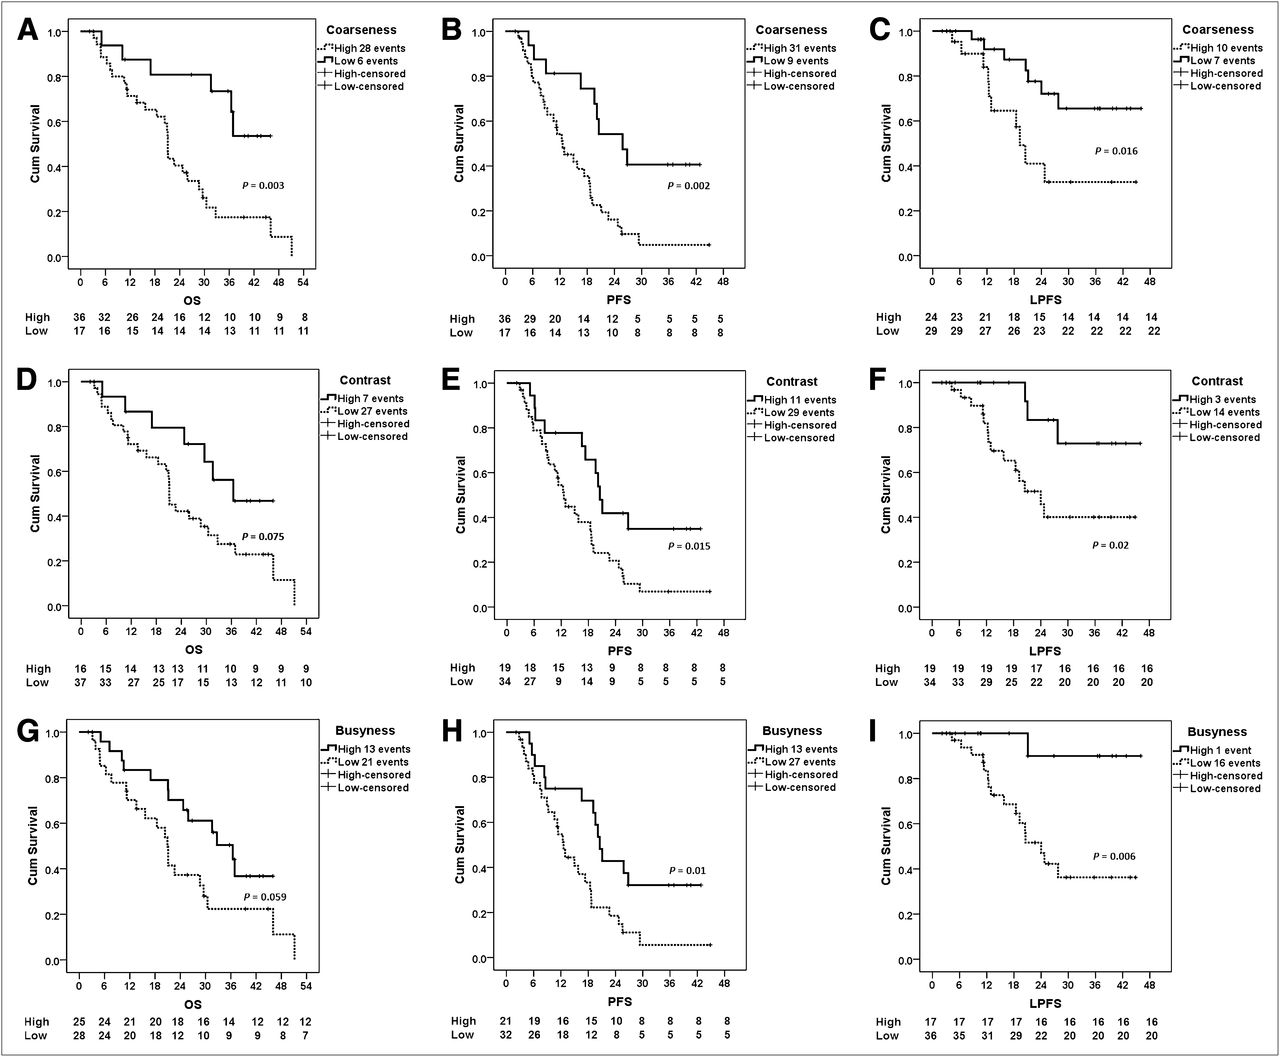
Median follow-up was for 21.2 mo (range, 2.1–51.1 mo). Median OS was 25.6 mo (range, 3.1–51.1 mo), PFS was 16.6 mo (range, 2.8–44.9 mo), and LPFS was not reached (range, 4.3–46 mo). By Kaplan–Meier analysis, OS, PFS, and LPFS were lower in patients with high primary tumor coarseness (median, 21.1 mo vs. not reached, P = 0.003; 12.6 vs. 25.8 mo, P = 0.002; and 12.9 vs. 20.5 mo, P = 0.016, respectively) (Figs. 2A–2C).

Kaplan–Meier plots demonstrating differences in patients with high and low primary tumor 18F-FDG PET coarseness (A–C), contrast (D–F), and busyness (G–I). Differences in OS (A, D, and G), PFS (B, E, and H), and LPFS (C, F, and I) are demonstrated. Cum = cumulative.
Contrast and busyness did not show significant associations with OS (P = 0.075 and 0.059, respectively), but PFS and LPFS were significantly longer in patients with high levels of each (for contrast: median of 20.5 vs. 12.6 mo, P = 0.015, and median not reached vs. 24 mo, P = 0.02; and for busyness: median of 20.5 vs. 12.6 mo, P = 0.01, and median not reached vs. 24 mo, P = 0.006) (Figs. 2D–2I) (Table 5). Neither complexity nor any of the SUV parameters showed statistically significant associations with the survival parameters.
Data Related to Kaplan–Meier Analysis
The results of univariable and multivariable Cox regression analysis, used to examine the effects of textural parameters and other variables on survival outcomes, are shown in Table 6. The log–log plots suggested that the hazards were approximately proportional for all variables.
Effects of Variables on OS, PFS, and LPFS
Coarseness was associated with OS in both the univariable and multivariable analyses (P = 0.007 and 0.02, respectively). A high coarseness was associated with an increased risk of death, and the hazard of death at any time was almost 5 times higher for patients with a high coarseness value than for those with lower values (from multivariable analysis).
For PFS, coarseness, contrast, and busyness were all statistically significant in the univariable analyses (P = 0.003, 0.02, and 0.02, respectively). High coarseness values were associated with an increased risk of progression, whereas high contrast and busyness values were associated with a lower risk of progression. The multivariable analyses suggested that no variables were statistically significant. Of the texture variables, the largest effects were for coarseness.
Coarseness was found to be most associated with LPFS. High coarseness values were associated with a greater risk of local progression and thus shorter times to local progression. This result was statistically significant in the univariable analyses (P = 0.01), with the result of borderline statistical significance in the multivariable analyses (P = 0.06).
DISCUSSION
Our results add to the accumulating evidence that measurements of textural features of 18F-FDG uptake within PET images of cancer can predict response and are associated with survival. To our knowledge, this has not previously been reported in patients with NSCLC undergoing concurrent chemoradiotherapy. We also found that textural features performed better than SUV parameters, MTV, and TLG, which had no predictive or prognostic power in this series. The ineffectiveness of these parameters was possibly due to poorer discrimination in a group of predominantly higher-stage patients and those with comorbidity, resulting in their being selected for chemoradiotherapy rather than surgery. Specifically, the textural features derived from NGTDMs—including coarseness, contrast, and busyness—were able to differentiate subsequent responders from nonresponders. All 3 features were related to PFS and LPFS, whereas coarseness was also related to OS and was an independent predictor of survival parameters, compared with other potential clinical and imaging risk factors.
The ability to predict response and survival from pretreatment scans is an advantage over using serial scans, and textural analysis has the benefit of being a postprocessing technique that can be applied to data acquired during standard clinical imaging protocols, maximizing the information that can be derived from standard PET images. Baseline assessment is particularly advantageous in lung cancer being treated with radiotherapy because much of the posttreatment 18F-FDG activity may be due to pneumonitis rather than residual cancer, thus making interpretation and quantitative response assessment problematic with PET (28).
Coarseness, contrast, busyness, and complexity are fundamental parameters of image texture that have been correlated with human perception of texture within an image (18,22). These features are derived from NGTDMs. They describe local tumor texture based on differences between each voxel and the neighboring voxels in adjacent image planes. Coarseness has been likened to granularity within an image and is the most fundamental property of texture. One study of esophageal carcinoma (19) described coarseness as a feature that may discriminate responders to chemoradiotherapy from nonresponders, although contrast and busyness were not predictive in that study. Coarseness is also a parameter that best differentiates head and neck cancer primary and nodal tumors from normal tissues (18) and in combination with other textural features has been used to delineate radiotherapy planning volumes in head and neck cancer (17). Contrast relates to the dynamic range of intensity levels in an image, and the level of local intensity variation and busyness relates to the rate of intensity change within an image. Complexity relates to high information content—for example, when there are many sharp edges or lines—but may be more relevant to 2-dimensional images.
Other textural features of 18F-FDG PET images have been reported to be predictive and prognostic. In sarcoma, the measurement of heterogeneity, by variation from a model for homogeneous tissues, has been described and predicts patient outcome (15), and regional textural features predicted response to chemoradiotherapy in esophageal carcinoma (19).
There is also accumulating literature on the predictive abilities of several textural features in morphologic imaging methods, including CT and MRI. For example, changes in textural features related to the heterogeneity of CT images have been found to be independent predictors of time to progression in renal carcinomas treated with tyrosine kinase inhibitors (29), and textural features in unenhanced CT scans of esophageal carcinoma have been related to SUV parameters in corresponding 18F-FDG PET scans and to tumor stage and survival (30). Specifically in lung cancer, CT features have been shown to help differentiate aggressive from nonaggressive NSCLC (31) and to show differences between histologic subtypes (32). More recent work has shown relationships between CT features and survival (33), glucose metabolism (34), and histologic correlations including angiogenic and hypoxia markers (35).
Although several textural features in structural and functional imaging of cancer have been shown to differentiate tumor types, predict treatment response, or be associated with survival, the biologic correlates of textural features are largely unknown. It is postulated that increased image heterogeneity within tumors may be associated with differences in regional tumor cellularity, proliferation, hypoxia, angiogenesis, and necrosis (19,35), factors that independently have been associated with more aggressive behavior, poorer response to treatment, and worse prognosis. Although it is unlikely that structural and functional imaging textural features are associated with the same biologic causes of spatial intensity variations within an image, in general, features that correspond to increased heterogeneity have been assumed to relate to a poorer prognosis and poor response to treatment. However, given the multitude of textural parameters that have been described and the complexities resulting from the measurement of local, regional, or global textural features, this assumption is probably an oversimplification of the relationships between tumor biology and heterogeneity within an image. For example, CT features related to increased heterogeneity, including increased entropy or decreased uniformity, predict poor response or survival (29,30,33). On the other hand, in 18F-FDG PET of esophageal carcinoma, responders to treatment showed greater local heterogeneity at baseline, but measures of regional tumor heterogeneity showed better response stratification (19). In head and neck cancer, tumor and nodes have been reported as having low coarseness and busyness but high contrast, compared with normal tissues (18). The relationship between textural features and tissue characteristics is therefore complex, and textural feature measurements can clearly not simply be regarded as lying on a spectrum between heterogeneity and homogeneity. Thus, there is a need to carefully investigate textural features from different imaging modalities and to use different PET tracers to correlate with histopathologic features that may influence image texture, including angiogenesis, hypoxia, and proliferation, either in a preclinical model or in humans when tissue is available for complementary histologic analysis.
Our study is limited by being retrospective. There was some heterogeneity in the stage and histology between patients, although the study benefits from a homogeneous treatment regime in the cohort of patients. Though the results would appear promising for new predictive biomarkers, caution should be exercised until the results can be confirmed prospectively. Tumor regions of interest for textural analysis were drawn manually, and it is possible that better inter- and intraobserver variation would be gained if automated methods were used, particularly for multicenter studies in the future. There will also be a need to understand how data from different scanners at different centers might vary for these methods to become of utility in a multicenter setting.
CONCLUSION
Abnormal texture in baseline 18F-FDG PET scans, as measured by coarseness, contrast, and busyness, in patients with NSCLC is associated with nonresponse to chemoradiotherapy by RECIST and with poorer prognosis. In conjunction with other similar studies, this association suggests that textural image features may provide predictive and prognostic biomarkers that offer promise for personalized medicine in which patients might be stratified before treatment in clinical trials and in clinical practice, with the potential to reduce toxicity from ineffective treatments.
DISCLOSURE
The costs of publication of this article were defrayed in part by the payment of page charges. Therefore, and solely to indicate this fact, this article is hereby marked “advertisement” in accordance with 18 USC section 1734. We acknowledge support from the Biomedical Research Centre of Guys & St. Thomas’ Trust and the CRUK/EPSRC Comprehensive Cancer Imaging Centre of KCL/UCL. No other potential conflict of interest relevant to this article was reported.
Acknowledgments
We thank Paul Bassett (BSc, FRSS) for statistical advice and analysis.
Footnotes
Published online Nov. 30, 2012.
- © 2013 by the Society of Nuclear Medicine and Molecular Imaging, Inc.
REFERENCES
- Received for publication April 17, 2012.
- Accepted for publication August 6, 2012.


Jump to section
Related Articles
Cited By...
- Early Phase I Study of a 99mTc-Labeled Anti-Programmed Death Ligand-1 (PD-L1) Single-Domain Antibody in SPECT/CT Assessment of PD-L1 Expression in Non-Small Cell Lung Cancer
- Pretreatment 18F-FDG Uptake Heterogeneity Predicts Treatment Outcome of First-Line Chemotherapy in Patients with Metastatic Triple-Negative Breast Cancer
- Noninvasive Imaging of Drug-Induced Liver Injury with 18F-DFA PET
- Comprehensive Computed Tomography Radiomics Analysis of Lung Adenocarcinoma for Prognostication
- Associations Between PET Textural Features and GLUT1 Expression, and the Prognostic Significance of Textural Features in Lung Adenocarcinoma
- The Impact of Optimal Respiratory Gating and Image Noise on Evaluation of Intratumor Heterogeneity on 18F-FDG PET Imaging of Lung Cancer
- Pretreatment 18F-FDG PET Textural Features in Locally Advanced Non-Small Cell Lung Cancer: Secondary Analysis of ACRIN 6668/RTOG 0235
- Texture Feature Ratios from Relative CBV Maps of Perfusion MRI Are Associated with Patient Survival in Glioblastoma
- PET Imaging of Copper Trafficking in a Mouse Model of Alzheimer Disease
- Primary tumour standardised uptake value is prognostic in nonsmall cell lung cancer: a multivariate pooled analysis of individual data
- Impact of Image Reconstruction Settings on Texture Features in 18F-FDG PET
- Multimodal Partial-Volume Correction: Application to 18F-Fluoride PET/CT Bone Metastases Studies
- Visual Versus Quantitative Assessment of Intratumor 18F-FDG PET Uptake Heterogeneity: Prognostic Value in Non-Small Cell Lung Cancer
- Textural Parameters of Tumor Heterogeneity in 18F-FDG PET/CT for Therapy Response Assessment and Prognosis in Patients with Locally Advanced Rectal Cancer
- Predicting Survival in Non-Small-Cell Lung Cancer Using Positron Emission Tomography: Several Conclusions From Multiple Comparisons
- Tumor Texture Analysis in 18F-FDG PET: Relationships Between Texture Parameters, Histogram Indices, Standardized Uptake Values, Metabolic Volumes, and Total Lesion Glycolysis
- Textural Features of Pretreatment 18F-FDG PET/CT Images: Prognostic Significance in Patients with Advanced T-Stage Oropharyngeal Squamous Cell Carcinoma