


Abstract
Mismatch between areas of reduced myocardial blood flow (MBF) and reduced myocardial innervation (defect areas) may be used to estimate the risk for ventricular arrhythmias. The presence of a mismatch zone can be derived using a combined protocol consisting of both an MBF scan and an 11C-meta-hydroxyephedrine (11C-HED) scan. The rate of influx from blood to myocardium (K1) of 11C-HED is proportional to MBF and can potentially be used as an index for defining MBF defects. The aim of this study was to assess whether K1 derived from an 11C-HED scan can be used as an index of MBF, potentially allowing for an assessment of MBF–innervation mismatch areas from a single 11C-HED scan. Methods: Seventeen patients with known ischemic cardiomyopathy underwent dynamic 15O-water and 11C-HED scans. Discrete arterial blood samples were taken during 11C-HED scans for metabolite correction of the image-derived input function. 11C-HED influx rate was obtained using a single-tissue-compartment model and compared with transmural MBF (MBFT), defined as MBF as measured with 15O-water multiplied by perfusable tissue fraction. Defect sizes were obtained from parametric K1 and MBFT images, using 50% of a remote control segment as the cutoff value. Results: There was a significant correlation between MBFT and K1 (y = 0.40x + 0.05 mL·g−1·min−1, r = 0.80, P < 0.001), although K1 was significantly lower than MBFT (slope of the regression line significantly different from 1, P < 0.001). Correlation between MBFT and K1 defect sizes was high (y = 0.89x + 1.38%, r = 0.95, P < 0.001), with no significant difference in mean defect size based on K1 or MBFT (20.9% ± 11.3% and 20.1% ± 10.7% for MBFT and K1, respectively, P = 0.41). Conclusion: 11C-HED influx rate K1 can be used as an alternative to a separate MBF scan for assessing mismatch areas between MBF and myocardial innervation.
There has been long-standing interest in noninvasive imaging of myocardial sympathetic innervation for the prediction of life-threatening ventricular arrhythmias or implantable cardioverter defibrillator discharges using PET (1–5) or SPECT (6–8). It has been shown (9–11) that, in myocardial infarction, the area of reduced innervation often exceeds the area of reduced myocardial blood flow (MBF) (9–14). Furthermore, in a porcine model of myocardial infarction, it has been shown that the occurrence of such MBF–innervation mismatch zones is related to inducible ventricular tachycardias originating from these zones (15). The potential of MBF–innervation mismatch zones in risk assessment has been demonstrated in the recent PAREPET study (16), in which patients developing sudden cardiac arrest had a significantly larger area of viable but denervated myocardium. Therefore, noninvasive imaging for identifying MBF–innervation mismatch zones may play a role in risk stratification of patients with ischemic cardiomyopathy who are considered for cardioverter defibrillator implantation.
MBF–innervation mismatch zones are generally quantified using separate MBF and innervation scans. The use of separate scans, however, has some disadvantages: motion artifacts between scans may occur, overall study duration is prolonged, and radiation dose to the patient is increased. Clearly, a single-scan protocol for defining MBF–innervation mismatches would be preferable.
Recently, it has been shown that the kinetics of 11C-meta-hydroxyephedrine (11C-HED) can be described reliably using a single-tissue-compartment model with corrections for left and right ventricular spill-over (17). The underlying tracer kinetic model has two parameters: K1 and k2, which represent the rate of 11C-HED transfer from blood to myocardium (influx rate) and the rate of transfer from myocardium to blood (clearance rate), respectively. The volume of distribution of 11C-HED, defined as the ratio of K1 to k2, represents net uptake, that is, equilibrium distribution between tissue and plasma, and can be used as a measure of innervation.
K1 is dependent on both the extraction fraction of 11C-HED and MBF. Therefore, if the extraction fraction of 11C-HED is constant across a clinically relevant range of resting MBF levels, changes in 11C-HED K1 would reflect changes in MBF. In this case a single 11C-HED scan could be used to define MBF–innervation mismatch areas.
Therefore, the aim of this study was to assess whether K1 derived from an 11C-HED scan can be used as an index of MBF.
MATERIALS AND METHODS
Patient Population
Seventeen patients (mean age, 67 y; range, 43–80 y; 13 men) with ischemic cardiomyopathy and a left ventricular ejection fraction below 35% based on cardiac MR imaging were included. Ischemic cardiomyopathy was defined as the presence of one or more stenoses of greater than 50% as determined from a coronary angiogram and delayed contrast enhancement on cardiac MR imaging. The study was approved by the Medical Ethics Review Committee of the VU University Medical Center, and all participants gave written informed consent before inclusion.
Scanning Protocol
The patients underwent a dynamic 15O-water scan, followed by an 11C-HED scan in the same session. All studies were performed on a Gemini TF-64 (Philips Healthcare) PET/CT scanner (18).
A 5-mL bolus injection of 370 MBq of 15O-water (0.8 mL·s−1), followed by 35 mL of saline (2 mL·s−1), was administered simultaneously with the start of a list-mode emission scan of 6 min. The injected dose was chosen to remain within the linear range of the scanner, the upper limit of which is at a singles counting rate of about 35 Mcps (19). Maximum singles counting rates in the present study were approximately 32 Mcps during the first pass of the bolus. This PET scan was followed immediately by a respiration-averaged low-dose CT scan (55 mAs; rotation time, 1.5 s; pitch, 0.825; collimation, 64 × 0.625; acquiring 20 cm in 11 s) during normal breathing. The emission scan was reconstructed into 22 frames (1 × 10, 8 × 5, 4 × 10, 2 × 15, 3 × 20, 2 × 30, and 2 × 60 s) using the 3-dimensional row action maximum-likelihood algorithm and applying all appropriate corrections for scanner normalization, dead time, decay, randoms, scatter, and attenuation, with the attenuation correction being based on the corresponding low-dose CT scan. Frames consisted of 45 planes of 144 × 144 voxels with voxels having dimensions of 4 × 4 × 4 mm. The effective radiation dose for a 15O-water study and low-dose CT was estimated as 1.5 mSv.
11C-HED was synthesized as described previously (17). At least 10 min after the end of the 15O-water scan, 370 MBq of 11C-HED were injected as a 5-mL bolus (0.8 mL·s−1) followed by a 35-mL saline flush (2 mL·s−1), simultaneously starting a 60-min list-mode emission scan. After the emission scan, a slow low-dose CT scan was performed to correct for attenuation, similar to the 15O-water scan. Images were reconstructed into 36 frames (1 × 10, 8 × 5, 4 × 10, 3 × 20, 5 × 30, 5 × 60, 4 × 150, 4 × 300, and 2 × 600 s) using the 3-dimensional row action maximum-likelihood algorithm and applying all appropriate corrections. The effective radiation dose for a 11C-HED study and low-dose CT was estimated as 2.5 mSv.
Blood Sampling
Before the scanning session, all patients received an indwelling radial artery cannula for withdrawal of discrete blood samples during the dynamic 11C-HED scan. A total of 7 arterial samples of 7 mL each were collected at 2.5, 5, 10, 20, 30, 40, and 60 min after 11C-HED injection. Blood samples were analyzed for blood and plasma activity concentrations and for radiolabeled plasma metabolites of 11C-HED as previously described (17).
Input Functions
Input functions were obtained using in-house–developed software, Cardiac VUer (20,21). For both 15O-water and 11C-HED, 1-cm-diameter regions of interest were placed over the ascending aorta in at least 5 transaxial image planes in the frame showing the first pass of the injected bolus. These regions of interest were combined into one volume of interest for the ascending aorta. A second set of regions of interest was placed over the right ventricular cavity in 5 transaxial planes, with the region-of-interest boundaries at least 1 cm from the right ventricular wall to avoid spill-over of myocardial activity. Again, these regions of interest were combined into one right ventricular volume of interest. Both volumes of interest were then transferred to the full dynamic images to obtain arterial whole-blood and right ventricular time–activity curves.
Next, for 11C-HED only, plasma–to–whole-blood ratios derived from the manual blood samples were fitted to a sigmoid function. Parent fractions derived from these manual samples were fitted to a sigmoid function. Finally, the parent plasma curve was obtained by multiplying the arterial whole-blood curve by the fitted plasma–to–whole-blood ratio and parent fraction curves.
Segmental Analysis
Sixteen myocardial segments, excluding the most distal apical segment, were drawn manually on short-axis images according to the 17-segment model of the American Heart Association (22), using software developed in-house within Matlab 7 (The MathWorks). For 11C-HED, segments were defined on the final frame of the dynamic images, whereas for 15O-water, parametric images of perfusable tissue fraction (PTF) were used. The obtained segment templates were projected onto all frames of their corresponding short-axis dynamic emission scans to extract segmental time–activity curves. These were fitted to a single-tissue-compartment model for both 15O-water and 11C-HED using standard nonlinear least-squares regression according to Equations 1 and 2 for 15O-water (23) and 11C-HED (17), respectively: Eq. 1
Eq. 1 Eq. 2in which CPET(t), CA(t), CRV(t), and CP(t) represent radioactivity concentrations in tissue, whole blood, right ventricular blood, and parent tracer in plasma, respectively. VA represents left ventricular spill-over and VRV right ventricular spill-over. For 15O-water, total distribution volume VT was fixed to 0.91 mL·g−1 (24), whereas for 11C-HED, VT was calculated as K1/k2.
K1 represents the average 11C-HED influx rate in both perfusable and nonperfusable tissue. However, MBF as measured with 15O-water represents MBF in perfusable tissue alone (25), and the fraction of perfusable tissue is reflected in PTF. To make an appropriate comparison between 11C-HED K1 and MBF as measured with water, MBF was multiplied by PTF to obtain MBF in perfusable and nonperfusable tissue, or transmural MBF (MBFT).
Parametric Images
For 15O-water, parametric images were generated using a basis function implementation (20,26,27) of the single-tissue-compartment model (Eq. 1) with corrections for blood volume, spill-over (23), and PTF (28). One hundred basis functions were used with exponentially spaced values of MBF/VT between 0.1 and 2.5 min−1. For 11C-HED, a basis function implementation of Equation 2 was used, applying 100 basis functions with exponentially spaced values of k2 between 0.002 and 0.1 min−1 and corrections for left and right ventricular spill-over. For 11C-HED, parametric images of VT were obtained by dividing parametric images of K1 by parametric images of k2.
For both 11C-HED and 15O-water, parametric images of anatomic tissue fraction were generated according to Equation 3: Eq. 3in which CTnorm represents the normalized low-dose CT scan and 1.06 represents the density of blood. In voxels with VA+VRV > 0.75, VA or VRV > 0.60, or anatomic tissue fraction < 0.25, MBF, K1, and VT were set to zero to avoid spurious noise–induced high values outside the heart or in blood vessels as described previously (20,29). Finally, MBFT images were obtained by multiplying MBF images by PTF images.
Data Analysis
Correlation between MBFT and K1 was assessed using linear regression. For each patient, 4 adjacent segments were selected and used as a control region. These segments did not border infarct segments and showed normal innervation (VT). If scar and denervation sizes were too large to identify 4 such segments, at least 2 adjacent segments were used instead. For both MBFT and K1, defect size was defined as the percentage of pixels below a percentage (between 20% and 80%, in increments of 5%) of the average of the control region. Similarly, parametric VT images were obtained and used to define innervation defects using the same control region. MBF–innervation mismatch sizes were obtained by subtracting the K1 or MBFT defect size from the VT defect size. To avoid differences in volume-of-interest definition between 11C-HED and 15O-water scans, defect sizes were assessed for the entire left ventricle rather than for each segment individually. Correlation and agreement between defect sizes were assessed using linear regression, Bland–Altman analysis, and paired t tests using Matlab 7. Finally, the Dice similarity coefficient (DSC) was calculated for the polar maps to quantify agreement in both defect location and size.
RESULTS
The scans of 2 patients had visually identifiable motion and were excluded from further analysis. For the remaining 15 patients, the correlation between absolute MBFT and K1 is presented in Figure 1. There was a significant correlation between MBFT and K1 (y = 0.40x + 0.05 mL·g−1·min−1, r = 0.80, P < 0.001), indicating that the extraction fraction of 11C-HED is relatively constant across the range of MBFT values encountered. The slope of the regression line was significantly lower than 1 (P = 0.02), and the intercept was significantly different from 0 (P < 0.001).

Correlation between K1 of 11C-HED and absolute MBFT on heart segment level. This correlation was significant (r = 0.80, P < 0.001). Slope of regression line was 0.40, which was significantly lower than 1 (P < 0.001). Intercept was 0.05, which was significantly different from 0 (P < 0.001).
For all relative cutoff values, Table 1 shows the correlations, slopes and intercepts of the regression lines, P values of paired t tests, and average DSC. For cutoffs between 30% and 70%, an excellent correlation (r ≥ 0.90) was found and slopes of the regression lines were not significantly different from unity, except for the 35% cutoff value. DSC was above 0.80 for all except an 80% cutoff.
Comparison of Defect Sizes Based on 11C-HED Influx Rate K1 and MBFT as Measured with 15O-Water
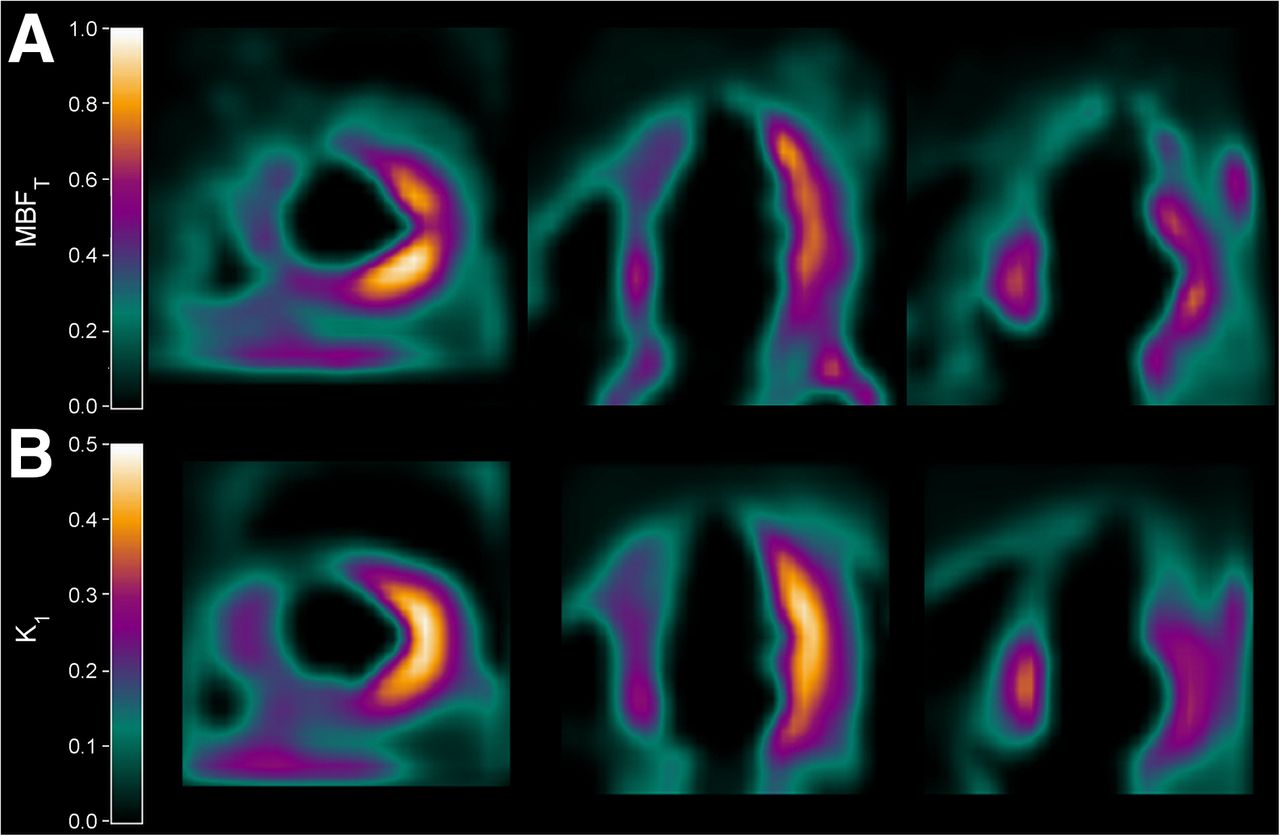
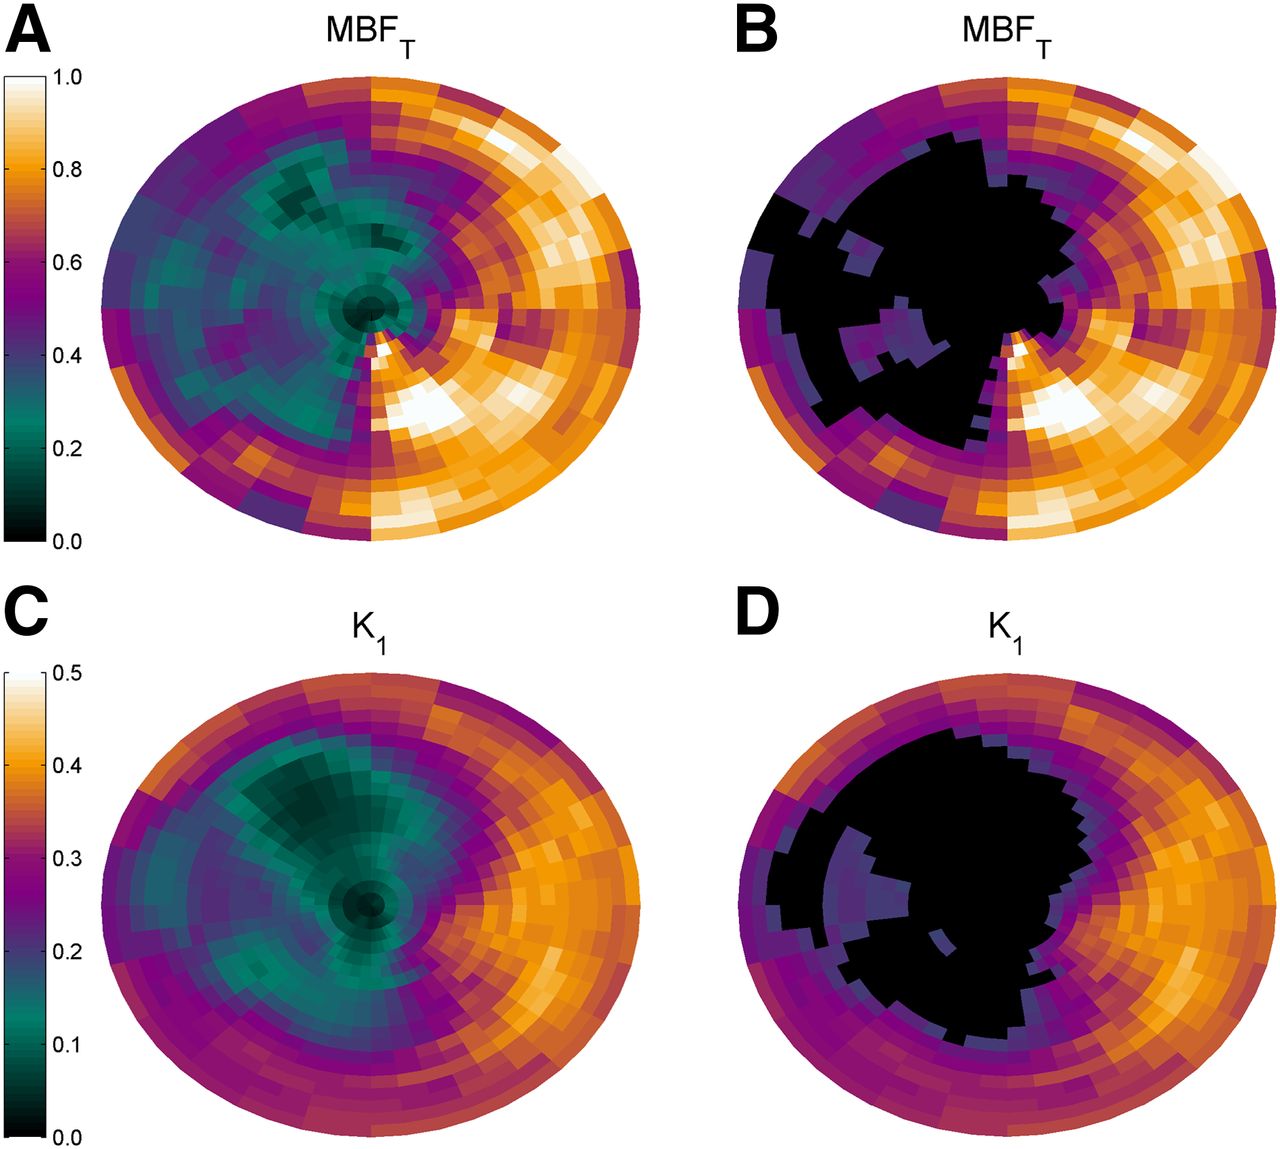
Typical examples of parametric MBFT and K1 images are presented in Figure 2, showing reduced MBFT and K1 in the territory of the left anterior descending artery. Corresponding polar plots are shown in Figure 3. The correlation between defect sizes was high (y = 0.89x + 1.38%, r = 0.95, P < 0.001), as shown in Figure 4 using a 50% cutoff. The slope of the regression line was not significantly different from 1 (P = 0.24), and the intercept of the regression line was not significantly different from 0 (P = 0.50). A paired t test showed that defect sizes based on K1 were not significantly different from those based on MBFT (P = 0.41). In addition, when the regression line was forced through the origin, the slope was 0.95, which was not significantly different from 1 (P = 0.20). DSC (0.88 ± 0.05; range, 0.77–0.96) showed good agreement between MBFT and K1 at the polar map level, indicating that defect locations were similar. Figure 5 shows the correlation between mismatch sizes derived using MBFT and K1. A high correlation between mismatch sizes was found (y = 0.89x + 2.2%, r = 0.92, P < 0.001), with slope and intercept not being significantly different from 1 (P = 0.32) and 0 (P = 0.21), respectively. In addition, paired t testing showed that mismatch sizes were not significantly smaller for K1 than for MBFT (20.9% ± 11.3% and 20.1% ± 10.7% for MBFT and K1, respectively, P = 0.41).

Typical example of parametric images of MBFT (top) and K1 (bottom) of patient with myocardial infarct in anterior, septal, and apical walls.

Polar maps of MBFT and K1 of same patient as in Figure 2. Total defect size, indicated by black areas in B and D, was 28.7% based on MBFT and 27.0% based on K1. DSC was 0.87.
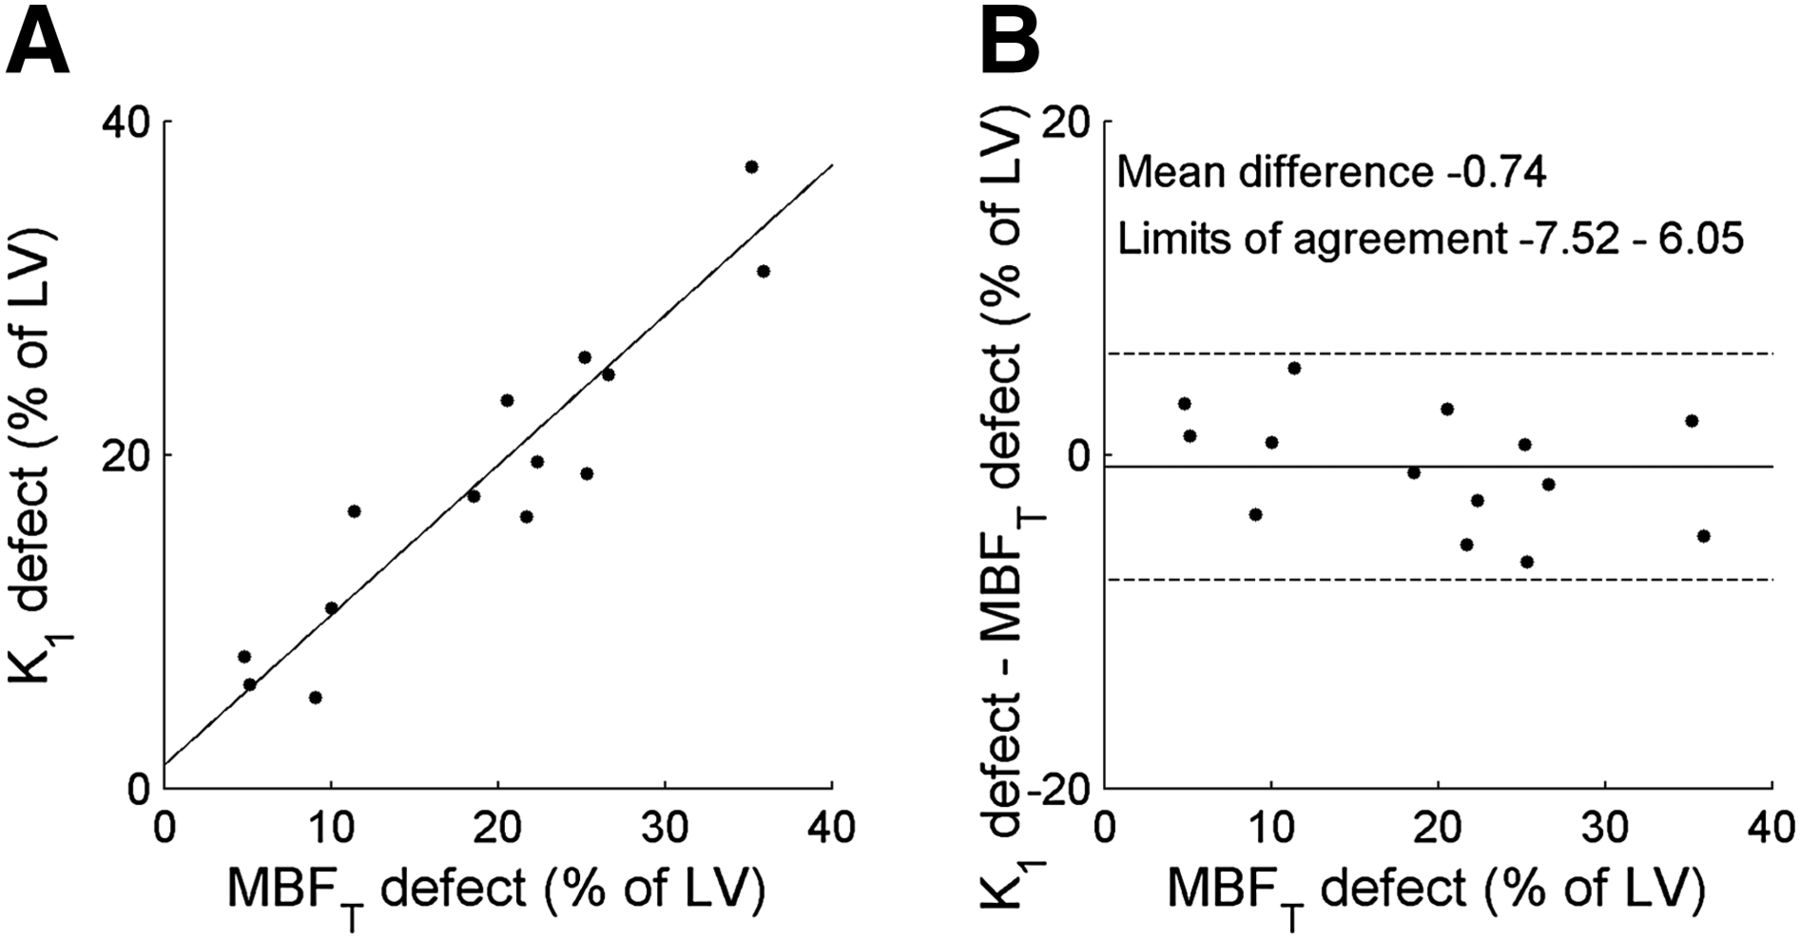
Correlation (left) and Bland–Altman (right) plots of defect size based on MBFT and K1. Slope of regression line was 0.89, which was not significantly different from 1 (P = 0.24). Intercept was 1.38, which was not significantly different from 0 (P = 0.50). No significant correlation was found on Bland–Altman analysis (P = 0.21). LV = left ventricle.
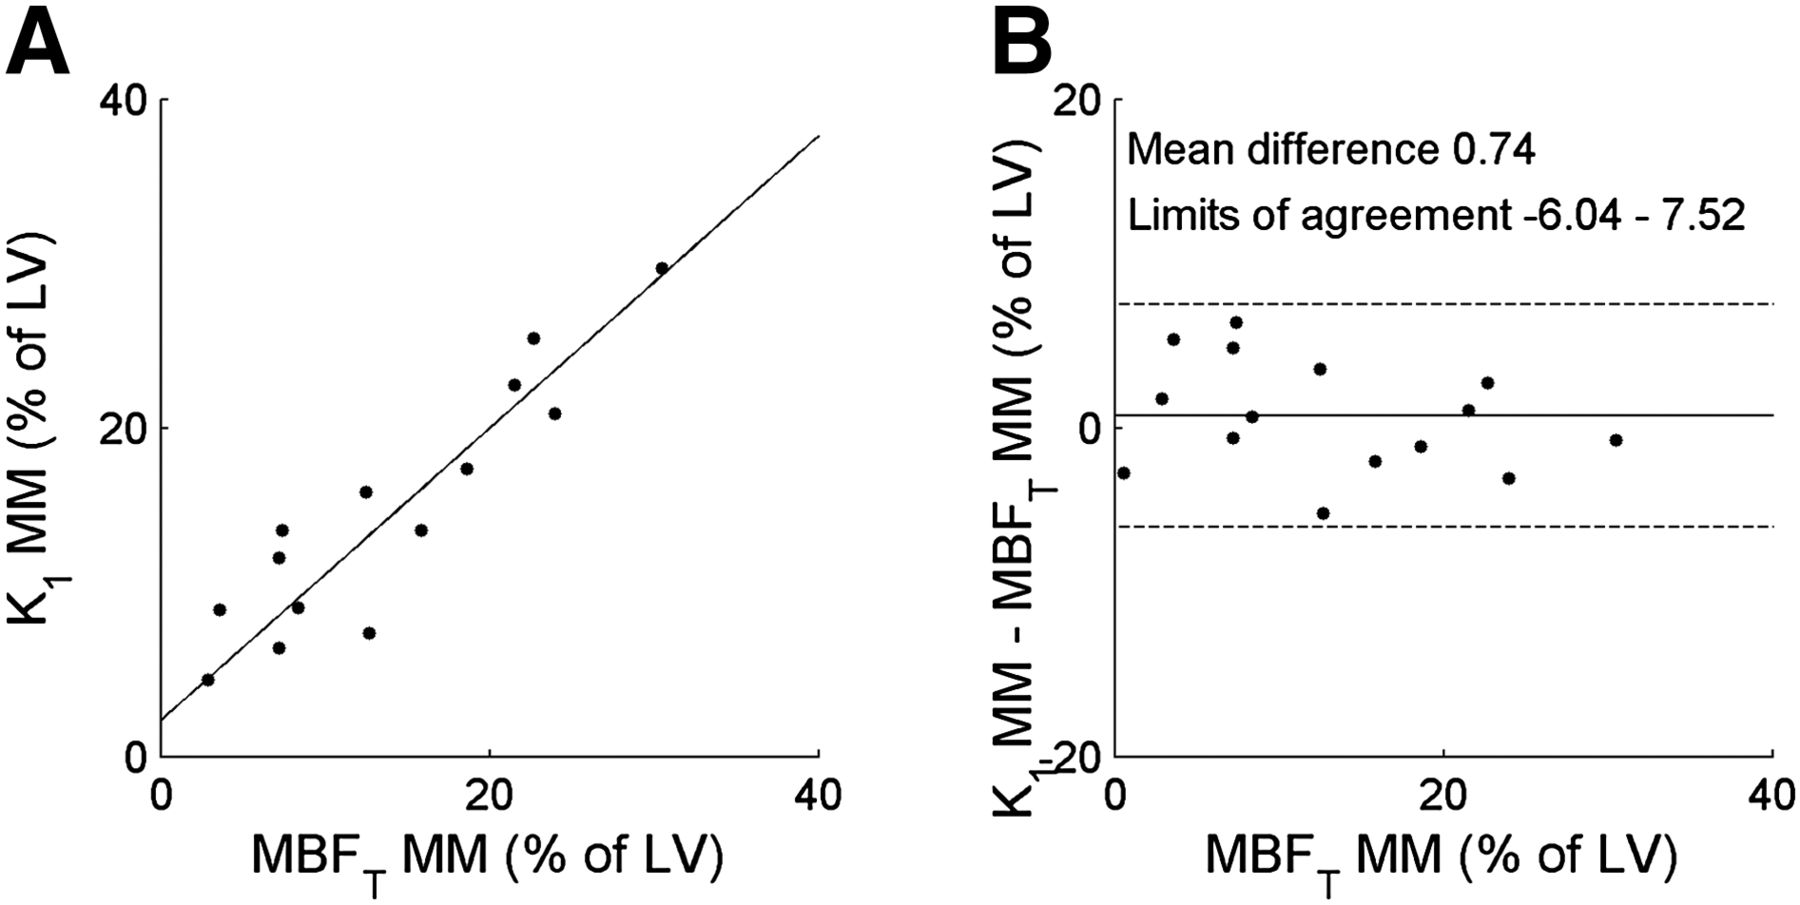
Correlation (left) and Bland–Altman plot (right) of mismatch size based on MBFT and K1. Slope of regression line was 0.89, which was not significantly different from 1 (P = 0.32). Intercept of regression line was 2.20, which was not significantly different from 0 (P = 0.21). No significant correlation was found on Bland–Altman analysis (P = 0.29). LV = left ventricle; MM = mismatch.
DISCUSSION
In the present proof-of-concept study, a method to assess MBF–innervation mismatch size from a single 11C-HED scan was studied, using the influx rate K1 of 11C-HED to obtain an index of MBF rather than measuring MBF separately using an additional 15O-water scan. Shortening the scanning protocol reduces the risk of motion and total radiation burden. In addition, patient throughput is increased while the method still provides accurate data on mismatch areas.
Direct comparison between K1 and MBFT showed that K1 significantly underestimated MBFT, suggesting that the extraction of 11C-HED is about 40%–50%. However, relative cutoff values compared with remote control segments (15,16) were used to define defect areas, and a consistent underestimation of K1 as compared with MBFT was expected to play a limited role in definition of defect areas. This was indeed confirmed in our study as illustrated by the excellent correlation between defect sizes obtained with K1 and MBFT. In addition, the slope of the regression line was not significantly different from 1, Bland–Altman analysis showed no significant differences between the two defect sizes, and paired t tests showed no significant differences, indicating the potential of using K1 instead of MBFT for mismatch assessment. However, the limited extraction of 11C-HED rules out use of 11C-HED as a tracer of absolute MBF.
This study focused on the use of 50% of a healthy reference region as a cutoff value for both MBFT and K1. Because the optimal method for defining patient-specific cutoff values is as yet unknown, a value of 50% may not be optimal. Therefore, this study included relative cutoff values between 20% and 80% of the value of a healthy reference region (Table 1). For 20%–25% and for 75%–80%, correlation was reduced to an r value of below 0.90, and for cutoffs of 20%–25% and 35%, the slopes of the regression lines started to deviate significantly from unity. However, for the range of 30%–60%, both correlation coefficients and slopes were comparable with the results obtained when a 50% cutoff value was used. In addition, paired t tests showed no significant difference for any of the assessed cutoff values. This indicates that defect areas for K1 and MBFT are similar for a wide range of relative cutoff values for differentiating between healthy and defect tissue. In addition, for different cutoff values, average DSC for all patients was slightly lower at increased cutoffs. However, average DSC was above 0.80 for all cutoff values studied, except for 80%. The optimal cutoff value or a method to define defect areas for both blood flow and innervation has to be defined in larger clinical studies with long-term follow-up. This method might also be different when using relative uptake images (15,16) or fully quantitative parameters, and more clinical studies are warranted.
In this study, 11C-HED K1 was compared with the product of MBF and PTF because MBF derived from a 15O-water scan represents MBF in perfusable tissue whereas 11C-HED K1 represents the transmural rate of influx, that is, in both perfusable and nonperfusable tissue within a region. Assuming no influx of 11C-HED in nonperfusable tissue, uptake signal is reduced in direct proportion to the fraction of nonperfusable tissue. However, MBF derived from 15O-water is calculated using washout rates, and since nonperfusable tissue has no uptake of 15O-water, it does not contribute to the observed washout rate of 15O-water. This results in differences between MBF and 11C-HED influx rate K1 in regions with both perfusable and nonperfusable tissue. Since the fraction of perfusable tissue is routinely calculated as PTF, the product of MBF and PTF should resemble total (transmural) MBF in these regions. It is therefore appropriate to compare 11C-HED K1 with MBFT.
The results of this study are in contrast to those of Rimoldi et al. (30), in which no correlation between MBF and 11C-HED K1 was found in dogs. There are, however, two major differences between the studies. First, in the present study, 11C-HED K1 was compared with the product of MBF and PTF, that is, transmural MBF, whereas Rimoldi et al. used regular MBF as obtained with 15O-water. Comparing MBF with K1 may be inappropriate and yield inaccurate results. To illustrate this, in the present study the correlation between regular nontransmural MBF and 11C-HED K1 was significantly lower, although still significant, with an r value of 0.67. Second, the range of MBF values in the present study was much larger than that of Rimoldi et al., as only patients with ischemic cardiomyopathy, and hence myocardial infarctions and large heterogeneities in MBF, were included. The dogs used by Rimoldi et al. showed regions of denervation but no infarctions, and therefore the range of MBF values was relatively small.
This study had several limitations. First, the number of subjects was relatively small (n = 17) and larger studies might be required before definitive omission of separate MBF scans can be advocated. In addition, the scans of 2 patients (12%) had to be excluded because of visually identifiable motion, and more subtle motion in the remaining patients cannot be excluded. Finally, a large-scale clinical validation is required before any conclusions regarding the application of mismatch zones from 11C-HED alone can be drawn.
CONCLUSION
The rate of influx (K1) of 11C-HED can be used as a potential alternative to a separate MBF scan when assessing mismatch size between MBF and innervation in patients with ischemic cardiomyopathy. This alternative reduces scan duration, radiation dose, and risk of patient motion between scans, but the clinical utility of this mismatch size requires further clinical validation in larger patient cohorts before the method can be used.
DISCLOSURE
The costs of publication of this article were defrayed in part by the payment of page charges. Therefore, and solely to indicate this fact, this article is hereby marked “advertisement” in accordance with 18 USC section 1734. This work was supported financially by Philips Healthcare. No other potential conflict of interest relevant to this article was reported.
Acknowledgments
We thank Amina Elouahmani, Femke Jongsma, Judith van Es, Nazerah Sais, Nghi Pham, Robin Hemminga, and Suzette van Balen for scanning of the patients; Henri Greuter, Kevin Takkenkamp, and Marissa Rongen for production of 15O-water and blood analysis; and Martien Mooijer, Jonas Eriksson, Anneloes Rijnders, Rolf van Kooij, and Johan van den Hoek for synthesis of 11C-HED.
Footnotes
Published online Jul. 30, 2015.
- © 2015 by the Society of Nuclear Medicine and Molecular Imaging, Inc.
REFERENCES
- Received for publication January 13, 2015.
- Accepted for publication July 16, 2015.


Jump to section
Related Articles
Cited By...
- MR/PET Imaging of the Cardiovascular System
- Impaired Myocardial Sympathetic Innervation Is Associated with Diastolic Dysfunction in Heart Failure with Preserved Ejection Fraction: 11C-Hydroxyephedrine PET Study
- Automatic Extraction of Myocardial Mass and Volume Using Parametric Images from Dynamic Nongated PET
- Noninvasive Quantification of Myocardial 11C-Meta-Hydroxyephedrine Kinetics
- Myocardial Blood Flow and Innervation Measures from a Single Scan: An Appealing Concept but a Challenging Paradigm