


Abstract
Quantification of myocardial perfusion reserve (MPR) is an emerging topic in nuclear cardiology with an expected diagnostic and prognostic incremental value, especially for patients with severe coronary artery disease. The advent of new dedicated solid-state cameras has opened new perspectives for perfusion quantitation in SPECT. We appraised the feasibility of perfusion reserve estimation using a cadmium zinc telluride camera in a cohort of multivessel patients and its pertinence with respect to angiographic data. Methods: Twenty-three patients with known multivessel coronary artery disease were prospectively enrolled. Dynamic SPECT acquisitions using 99mTc-tetrofosmin at rest and after vasodilator stress were performed using a dedicated cadmium zinc telluride camera. Reconstructed frames were automatically segmented to extract the vascular input function and the myocardial uptake curve. One-compartment kinetic modeling was used to estimate global and regional uptake values, and then myocardial blood flow was derived using the Renkin–Crone equation. Global and regional MPR was assessed using flow difference (stress − rest) and flow ratio (stress/rest). All patients underwent control coronary angiography within 4 wk, which served as the reference for MPR index assessment. Relevant angiographic findings included maximal stenosis and (for a subgroup of 26 vessels) invasive measurement of fractional flow reserve (FFR). A stenosis was considered obstructive if greater than 50% and an FFR abnormal if lower than 0.8. Results: Global MPR correlated well with number of obstructed vessels (P < 0.001). After multivariate analysis, both regional flow ratio and flow difference were significantly associated with maximal stenosis (P < 0.001) and FFR (P < 0.001). Regional MPR indices were significantly different in obstructed and nonobstructed vessels (P < 0.001) and in vessels with normal and abnormal FFR (P < 0.001). With a cutoff of 2, the sensitivity, specificity, and accuracy of regional flow ratio were, respectively, 80%, 85%, and 81% for the detection of obstructed vessels and 89%, 82%, and 85% for the detection of abnormal FFR. Conclusion: Scintigraphic estimations of global and regional MPR in multivessel patients using a cadmium zinc telluride camera appear to correlate well with invasive angiographic findings, including maximal stenosis and FFR measurements.
- multivessel coronary artery disease
- myocardial perfusion reserve
- dynamic SPECT
- CZT camera
- fractional flow reserve
Because of its wide availability, noninvasiveness, and high diagnostic performance, myocardial perfusion imaging (MPI) using SPECT has become of common practice for coronary artery disease (CAD) screening, characterization, and follow-up (1,2). The standard semiquantitative approach based on the analysis of reversible perfusion defects between stress and rest images has excellent sensitivity and negative predictive value for ischemic lesion detection (3). However, because of the relative nature of the reconstructed activity maps, this approach may underestimate the extent of the disease, particularly in patients with balanced multivessel CAD (4,5). Quantitative perfusion assessment in terms of myocardial flow or myocardial perfusion reserve (MPR), a measure of coronary vasodilator capacity (6), has already been developed using cardiac PET with various tracers such as 82Rb (7) and shown to provide incremental diagnostic and prognostic information (8–10). Still, since PET tracer production requires high start-up costs, PET flow imaging has not been embraced by many health care systems to date, and SPECT with 99mTc-labeled tracers remains the clinical standard for MPI worldwide. SPECT perfusion quantitation has long been hampered by the difficulty of achieving dynamic acquisitions using classic Anger cameras. With the advent of novel solid-state detectors with improved sensitivity (11,12) allowing list-mode recording and multiframe dynamic reconstructions with sufficient temporal resolution, MPR estimation has become feasible (13). Recent results reported a good correlation between global MPR and CAD severity expressed as stress total perfusion deficit (TPD). Global and regional MPR were also predictive of the extent of CAD as assessed angiographically (14).
Invasive fractional flow reserve (FFR) measurement is performed during coronary catheterization using a pressure sensor and is defined as the ratio of hyperemic pressure downstream from the lesion to mean aortic pressure. FFR is an index of the functional significance of a coronary stenosis and has been shown to improve outcome when considered to guide revascularization in patients with multivessel CAD (15,16).
The aim of the present study was to evaluate the feasibility of MPR estimation in routine clinical settings using a cadmium zinc telluride camera in a cohort of multivessel patients and to assess its pertinence with respect to the results of coronary angiography in terms of maximal stenosis and FFR.
MATERIALS AND METHODS
Study Population
The study was conducted from January 2014 to March 2015 at Montpellier University Hospital, France. It was designed as an ancillary study to the FUTURE cohort evaluating the place of FFR measurements in therapeutic decision making. Twenty-three patients were prospectively enrolled and included in the analysis. All patients had been diagnosed with multivessel CAD during a scheduled coronary angiography 2 d to 6 wk before MPI and were referred to the nuclear medicine department for assessment of myocardial ischemia before revascularization. The study was approved by the local ethics committee. All procedures were in accordance with institutional guidelines, and a requirement for individual informed consent was waived. The clinical and anthropomorphic characteristics documented using the patient’s record were sex, age, body mass index, and cardiovascular risk factors (diabetes, hypertension, dyslipidemia, smoking, and personal or familial history of CAD).
Myocardial Perfusion SPECT Protocol
Patients were imaged using a solid-state dedicated cardiac camera (Discovery NM530c; GE Healthcare). They refrained from caffeine- and methylxanthine-containing substances and drugs for at least 24 h before their scans. All patients underwent a 1-d rest–stress protocol. MPI was performed at rest and at peak vasodilator stress using 99mTc-tetrofosmin (Fig. 1). To enable positioning of the heart in the field of view, a test dose of 99mTc-tetrofosmin (35–60 MBq) was first injected at rest for a prescan of 60 s. Concomitant with intravenous bolus administration of the resting 99mTc-tetrofosmin dose (185–220 MBq), a list-mode acquisition was started for 6 min. With the patient positioned in the scanner, pharmacologic stress was then induced using a 0.75 mg/kg intravenous infusion of dipyridamole over 4 min (17). At peak vasodilation, a second dose of 99mTc-tetrofosmin (645–730 MBq) was injected and 6 min of list-mode data recording was started at the time of injection. The average effective dose per patient was 8.4 mSv (18).
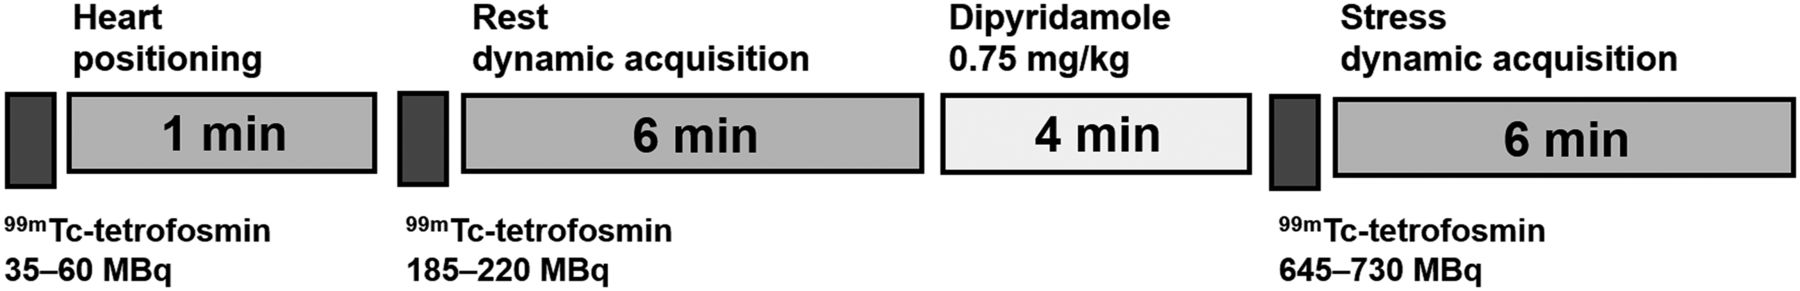
Myocardial perfusion SPECT workflow.
MPR Quantification
List-mode dynamic acquisition data were reformatted and reconstructed into 48 frames. The frame duration was 3 s for the first 30 frames and 15 s for the last 18 frames (Supplemental Fig. 1; supplemental materials are available at http://jnm.snmjournals.org). Images were reconstructed using maximum a posteriori expectation maximization (19) following the manufacturer specifications (30 iterations, α = β = 0.4, Butterworth postprocessing filter with order of 10 and cutoff frequency of 0.4/cm), without correcting for attenuation or scatter. Rest and stress reconstructed images were processed using in-house software (Supplemental Fig. 2). The myocardial region of interest was automatically segmented on the summed image corresponding to the last 4 min. An ellipsoid was fitted to the myocardial wall and then adaptively dilated with a spheric structuring element of radius 5 mm. The valve plane was manually adjusted. The voxels inside the ellipsoid and above the valve plane but outside the myocardial region of interest (ROI) were assigned to the vascular (left ventricular) ROI, whose time–activity curve served as the input function in kinetic analysis. Residual activities from the positioning dose (on rest images) and rest injection (on stress images) were corrected using the early images before the first pass of the tracer bolus. The global myocardial ROI was divided into 3 regional ROIs corresponding to main coronary territories (left anterior descending coronary artery, right coronary artery, and left circumflex coronary artery), using the standard 17-segment polar map (20). Regional and global time–activity curves were fitted to a kinetic model using a weighted linear least-squares method to estimate tracer exchange rates and spill-over coefficients. A 1-compartment model was implemented that takes into account tracer uptake (K1) and washout. Regional and global myocardial flows were derived from the corresponding K1 values using the Renkin–Crone equation for tetrofosmin (21,22).
To minimize potential bias arising from differential photon attenuation between vascular and myocardial activities, an original technique was implemented for the normalization of rest and stress arterial input functions (AIFs). The rest AIF was normalized so that the global rest flow was equal to 1 mL⋅g−1⋅min−1, which is easily achievable because multiplying the vascular time–activity curve by a constant amounts to dividing K1 by the same constant. The assumption seems acceptable because rest flow is not expected to vary much from one individual to another and 1 mL⋅g−1⋅min−1 is a commonly accepted reference value in the elderly (10,23–25). The stress AIF was normalized using the same normalization coefficient as the rest AIF, postulating that the degrading factors were similar under rest and stress conditions. Myocardial flows were also computed using the standard approach without normalization.
MPR was assessed using 2 indices: flow difference (stress flow – rest flow, in mL⋅g−1⋅min−1) and flow ratio (stress flow/rest flow, dimensionless). Cutoff values were set at 2 for normal flow ratio (10) and 1 mL⋅g−1⋅min−1 for normal flow difference. Standard semiquantitative analysis was also performed using QPS/QGS software based on a late stationary image corresponding to the last 4 min of the dynamic acquisition (20). Global and regional TPD, reflecting the extent and severity of the perfusion defect, was computed. A global TPD score of 5% or greater was defined as abnormal, and fixed defects were defined as a global TPD stress – TPD rest score of 3% or less. Left ventricular ejection fractions and end-diastolic volumes at stress were also computed. All the scintigraphic images were processed and interpreted blind to the angiographic data.
Reference Coronary Angiography
All patients underwent control coronary angiography within 4 wk (5 ± 8 d) after MPI, which was considered the reference examination for further assessment of MPR estimations. Each of the 3 coronary vessels was characterized by maximal stenosis (0% = free; 25% = nonsignificant; 50% = intermediary; 60% = significant; 80% = very tight; 95% = subocclusive; 100% = occlusive). A vessel was considered obstructed if its maximal stenosis was strictly greater than 50%.
For 12 patients (determined by randomization inside the FUTURE cohort) and 26 vessels, invasive FFR measurements were performed as follows. A guidewire with a mounted pressure sensor (St. Jude Medical) was placed across the lesion. To induce a maximal hyperemic vascular response, 1 mg of isosorbide dinitrate and 150 μg of adenosine were injected into the studied artery. Under conditions of maximum hyperemia, aortic pressure and distal coronary pressure were simultaneously recorded. FFR was calculated as the ratio of hyperemic mean distal coronary pressure to mean aortic pressure. An FFR lower than 0.8 was considered abnormal (15,16).
Statistical Analysis
Continuous values are given as mean ± SD and eventually as median followed by interquartile range in brackets for the sake of comparison with previous studies. Categoric variables are described as number followed by percentage in parentheses. Correlation between quantitative variables was assessed using the Pearson coefficient and the Student t test. Independent distributions were compared using the Mann–Witney U test. A 2-sided P value smaller than 0.05 was regarded as statistically significant. To evaluate the independent predictors of MPR indices, forward-stepwise linear regression was performed with an entry criterion of P < 0.1 and a removal criterion of P > 0.05. The tested predictors were the number of obstructed vessels (for global MPR), maximal stenosis or FFR (for regional MPR), age, sex, body mass index, number of cardiovascular risk factors, stress TPD, stress LVEF, and stress EDV.
The intrainterpreter reliability was assessed using type 1 intraclass correlation coefficients, which were 94% for global MPR indices and 92% for regional MPR indices.
RESULTS
The clinical and anthropometric characteristics of the study population and the results of the semiquantitative analysis of SPECT data are summarized in Table 1. The results of standard semiquantitative analysis were abnormal in 21 (91%), with 10 (43%) having reversible perfusion defects and 11 (48%) having fixed perfusion defects.
Clinical and SPECT Characteristics of Study Population (n = 23)
Global and regional kinetic parameters, myocardial blood flow, and perfusion reserve estimates resulting from the processing of the dynamic SPECT images are detailed in Table 2. The corrective factor for the normalization of the AIFs amounted to 1.49 ± 0.35 (range, 1.00–2.40). Mean rest and stress flows amounted, respectively, to 2.58 and 4.01 mL⋅g−1⋅min−1 using the standard approach and 1 and 1.96 mL⋅g−1⋅min−1 using the normalization technique described above. The sequel of this section focuses on the results obtained using the AIF normalization technique. The results obtained using the conventional approach (without normalization) are not detailed for the sake of concision. Their pertinence in terms of correlation with angiographic findings was highly similar.
Global and Regional Kinetic Parameters and MPR Indices
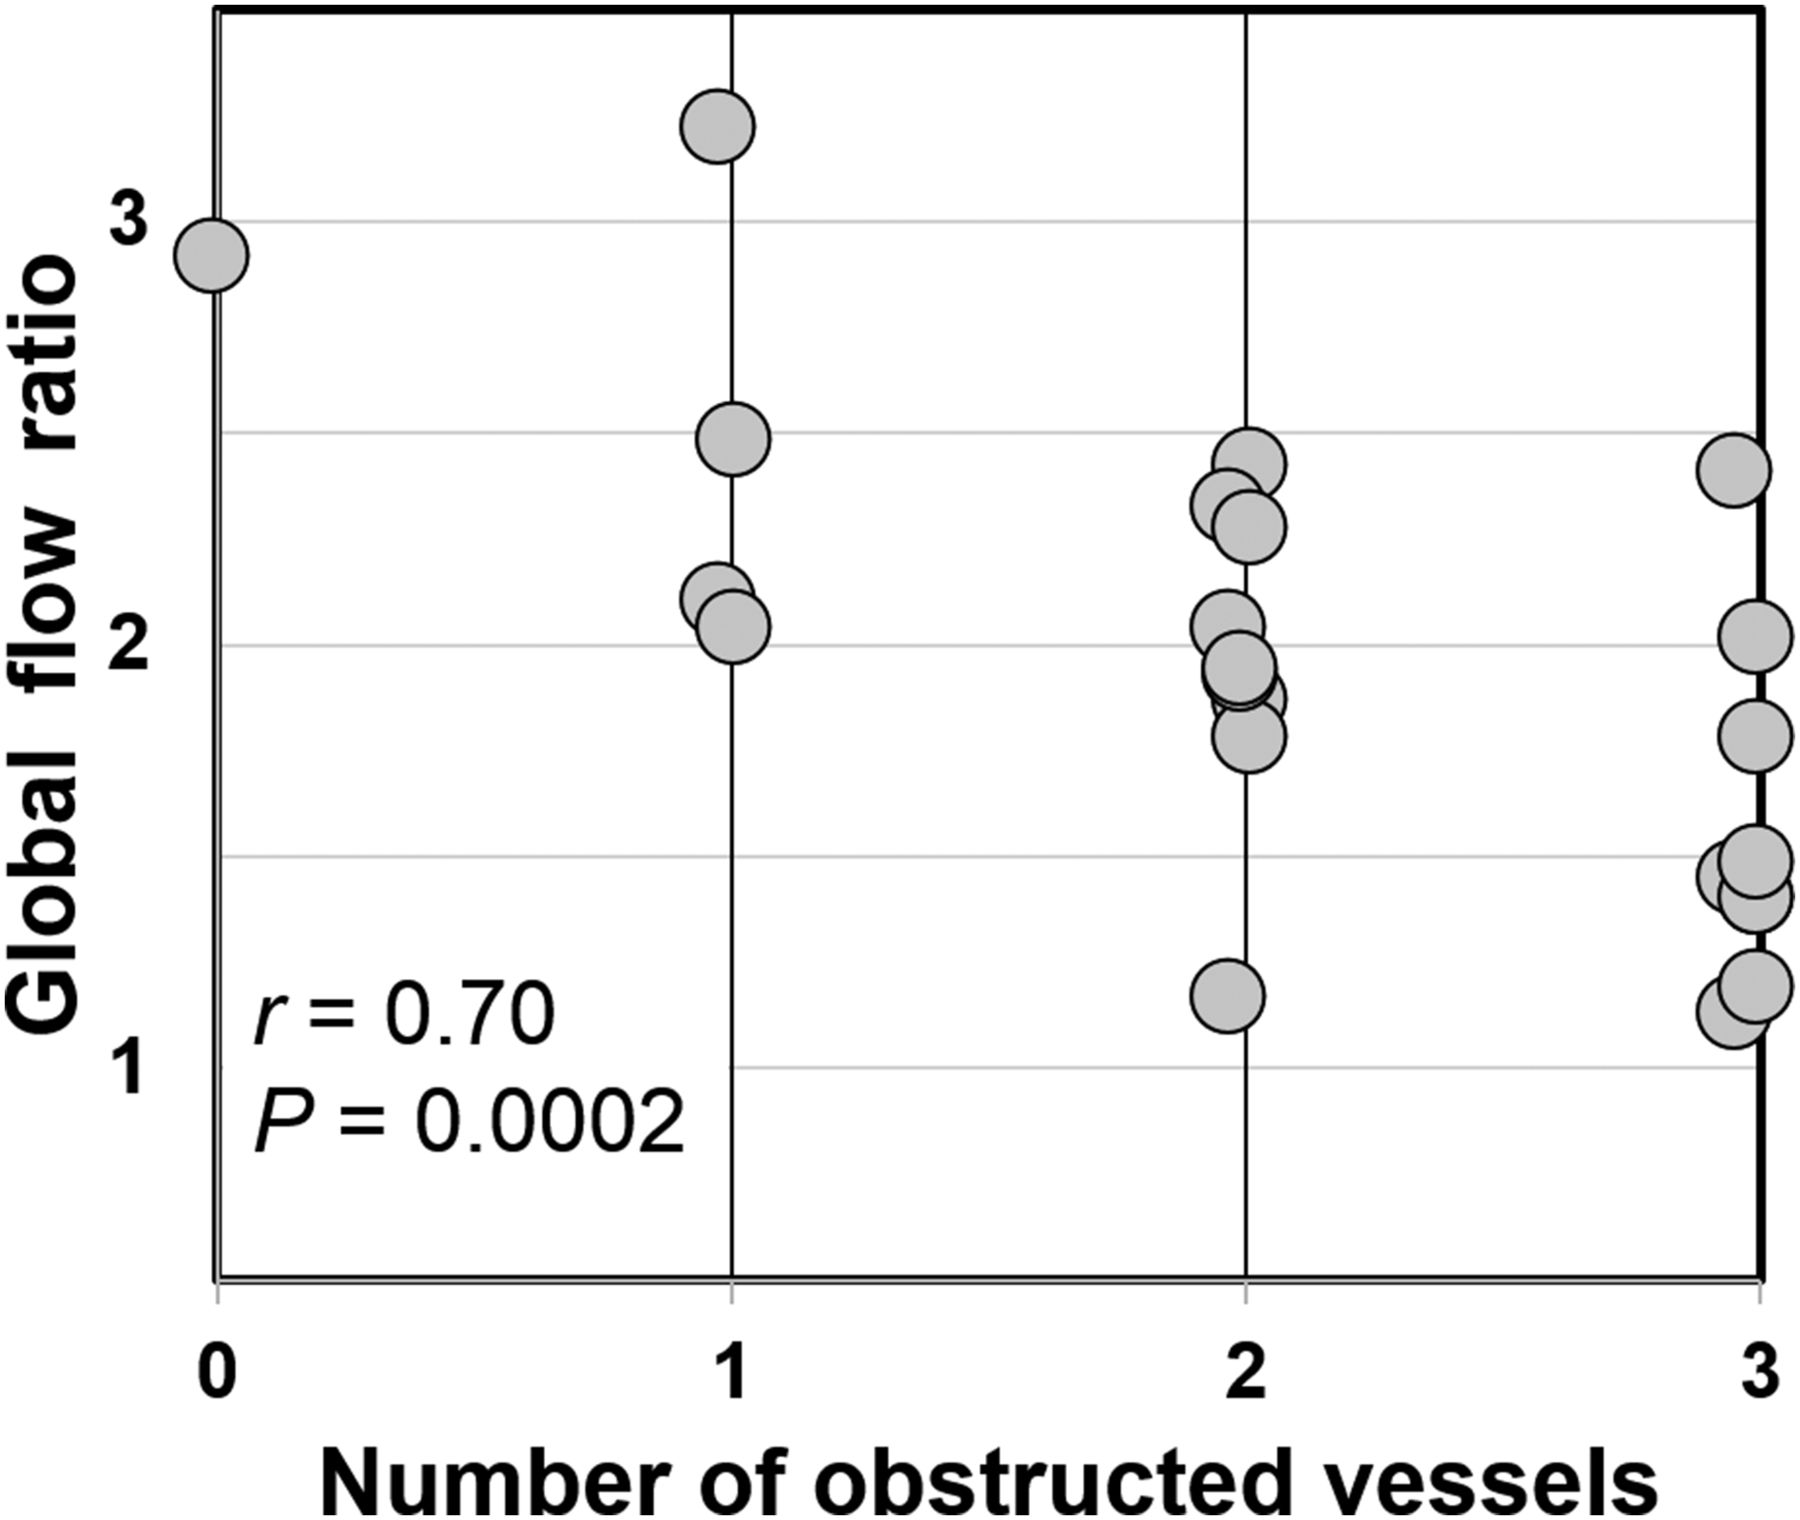
Multivariate regression analysis revealed that the number of obstructed vessels was the sole significant predictor for global MPR (r = 0.70; P < 0.001) (Fig. 2). Furthermore, flow ratio was significantly reduced in patients with (n = 9) 3-vessel CAD compared with those without (n = 14) 3-vessel CAD (1.57 ± 0.41 vs. 2.17 ± 0.50; P = 0.01) whereas stress global TPD and left ventricular ejection fraction were not.

Correlation between global flow ratio and number of obstructed vessels.
Regional MPR indices were first compared with angiographic findings in terms of maximal stenosis. Multivariate regression analysis showed a statistically significant association of both flow difference and flow ratio with age (P = 0.02). Sex, body mass index, stress TPD, left ventricular ejection fraction, and end-diastolic volume were not significant predictors. The correlation with maximal stenosis (Fig. 3 and Supplemental Fig. 3) was highly significant for both flow ratio (r = 0.51; adjusted P < 0.001) and flow difference (r = 0.47; adjusted P < 0.001). Regional MPR indices were significantly lower in obstructed (n = 49) vessels than in nonobstructed (n = 20) vessels (Fig. 4), both in terms of flow difference (0.71 ± 0.54 vs. 1.40 ± 0.71 mL⋅g−1⋅min−1; P < 0.001) and flow ratio (1.72 ± 0.52 vs. 2.51 ± 0.66; P < 0.001). Flow ratio was a slightly better predictor of vessel obstruction than flow difference according to the respective c-statistics (i.e., area under the receiver-operating-characteristic curve [ROC AUC]) of 0.85 and 0.78. By comparison, the ROC AUC of regional stress TPD was 0.55. The diagnostic performance in terms of sensitivity, specificity, and accuracy was, respectively, 80%, 85%, and 81% for flow ratio with a cutoff of 2 and 76%, 60%, and 71% for flow difference with a cutoff of 1 mL⋅g−1⋅min−1.
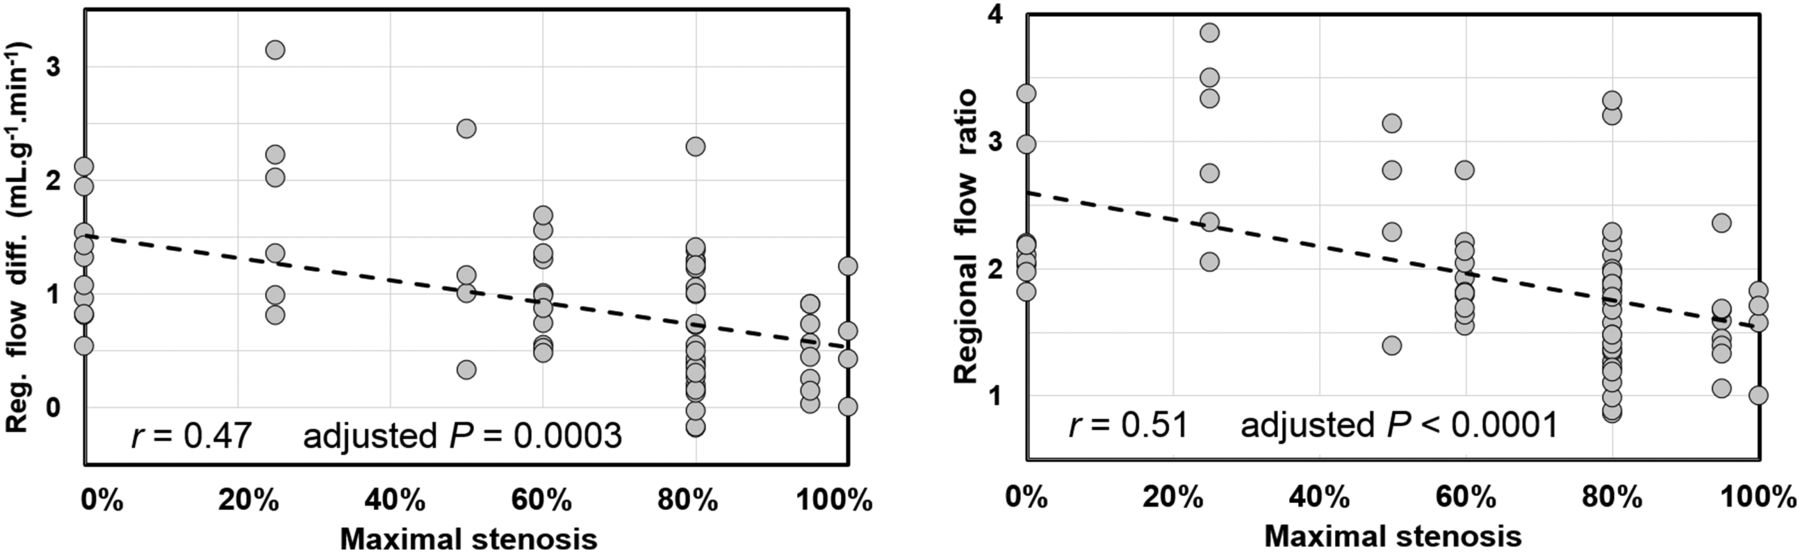
Correlation between regional MPR indices and maximal stenosis.

Regional MPR indices in obstructed vessels (n = 49) and nonobstructed vessels (n = 20). On right are ROC curves (circles stand for optimal cutoffs). Boxes = interquartile range; whiskers = mean ± 1.5 SDs.
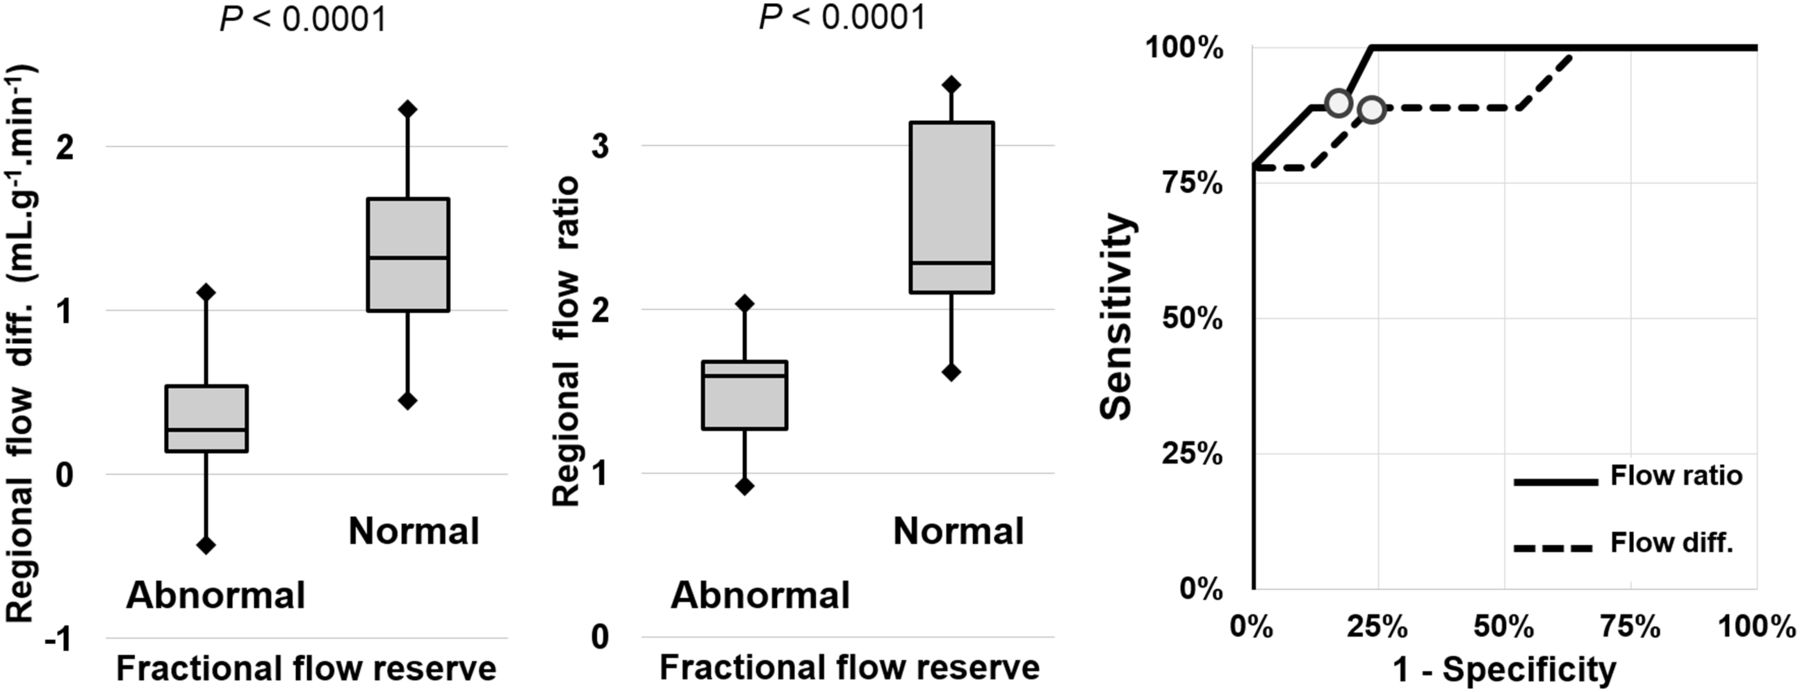
Regional MPR indices were then compared with FFR in the subgroup of 26 vessels for which FFR measurements were available. After multivariate regression analysis, FFR remained a highly significant predictor for regional MPR (Fig. 5 and Supplemental Fig. 4) both in terms of flow ratio (r = 0.73; adjusted P < 0.001) and in terms of flow difference (r = 0.69; adjusted P < 0.001). Regional MPR indices were significantly lower in vessels with abnormal (n = 10) FFR than in vessels with normal (n = 16) FFR (Fig. 6), both in terms of flow difference (0.41 ± 0.47 vs. 1.45 ± 0.52 mL⋅g−1⋅min−1; P < 0.001) and in terms of flow ratio (1.48 ± 0.37 vs. 2.49 ± 0.58; P < 0.001). Flow ratio was a slightly better predictor of FFR alteration than flow difference (ROC AUC, 0.97 vs. 0.92). The diagnostic performance in terms of sensitivity, specificity, and accuracy was, respectively, 89%, 82%, and 85% for flow ratio with a cutoff of 2, and 89%, 76%, and 81% for flow difference with a cutoff of 1 mL⋅g−1⋅min−1.
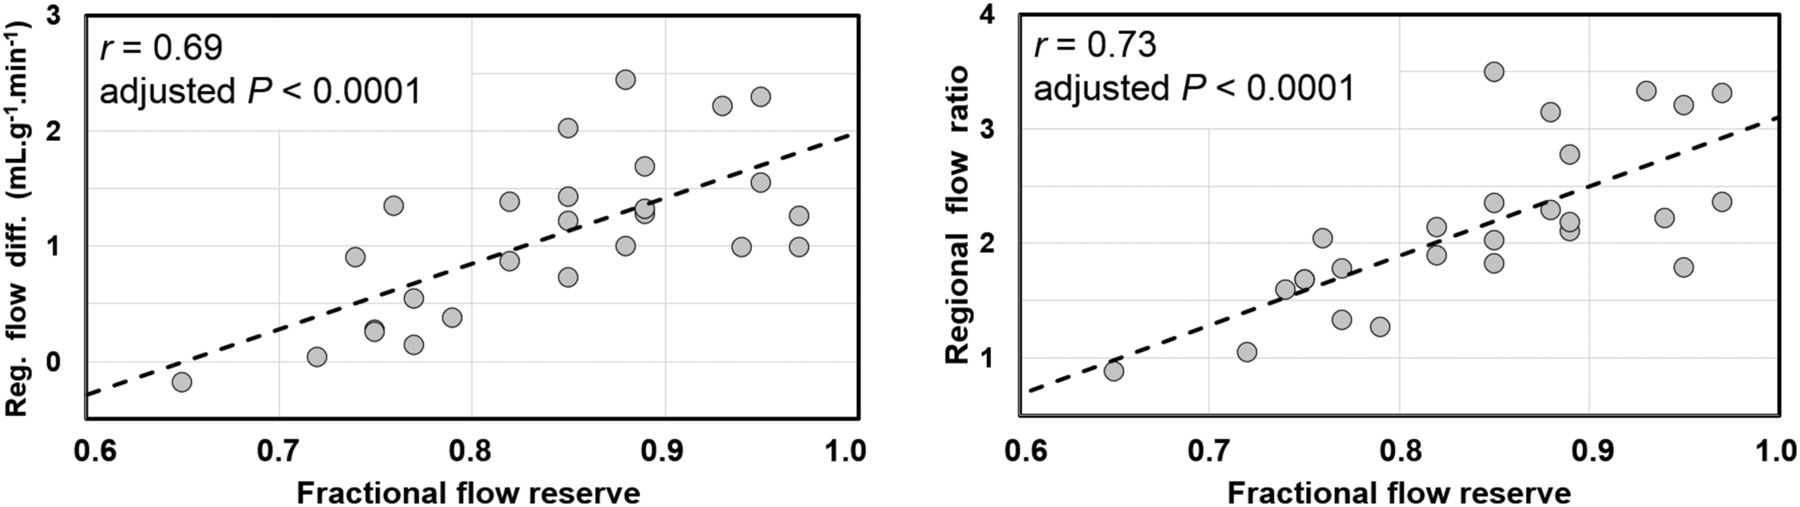
Correlation between regional MPR indices and invasive FFR measurements.

Regional MPR indices in normal (n = 16) and abnormal (n = 9) vessels in terms of FFR. On right are ROC curves (circles stand for optimal cutoffs). Boxes = interquartile range; whiskers = mean ± 1.5 SDs.
DISCUSSION
In this paper, we demonstrated the feasibility of myocardial perfusion quantitation using a novel semiconductor dedicated SPECT camera, the automated extraction of vascular and myocardial time–activity curves, and full compartmental modeling of tracer kinetics. To our knowledge, this is the first study assessing the pertinence of MPR estimations with regard to angiographic findings in terms of both maximal vessel stenosis and FFR. We also proposed a simple method for AIF normalization based on a priori knowledge regarding normal rest flow in an elderly population, to compensate for the differential photon attenuation between myocardial and vascular ROIs. The normalization technique efficiently constrained absolute myocardial flows to physiologic values (1 mL⋅g−1⋅min−1 at rest, 2–3 mL⋅g−1⋅min−1 at stress), hence allowing us to rely on established cutoffs for flow ratio and flow difference interpretation.
The acquisition workflow was compatible with routine practice and remained consistent with clinical guidelines since it allowed for both conventional and quantitative MPI while keeping constant the protocol duration (∼20 min) and the radiation exposure (<9 mSv). Although quantitative perfusion protocols using classic Anger cameras have recently been described and validated (26,27), state-of-the-art dedicated cardiac cameras, for which clinical performance has clearly been demonstrated (28–30), appear as the natural tool for the development of steady myocardial perfusion quantitation in SPECT.
The data processing has largely been automated to ensure the robustness of the quantitative analysis. Intrainterpreter reliability was satisfying. Interoperator variability has not been tested but is expected to be moderate since the only steps requiring manual adjustment were the reorientation of the reconstructed slices into canonic axes and the positioning of the valve plane to delimit the basis of the myocardium and left ventricular cavity. Besides, as already pointed out by Murthy et al. (10), most of the variability in kinetic parameter estimation is linked to the definition of the vascular input function. Preliminary experiments that we have performed using various semiautomated ROI approaches for the extraction of AIF have confirmed this observation and led us to implement the robust normalization method described above. Using a linear attenuation coefficient in water of 0.16 cm−1 for 140-keV photons, the normalization factors can be considered to account for an additional attenuation of the vascular signal corresponding to 2.3 ± 1.4 cm, consistent with basic anatomic considerations.
The results obtained using our methodology in terms of stress flow and flow reserve were consistent with the many reference values available in the literature. As expectable, mean stress flow in our population (1.96 mL⋅g−1⋅min−1) was lower than the previously reported values of about 2.8–3.4 mL⋅g−1⋅min−1 measured using 82Rb PET in healthy volunteers (7,25), and MPR was reduced accordingly (1.96 vs. 3.5–4.2). In the study by Lortie et al. (7) comparing MPR estimation with 13NH3 and 82Rb PET, the mean stress flow in CAD patients was around 2 mL⋅g−1⋅min−1 with a flow ratio of around 2.4, which is close to our values albeit slightly higher likely because of a lesser prevalence of severe CAD. In the case of SPECT imaging, K1 ratio has sometimes been used as a surrogate for MPR characterization. In our study, the global K1 ratio was 1.30 [1.15 1.41], which is comparable to global K1 ratios of 1.46 [1.22 1.79] measured in the cohort studied by Ben-Haim et al. (14). The highest median and wider interquartile range is easily explained by the higher variety of the study population in terms of CAD severity and the lower prevalence of severe CAD. Our results were also consistent with those of Klein et al. (27) regarding patients with known or suspected CAD, in terms of mean blood flow (1.82 mL⋅g−1⋅min−1) and K1 ratio (1.17 [0.96 1.48]). Of note, our mean rest and stress K1 values (respectively, 0.25 and 0.32) were in close agreement with the recent results of Wells et al. (22) using tetrofosmin in a porcine model (respectively, 0.25 and 0.33).
Our results showed a clear correlation between the MPR indices and the extent and severity of coronary disease. First, global MPR was significantly associated with the extent of CAD in terms of number of obstructed vessels, and global MPR was significantly reduced in patients with 3-vessel disease compared with patients without 3-vessel disease (1.57 vs. 2.17 for flow ratio, and trivially 0.57 vs. 1.17 mL⋅g−1⋅min−1 for flow difference). These values were quite close to those already obtained by Ziadi et al. (8) using 82Rb perfusion PET for the detection of 3-vessel disease (1.3 vs. 2.2 for flow ratio, and 0.3 vs. 1.0 mL⋅g−1⋅min−1 for flow difference). Second, regional MPR was significantly associated with both anatomic (maximal stenosis) and functional (FFR) severity of CAD on a per-vessel basis. As expected, regional MPR indices (flow ratio and difference) allowed efficient discrimination between normal and pathologic vessels, from both an anatomic and a functional point of view. As appreciable from the ROC AUCs, flow ratio was a slightly better predictor of obstructive CAD than flow difference, with fairly good diagnostic performance in terms of sensitivity and specificity using the commonly applied cutoff of 2 (8,10,31,32). The incremental diagnostic information over classic semiquantitative processing clearly appears on the ROC AUC in Figure 4. The c-statistics derived here (0.85 for regional flow ratio vs. 0.55 for regional stress TPD in the detection of obstructive stenosis) were in agreement with previously reported values. In the study of Hsu et al. (26), the c-statistics of regional flow ratio and summed stress score for the detection of obstructive stenosis were, respectively, 0.81 and 0.62. In the study of Ziadi et al. (8), the c-statistics of global MPR and summed stress score for the detection of 3-vessel disease were, respectively, 0.82 and 0.68.
The main original contribution of the present paper lies in the assessment of scintigraphic flow reserve estimations with comparison to invasive flow reserve measurements, for which pertinence to patient workup and risk stratification has already been established (15,16). Previous studies demonstrated moderate adequacy between classic semiquantitative SPECT perfusion analysis and FFR (33–35). Classic MPI mostly underestimated the extent and severity of CAD (33), with a subsequent fall in sensitivity to around 60%–65% (specificity, 80%) on a per-vessel basis (34,35), to be compared with the 90% (specificity, 80%) obtained here using fully quantitative modeling. The preliminary results presented here (Figs. 5 and 6) on a relatively small sample of measures require further confirmation in a larger cohort with long-term follow-up but seem to indicate close agreement between the invasive and noninvasive indicators of the functional burden characterizing a coronary artery stenosis.
CONCLUSION
We have described a method to estimate myocardial flow reserve using dynamic SPECT images from a solid-state dedicated camera. The acquisition workflow was compatible with routine practice and consistent with current clinical guidelines for MPI. The results in terms of myocardial stress blood flow and flow reserve agreed with the recent literature related to PET and SPECT MPR. Global and regional MPR indices correlated strongly with the anatomic extent and severity of CAD and demonstrated increased diagnostic performance compared with classic semiquantitative analysis. Most importantly, regional flow ratios agreed closely with the functional characterization of perfusion impairment obtained with invasive FFR measurements. SPECT MPR quantification, as a noninvasive and cost-effective procedure, appears to be a promising tool complementary to classic MPI for routine assessment of CAD.
DISCLOSURE
The costs of publication of this article were defrayed in part by the payment of page charges. Therefore, and solely to indicate this fact, this article is hereby marked “advertisement” in accordance with 18 USC 1734. No potential conflict of interest relevant to this article was reported.
Footnotes
Published online Sep. 3, 2015.
- © 2015 by the Society of Nuclear Medicine and Molecular Imaging, Inc.
REFERENCES
- Received for publication May 5, 2015.
- Accepted for publication August 10, 2015.


Jump to section
Related Articles
Cited By...
- Future of Radionuclide Myocardial Perfusion Imaging: Transitioning from SPECT to PET
- Deep neural network for identification of impaired microvascular and vasomotor function from stress electrocardiography
- Solid-State Detector SPECT Myocardial Perfusion Imaging
- Optimization of SPECT Measurement of Myocardial Blood Flow with Corrections for Attenuation, Motion, and Blood Binding Compared with PET