


Abstract
Hybrid PET/MR systems have recently entered clinical practice. Thus, the accuracy of MR-based attenuation correction in simultaneously acquired data can now be investigated. We assessed the accuracy of 4 methods of MR-based attenuation correction in lesions within soft tissue, bone, and MR susceptibility artifacts: 2 segmentation-based methods (SEG1, provided by the manufacturer, and SEG2, a method with atlas-based susceptibility artifact correction); an atlas- and pattern recognition–based method (AT&PR), which also used artifact correction; and a new method combining AT&PR and SEG2 (SEG2wBONE). Methods: Attenuation maps were calculated for the PET/MR datasets of 10 patients acquired on a whole-body PET/MR system, allowing for simultaneous acquisition of PET and MR data. Eighty percent iso-contour volumes of interest were placed on lesions in soft tissue (n = 21), in bone (n = 20), near bone (n = 19), and within or near MR susceptibility artifacts (n = 9). Relative mean volume-of-interest differences were calculated with CT-based attenuation correction as a reference. Results: For soft-tissue lesions, none of the methods revealed a significant difference in PET standardized uptake value relative to CT-based attenuation correction (SEG1, −2.6% ± 5.8%; SEG2, −1.6% ± 4.9%; AT&PR, −4.7% ± 6.5%; SEG2wBONE, 0.2% ± 5.3%). For bone lesions, underestimation of PET standardized uptake values was found for all methods, with minimized error for the atlas-based approaches (SEG1, −16.1% ± 9.7%; SEG2, −11.0% ± 6.7%; AT&PR, −6.6% ± 5.0%; SEG2wBONE, −4.7% ± 4.4%). For lesions near bone, underestimations of lower magnitude were observed (SEG1, −12.0% ± 7.4%; SEG2, −9.2% ± 6.5%; AT&PR, −4.6% ± 7.8%; SEG2wBONE, −4.2% ± 6.2%). For lesions affected by MR susceptibility artifacts, quantification errors could be reduced using the atlas-based artifact correction (SEG1, −54.0% ± 38.4%; SEG2, −15.0% ± 12.2%; AT&PR, −4.1% ± 11.2%; SEG2wBONE, 0.6% ± 11.1%). Conclusion: For soft-tissue lesions, none of the evaluated methods showed statistically significant errors. For bone lesions, significant underestimations of −16% and −11% occurred for methods in which bone tissue was ignored (SEG1 and SEG2). In the present attenuation correction schemes, uncorrected MR susceptibility artifacts typically result in reduced attenuation values, potentially leading to highly reduced PET standardized uptake values, rendering lesions indistinguishable from background. While AT&PR and SEG2wBONE show accurate results in both soft tissue and bone, SEG2wBONE uses a two-step approach for tissue classification, which increases the robustness of prediction and can be applied retrospectively if more precision in bone areas is needed.
- attenuation correction
- PET/MR
- quantitative imaging
- segmentation
- atlas
- susceptibility artifacts
- MR-based attenuation correction
Hybrid PET/MR systems have recently been introduced into clinical practice and are attracting increasing interest in the research and clinical communities (1–3). While PET/CT is an established hybrid modality with a wide range of applications, specific application trends for PET/MR are currently under investigation (4–7). MR-based attenuation correction (MRAC) remains a major issue as questions arise on what accuracy is needed for different clinical and research applications and which MRAC approach can provide sufficient accuracy for PET quantification. In the case of PET/CT, the conversion of Hounsfield units to 511-keV linear attenuation coefficients (LACs) can be accomplished using a piecewise linear transformation with sufficient accuracy for clinical practice (8).
For MRAC, the LACs need to be determined from the MR data—a more difficult task because there is no unique global mapping function from MR signal intensities to 511-keV LACs. In particular, delineating bone with the standard sequences currently applied for MRAC is not possible. Proposed solutions include the use of external knowledge in the form of an atlas (9,10) or the application of ultrashort echo time sequences that yield signal from compact bone (11–13). Another problem are metal implants in the patient’s body (e.g., hip prostheses, wire cerclages for sternal fixation, or portal catheters), which lead to susceptibility artifacts in the MR images (14). Particularly in fast gradient echo MR sequences, which are usually used for the creation of MRAC maps, these implants produce regions lacking MR signal, leading to an underestimation of the attenuation values and thus potentially causing severe underestimations of PET standardized uptake value and impaired lesion detection, as we show in the present study.
The MRAC methods proposed in the literature can be grouped into 3 categories based on their properties. The first can be described as segmentation of MR images and assignment of specific attenuation values to the different tissue types (11–13,15–19). The second uses external knowledge in the form of aligned MR images and attenuation templates that are registered to the patient’s MR image to obtain an attenuation map (16,20) or are used to learn a mapping function to predict continuous LACs from the MR data (9,10,21,22). The third uses the properties of the acquired PET emission data to reconstruct emission and attenuation data simultaneously (23,24). This last approach was actively pursued before the introduction of PET/CT (25,26) and has recently regained attention to improve MRAC.
While a large fraction of MRAC methods has been evaluated or designed for brain imaging (10–13,16,20–22), several methods were recently proposed and evaluated on whole-body data as well (9,15,17–19,24). Some studies (15,17–19) have presented segmentation-based algorithms that do not account for bone. Our group adapted the atlas- and pattern recognition (AT&PR)–based method, which predicts attenuation values on a continuous scale and accounts for bone for whole-body application (9). Another method that takes bone into account was recently published by Salomon et al. (24). It estimates the LACs from emission data by simultaneously reconstructing the emission and attenuation images. The initial results were promising, but the method does require a time-of-flight PET system, which is currently available only for sequential PET/MR systems (3).
The first aim of this study was to evaluate the accuracy of quantification with our AT&PR method for bone lesions using PET/MR data. Thus far, the published studies on MRAC methods for whole-body imaging agree on the statement that the quantification of PET regions in soft tissue is not significantly affected when segmentation-based methods that do not account for bone are used (9,17,18,27). However, for the quantification of bone lesions, underestimations in PET standardized uptake values of 7%–20% have been reported (9,27,28)—an amount that can affect the accuracy of the PET quantification.
The second focus of our study was to evaluate a new hybrid MRAC method (SEG2wBONE) based on a combination of AT&PR and a segmentation-based method. The attenuation map in areas where bone is likely to occur is predicted with AT&PR, whereas a segmentation-based method is used for the rest of the body. This approach allows a retrospective reconstruction for patients in whom additional precision in the bone tissue is required while preserving the characteristics of soft-tissue lesions.
The third aim was to evaluate the effects of MR susceptibility artifacts on PET quantification and to present correction strategies via the AT&PR method and an atlas of artifact regions for the hybrid SEG2wBONE method.
The evaluations in this study were performed on simultaneously acquired PET/MR data.
MATERIALS AND METHODS
Data Acquisition
The PET/MR images of 10 patients (3 female, 7 male; mean age, 61 y; range, 20–76 y) with mesothelioma, bronchial carcinoma, thyroid carcinoma, metastatic melanoma, colorectal carcinoma, neuroendocrine tumor, anal carcinoma, adenocarcinoma of the small bowel, and cancer of unknown primary were acquired on a Biograph mMR (Siemens Healthcare) in the context of a clinical study. The study was approved by the local ethical committee. All patients gave their written informed consent for the PET/CT and PET/MR examinations and for scientific evaluation of the datasets. The selection criteria for patients were the presence of a bone metastasis or susceptibility artifacts in the MR-based attenuation map. The MR images used for MRAC were acquired under breath-hold using a T1-weighted 3D-encoded gradient echo sequence with a dual echo (echo time 1, 1.23 ms; echo time 2, 2.46 ms; repetition time, 3.6 ms; excitation angle, 10°; acquisition time, 19 s per bed position) and a spatial resolution of 4.1 × 2.6 × 2.6 mm in the left–right, head–feet, and anterior–posterior directions. The 2-echo images were complemented by Dixon fat and water images. Standard phased-array body coils optimized for minimal 511-keV photon attenuation were used for signal detection. The PET scans were obtained at 6 min per bed position 121.5 ± 10.4 min (mean ± SD) after the injection of 362.8 ± 14.6 MBq of 18F-FDG. Within this time slot, the MRAC sequence and additional diagnostic MR sequences were applied.
The corresponding CT images were acquired before the PET/MR acquisition on a Biograph Hi-Rez 16 (Siemens Healthcare; peak voltage, 120 kVp; tube current, 120–250 mAs; rotation time, 0.5 s; collimation, 0.75 mm; table feed, 12 mm) with an in-plane resolution of 0.84 × 0.84 mm or on a Biograph mCT (Siemens Healthcare; peak voltage, 120 kVp; tube current, 250 mAs; rotation time, 0.3 s; collimation, 0.6 mm; table feed, 30.7 mm) with an in-plane resolution of 0.80 × 0.80 mm. Intravenous CT contrast agent was applied to 7 patients; no MR imaging contrast agents were applied.
Computation of MRAC Maps
The attenuation map consists of 2 parts: a patient-specific part, which is calculated individually for each patient, and a hardware part, which contains the bed and integrated or fixed local receive MR radiofrequency coils. The flexible body matrix radiofrequency coils used in the acquisition were optimized for minimal 511-keV photon attenuation and are not accounted for in the hardware attenuation maps. The hardware part is automatically supplemented during the reconstruction process and is identical for all evaluated attenuation maps.
The customized attenuation maps evaluated in this study were created with in-house–developed software written in Matlab (The MathWorks, Inc.) and C.
Baseline Segmentation (SEG1)
The default method for attenuation map prediction on the Biograph mMR is based on segmenting the MR images into 5 classes with predefined constant LACs for each class, based on the method proposed by Martinez-Möller et al. (17). The class denominations and the corresponding LACs are outer air (0 cm−1), lung (0.0224 cm−1), fat tissue (0.0854 cm−1), nonfat tissue (0.1 cm−1), and a fat/nonfat tissue mix (0.0909 cm−1). For this method, the vendor-provided software was used.
Refined Segmentation (SEG2)
An adapted segmentation method was proposed by our group (9) and further developed for this study. In the first step, a segmented MR image is created, which is used for subsequent registration and gaussian process regression (29) steps. The image is segmented into the classes outer air, lungs, fat tissue, nonfat tissue, fat/nonfat tissue mixture, and an additional class to denote regions of low MR signal intensity inside the body.
Fat and nonfat tissues as well as fat/nonfat tissue mixture were classified on the basis of the Dixon fat and water images. Voxels in the fat images of more than twice the intensity of water were assigned to fat and vice versa; remaining voxels that were not subsequently assigned to air or lungs are considered fat/nonfat tissue mixture. Outer air was defined as the largest connected region of low intensity that contained more than 50% of the volume edge voxels. For patients with metal implants—for example, sternal cerclages or portal catheters—the resulting artifacts can generate a connection of outer air and lung regions. To prevent the propagation of potential susceptibility artifacts inside the lungs, morphologic operations were applied to the inner part of the body contour to limit the propagation. Lungs were detected by hierarchic clustering as a set of 1 or 2 regions of low intensity, with the following constraints: first, the size of the regions had to be at least 15,000 voxels; second, the highest axial position in the body was required; and third, the difference in the centroid positions had to be less than 25%. The classes outer air, lungs, fat tissue, nonfat tissue, and fat/nonfat tissue mixture were assigned predefined attenuation values (0, 0.024, 0.0856, 0.1007, and 0.0988 cm−1). The remaining class of low-MR-signal-intensity regions was introduced to account for the MR susceptibility artifact regions and consisted of potential artifact regions and nonlung, air-filled regions inside the body (e.g., sinuses, ear cavities, or air inside the gastrointestinal tract). This intermediate image is denoted MRseg in Supplemental Figure 1. Thus, the subsequent atlas registration was less affected by the different positions of air inside the body or by the presence of susceptibility artifacts. For the creation of the final attenuation map, these regions were classified as soft tissue or inside air.
Atlas-Based Detection of Artifacts
Regions of low MR signal intensity inside the body were differentiated into air-filled regions that were not part of the lungs (e.g., air in the gastrointestinal tract) and soft-tissue regions masked by susceptibility artifacts. To accomplish this differentiation, external knowledge in the form of an atlas of potential artifact positions was used. Eleven patients (6 male, 5 female; age, 66 ± 10 y) were used for the atlas database. For each patient in the atlas database, a map of potential artifact locations was created. The transformations resulting from the registration of the atlas volumes to the patient volume were also applied to the artifact atlas maps. A map of potential artifact locations for the patient was then created by averaging the individual atlas artifact maps and performing a subsequent dilation operation. For every region of low MR signal intensity, the overlap with the artifact location map was computed. If the overlap was higher than a predefined threshold (90%), the low MR intensity of the region was assumed to have been caused by a susceptibility artifact. Then, the attenuation value of soft tissue was assigned to this region; otherwise, the attenuation value was set to air. Supplemental Figure 1 illustrates the workflow.
Atlas- and Pattern Recognition–Based Prediction (AT&PR)
The AT&PR method uses a database of previously aligned pairs of MR–CT volumes to predict attenuation values on a continuous scale (9,10). The prediction is based on gaussian process regression (29). For each voxel in the patient MR image, this method predicts a pseudo-CT value based on the spatially closest voxels from the images in the atlas database. Additionally, the local neighborhood of the MR and segmented MR images is matched, allowing for a more patient-specific prediction. The pseudo-CTs are converted to AC maps with a piecewise linear transformation (8). Hofmann et al. have presented a detailed description of the method (10) and an adaptation and evaluation for whole-body MRAC (9).
In the work presented here, we aimed to improve the robustness of the method in the presence of artifacts by the detection of MR artifacts on the basis of spatial location. In the first step, MR volumes were segmented as described in “Refined Segmentation (SEG2)” and “Atlas-Based Detection of Artifacts.” In the second step, the segmented MR volumes from the atlas database were nonrigidly registered to the patient volume using the open-source software Elastix (30). The resulting transformations were then applied to the corresponding CT images. In the third step, gaussian process regression was applied to predict a pseudo-CT value based on the spatially closest voxels from the images in the atlas database. By matching the local neighborhood of the MR and segmented MR images, a more patient-specific prediction was facilitated. The pseudo-CTs were converted to AC maps using a piecewise linear transformation. Finally, postprocessing steps were applied as described by Hofmann et al. (9).
Combining AT&PR and Segmentation-Based Prediction (SEG2wBONE)
For soft-tissue regions and lesions, differences in PET images reconstructed with either segmentation- or AT&PR-based attenuation maps are not considered to significantly affect PET image quantification (9,17,18,27). Consequently, the prediction of bone via the AT&PR method can be constrained to the parts of the attenuation map where osseous tissue can occur, and the impact of ignoring bone might become significant.
The areas of possible bone occurrence are determined from the coregistered atlas images. A location map of bone tissue for each coregistered atlas CT image is computed by applying an empirically determined bone/soft-tissue threshold (LAC > 0.1106 cm−1), followed by gaussian filtering and a dilation operation. A combined bone location map is computed by averaging the individual bone location maps, similar to the computation of the artifact location map. Subsequently, the computation of the attenuation values via gaussian process regression is applied only to voxels inside the bone location map. Voxels with predicted LACs below the bone/soft-tissue threshold are assigned attenuation values from the MR segmentation described in “Refined Segmentation (SEG2)” and “Atlas-Based Detection of Artifacts.” Supplemental Figure 1 shows the workflow.
CT-Based Attenuation Correction (CTAC)
We used CTAC as the gold standard in our study. The CT-based attenuation maps were derived from CT volumes acquired during the PET/CT examination of the same patient.
The CT volumes were converted to attenuation maps and deformably registered to the segmented MR volumes created by the SEG2 method using Elastix. The initial alignment was based on the lung center of gravity. Beds, positioning devices, and ancillary objects were removed from the CT volumes before the registration.
Because the CT and MR volumes were acquired with different arm positions (in the arms-up position for PET/CT but with the arms down for PET/MR), the computation of the registration metric in the process of nonrigid registration was constrained to the body region and excluded regions with susceptibility artifacts. The arm regions in the CT-derived attenuation maps were replaced using the baseline SEG1 attenuation map created on the scanner. An example is shown in Supplemental Figure 2. The MR radiofrequency coils and the patient bed were automatically added during the reconstruction process.
Evaluation
Reconstruction
The PET images were reconstructed using an implementation of the 3D ordered-subsets expectation maximization algorithm on the Biograph mMR with 3 subsets and 21 iterations. Scatter correction was enabled. The image plane size was 172 × 172 voxels with a spatial resolution of 4.2 × 4.2 mm and a slice thickness of 2 mm. A 3D gaussian filter of 3 mm in full width at half maximum was applied.
Volume-of-Interest (VOI) Analysis
To quantify the differences between the attenuation maps, 3D 80% iso-contour VOIs were placed at the lesion locations on the PET images reconstructed with SEG1 attenuation correction. In 2 cases, lesions were located within an MR artifact. Here, the VOIs were placed on the PET images reconstructed with the AT&PR attenuation correction. VOIs smaller than 5 voxels were excluded from further evaluation. The VOIs were assigned to the categories soft tissue (n = 21), bone (n = 20), near bone (n = 19), and artifact (n = 9). These categories were evaluated separately. The distribution of lesions among the patients is shown in Supplemental Figure 3. Lesions were assigned to the category “near bone” if the maximal distance of the VOI border to the nearest bone tissue (LAC > 0.11 cm−1) was below 30 mm but still outside the bone tissue in CT images. No head or neck lesions were included in the evaluation.
Relative differences between VOI mean values in the PET images after MRAC and reference CTAC were calculated and tested for statistical significance using a Wilcoxon signed rank test. Adjustment of the P values for false discovery was performed with the Benjamini and Hochberg method using the R environment for statistical computing (31). The results were considered statistically significant if the P value was less than 0.001.
For each method, a histogram of the attenuation values in the osseous VOIs was calculated for a sample patient and fitted with a gaussian distribution.
RESULTS
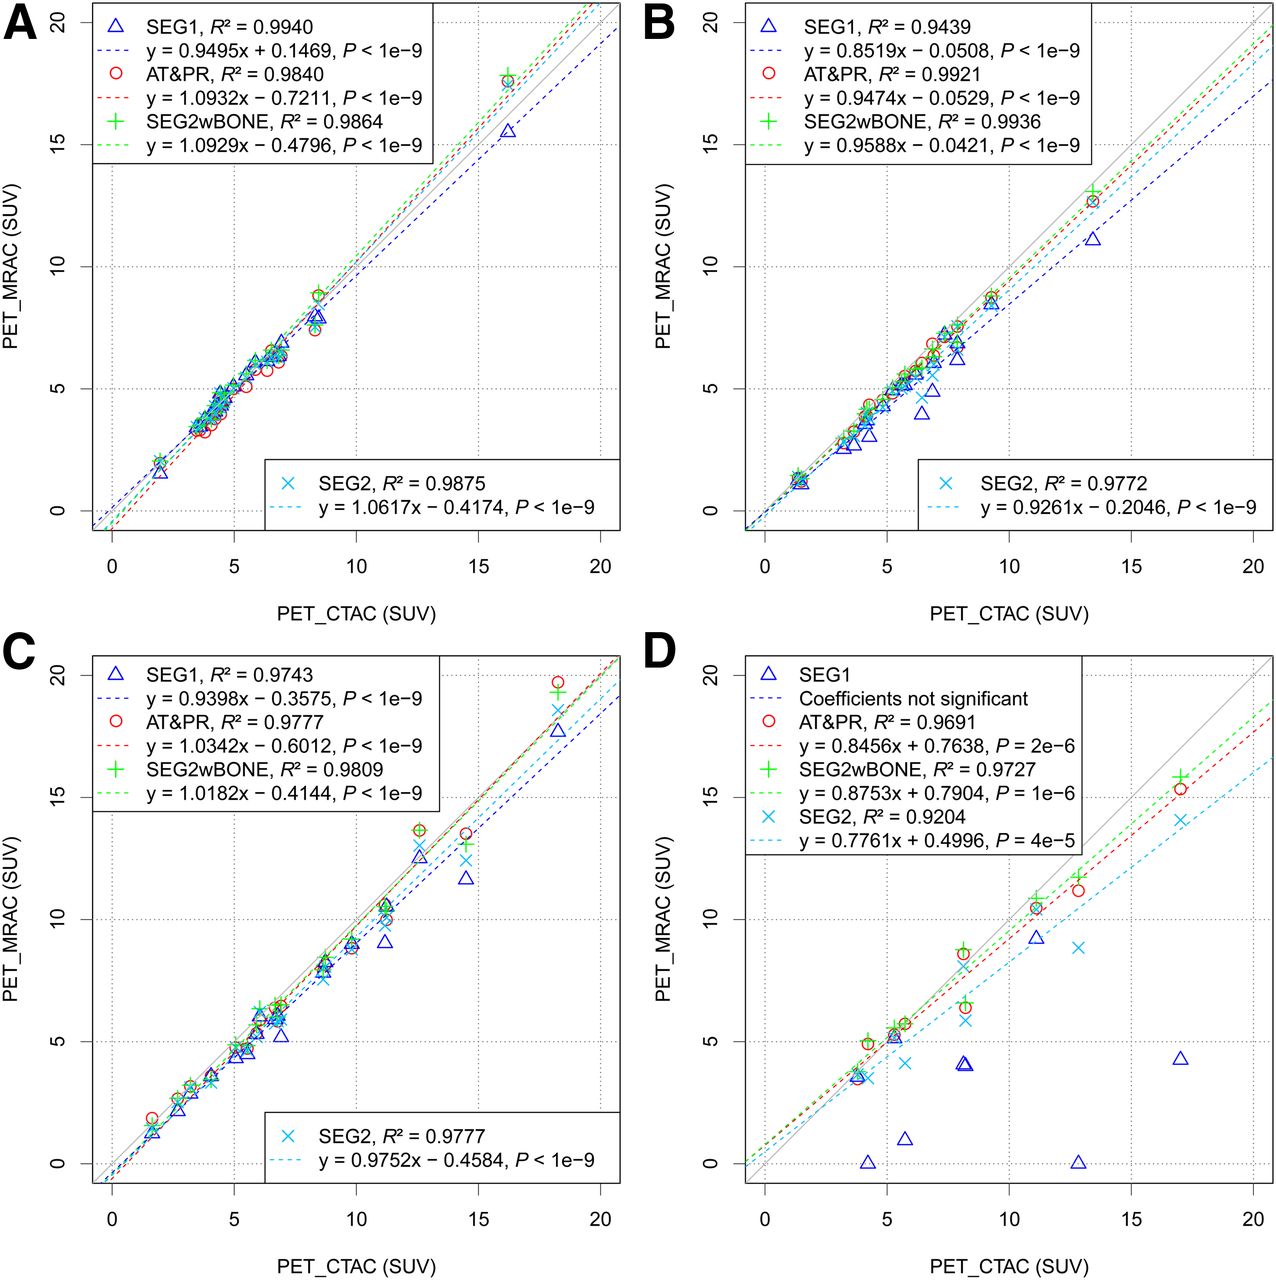
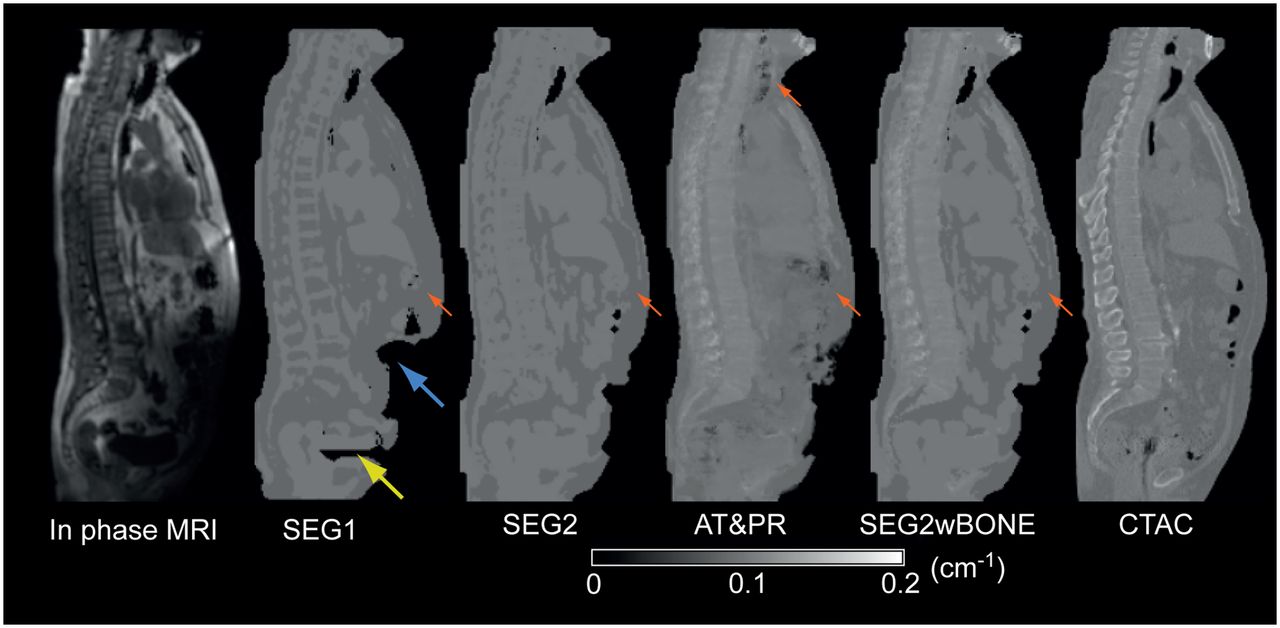
The relative differences between the VOIs in PET images reconstructed using CTAC and the different MRAC methods are summarized in Table 1. In the following, we refer to these differences as errors. Figure 1 shows these errors for each VOI, grouped by location of the lesions. Figure 2 presents scatterplots of the mean VOI activities in PET images reconstructed using MRAC versus CTAC, with R2 values and regression coefficients. Figure 3 shows the in-phase MR image, the AC maps created using the evaluated methods, and the reference CTAC map for a selected case.
Mean Relative PET Quantification Errors and Their SDs in VOIs with CTAC as Reference
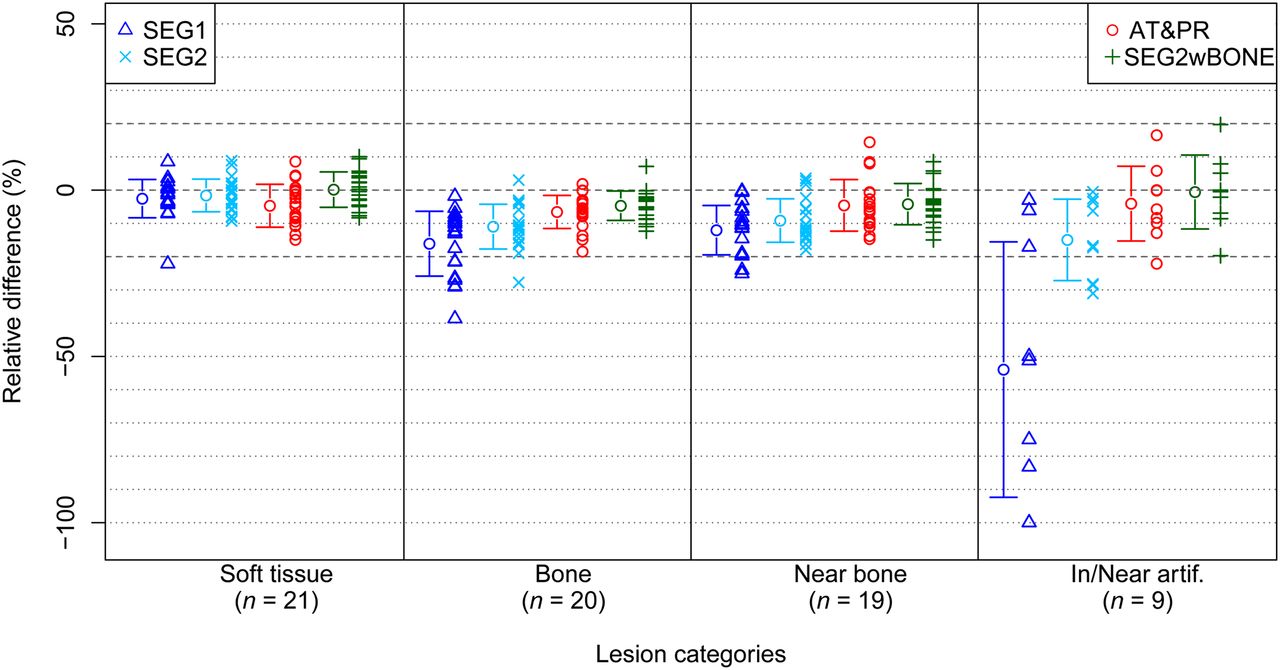
Relative differences in mean VOI activity between PET images corrected for attenuation with SEG1, SEG2, AT&PR, and SEG2wBONE with CTAC as reference. Means and SDs are indicated by circles and horizontal bars, respectively.

Scatterplots of mean activity in VOIs for PET images corrected for attenuation with MRAC vs. reference CTAC in categories soft tissue (A), bone (B), near bone (C), and artifact (D). Dashed lines denote regression lines. Coefficients with their corresponding P values are given in legend. PET_CTAC = PET images reconstructed using CTAC; PET_MRAC = PET images reconstructed using the different MRAC methods.

In-phase MR image, MR-based attenuation maps, and reference CTAC for sample patient with properties that impede creation of MR-based attenuation maps. In this patient, MR signal in lower abdomen was deteriorated because of inadvertently failed selection of body array coil. Additionally, susceptibility artifacts in pelvis occurred because of hip prostheses. Effects on attenuation map are indicated by blue and yellow arrows, respectively. Red arrows indicate filled airways and gas bubbles differently segmented by the 4 methods.
Lesions in Soft Tissue
For lesions located in soft tissue, the baseline MRAC SEG1 method yielded an underestimation of −2.6% ± 5.8% (P = 0.04), compared with CTAC. SEG2 showed an error of −1.6% ± 4.9% (P > 0.05). AT&PR and SEG2wBONE methods showed errors of −4.7% ± 6.5% (P = 0.02) and 0.2% ± 5.3% (P > 0.05), respectively (Fig. 1). The range of R2 values was between 0.984 (AT&PR) and 0.994 (SEG1) (Fig. 2A). None of the differences showed statistical significance.
Lesions in Osseous Tissue
For the osseous lesions, the segmentation-based methods, SEG1 and SEG2, showed underestimations of −16.1% ± 9.7% (P < 10−5) and −11.0% ± 6.7% (P < 10−4), respectively. AT&PR and SEG2wBONE, which predict attenuation values for bone, showed differences of −6.6% ± 5.0% (P < 10−4) and −4.7% ± 4.4% (P < 10−3), respectively (Fig. 1). R2 values varied between 0.944 and 0.994, with values being greater than 0.99 for methods that account for bone (Fig. 2B). The differences for all evaluated methods were statistically significant.
The distributions of the LACs in the bone VOIs of a sample patient in the attenuation maps generated by the evaluated AC methods are shown in Supplemental Figure 4.
Lesions Near Osseous Tissue
For lesions near osseous tissue, SEG1 and SEG2 showed underestimations of −12.0% ± 7.4% (P < 10−4) and −9.2% ± 6.5% (P < 10−3), respectively. AT&PR and SEG2wBONE yielded errors of −4.6% ± 7.8% (P = 0.03) and −4.2% ± 6.2% (P = 0.03), respectively (Fig. 1). The range of R2 values was between 0.9743 (SEG1) and 0.981 (SEG2wBONE) (Fig. 2C). The differences for SEG1 and SEG2 were statistically significant.
Lesions Within or Near Susceptibility Artifact Regions
Lesions located within or near MR susceptibility artifact regions yielded an error of −54.0% ± 38.4% (P = 0.01) for SEG1 MRAC, in which no artifact correction was applied. For SEG2, the error was reduced to −15.0% ± 12.2% (P = 0.02). Errors for AT&PR and SEG2wBONE were −4.1% ± 11.2% (P > 0.05) and 0.6% ± 11.1% (P > 0.05), respectively (Fig. 1). Two lesions were visually indistinguishable from the background, and thus, no statistically significant regression coefficients could be computed for SEG1. In Figure 4, the effect of uncorrected artifacts on lesion activity is illustrated for a sample patient with hip prostheses.
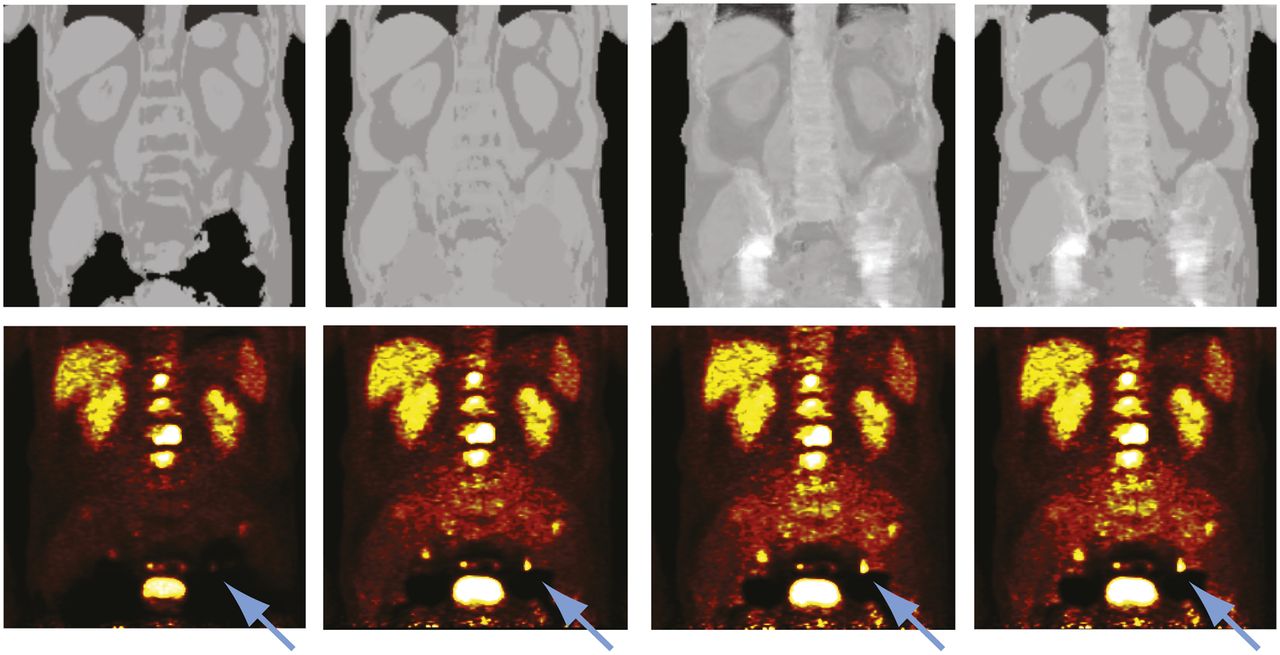
Attenuation maps (top) and PET images (bottom) for sample patient with hip prostheses. The used MRAC methods, from left to right, were SEG1, SEG2, AT&PR, and SEG2wBONE. Metal artifacts are due to bilateral hip replacement. Blue arrows denote lesion affected by presence of adjacent metal artifact when no correction was performed.
DISCUSSION
Our results showed good agreement between CTAC and all MRAC methods for lesions within soft tissue. The mean error was below 5% for all evaluated methods, with an SD of between 4.9% for SEG2 and 6.5% for AT&PR. These values confirm previously published results (17,18,27) and our own previous results (9) showing that a segmentation-based method that does not account for bone does not significantly affect the quantification of soft-tissue lesions. Although previous studies used PET/CT data for the evaluation, our study was performed on simultaneously acquired PET/MR data.
The MRAC methods that account for bone showed errors of less than 7% (AT&PR, −6.6% ± 5.0%; SEG2wBONE, −4.7% ± 4.4%), an amount that is not likely to affect PET quantification. The error for bone lesions was reduced from −11.0% ± 6.7% for SEG2 to −4.7% ± 4.4% for SEG2wBONE, which added continuous LACs for bone tissue.
Eiber et al. (27) reported an underestimation of 7.46% for bone metastases using a segmentation-based method without bone prediction. A study conducted by our group (9) showed an underestimation greater than 10% for 58% of osseous regions when a segmentation-based method that ignored bone was used. Keereman et al. reported an underestimation of 10%–20% in spine and femur lesions if cortical bone was ignored, versus 10%–15% if soft bone was ignored (32).
A recent study investigated the implications of PET quantification on different types of bone lesions using PET/CT data (28), with the maximum LACs of the CT attenuation maps being limited to soft tissue. A mean underestimation of 15.9% ± 3.4% was reported for sclerotic spine lesions and 7.2% ± 1.7% for osteolytic spine lesions. In our study, predominantly osteolytic lesions were found in one patient whereas another did not have osteodestructive lesions, resulting in a higher SD for segmentation-based methods without bone prediction than for methods that account for bone (9.7% for SEG1 and 6.7% for SEG2, vs. 5.0% for AT&PR and 4.4% for SEG2wBONE). The impact of the proposed MRAC algorithms of different bone lesion types on PET quantification has to be evaluated on a larger patient collective.
The difference between SEG1 (−16%) and SEG2 (−11%) could be attributed to differences in the segmentation method. As shown in Supplemental Figure 4, SEG2 assigns a large fraction of voxels to the class fat/soft-tissue mixture, whereas SEG1 assigns a comparable amount to the class fat, thus leading to a higher underestimation in these regions.
The mean error for lesions in the vicinity of osseous tissue for methods that account for bone (AT&PR, −4.6%; SEG2wBONE, −4.2%) was reduced, compared with methods without bone prediction (SEG1, −12.0%; SEG2, −9.2%). The SD was not significantly reduced by the introduction of bone LACs to the attenuation maps, as was the case for bone lesions (SEG2, 6.5%; SEG2wBONE, 6.2%). AT&PR showed an overestimation of more than 8% (Fig. 1C) for 2 lesions that was caused by adjacent filled airways, resulting in the highest SD of the evaluated methods (7.8%).
Several MRAC methods for brain imaging that predict bone use ultrashort echo time sequences to discriminate bone from other tissues (11–13). However, ultrashort echo time sequences have long acquisition times and field inhomogeneities if applied for whole-body attenuation correction. A method published by Johansson et al. (21,22) uses a gaussian mixture model to predict pseudo-CT images on a continuous scale, but the method requires multiple MR sequences as input, making application in a clinical setting difficult. The AT&PR and the modified SEG2wBONE methods are able to predict bone using the standard Dixon sequence that is routinely acquired for attenuation correction on the Biograph mMR.
Although AT&PR shows good results on soft tissue, our results and the literature (9,17,18,27) suggest there is no need to use a more complex AT&PR model for LAC prediction when a simpler segmentation-based method provides sufficient accuracy for soft-tissue lesions. Thus, it is a viable simplification to exploit the results of AT&PR-based prediction only when its prediction ability is needed to produce accurate LACs, that is, in voxels with attenuation values higher than the threshold between soft tissue and bone. SEG2wBONE showed the lowest SD for all lesion categories except soft tissue, for which SEG2 yielded a marginally lower SD (5.3% vs. 4.9%) and the lowest mean error. On soft-tissue lesions, SEG2wBONE and SEG2 showed similar mean errors of −0.2% and −1.6%, respectively, whereas AT&PR yielded a slightly higher error of −4.7%. The lower SD of SEG2wBONE in comparison to AT&PR may be attributed to the increased robustness of the two-step approach for soft-tissue and bone classification. Because LACs predicted by gaussian process regression are used only for bone tissue voxels, gaussian process regression may be less affected by potential errors in the atlas registration. Thus, if a segmentation-based method is used as a standard for clinical attenuation correction, as is currently the case with clinically available PET/MR systems (15,17,27), a retrospective reconstruction with SEG2wBONE for increased quantification precision for osseous lesions would introduce a smaller change for soft-tissue lesions than would AT&PR, thus potentially facilitating clinical acceptance. The reduced computational complexity of SEG2wBONE resulted in 24% faster runtime than that of AT&PR.
MR susceptibility artifacts can significantly affect the PET quantification if not corrected for. In the worst case, lesions become nearly indistinguishable from the background (Fig. 4). Newer metal implants are MR-compatible, and thus, these implants are seen rather often in the patient collective that undergoes PET/MR examinations. Among these, artificial joints cause the most severe artifacts because of their size.
Two methods for artifact correction were used in this study: SEG2 and SEG2wBONE, which rely on an atlas of potential artifact locations to classify regions of low MR signal intensity into soft tissue (in the case of an artifact) and air (otherwise). AT&PR computes the prediction value for a single voxel on the basis of similarities to patches from the coregistered atlas volumes. AT&PR is thus able to predict LACs inside artifact regions because it uses patches from the segmented MR volume in which voxels of low MR signal intensity not belonging to the lung are represented by a value between fat and soft tissue after the intermediate segmentation step. The method is therefore able to predict the LACs based on meaningful patches, although the in-phase MR volume shows no signal in these areas. Because no information from the MR signal about the exact location of a metal implant can be extracted, the prediction in regions affected by susceptibility artifacts is in large part guided by the spatial information from the coregistered atlas images. Because this limitation can introduce areas of artificially high attenuation in the predicted attenuation map, a restriction to a constant attenuation value in such regions, as is performed by the other evaluated methods, may be a safer approach. Currently, the artifact atlas contains regions for hip prostheses in the pelvis and for sternal cerclages or portal catheters in the thorax, which were the most frequent locations in our whole-body patient collective thus far. We found the registration process to be robust against deterioration of the body contour through susceptibility artifacts that occurred in this study. The atlas can be extended to incorporate additional regions. While AT&PR is the more general method as it does not perform hard differentiation into tissue classes, SEG2wBONE, having the advantages outlined above, is currently able to handle the most frequently occurring artifacts. The compensation does not account for the increased attenuation of exogenous material, which contributes to the remaining errors. The differences from the reference CTAC are similar for both methods (Figs. 1 and 2).
We used CT-based attenuation maps as a reference in our study, and these had to be nonrigidly registered to the MR images. The remaining inaccuracies in the registration contribute to the reported bias. Because the CT volumes were registered to segmented MR volumes, there was potentially a small bias in favor of the methods that are based on this particular segmentation, that is, SEG2, AT&PR, and SEG2wBONE. However, the registration to the in-phase MR volumes showed insufficient alignment quality. Furthermore, the CT-based attenuation maps can be inaccurate in areas where metal artifacts are present, showing an overestimation of the LACs. In the MR-based attenuation maps, LACs in these areas can be underestimated, as the higher attenuation of metal than of body tissue is not accounted for. Therefore, the reported errors are a sum of mispredictions of the MR-based attenuation maps and contributions from inaccuracies in the CT-based references. However, the evaluated MR-based methods are equally affected by errors in the reference attenuation map. The modifications of the CT-based attenuation maps due to the different arm positions potentially reduce the reported bias for all methods, as the errors caused by truncation artifacts (and absence of bone) in truncation compensation are not present in the current setup.
CONCLUSION
We evaluated 4 MRAC methods on lesions in bone, in soft tissue, and within MR susceptibility artifacts with CTAC as a reference: 2 segmentation-based methods that do not account for bone, a method using atlas and pattern recognition, and a hybrid method that combined both approaches. The last 2 methods account for bone attenuation. For all 4 methods, the error magnitude in soft-tissue lesions was below 5% and thus is unlikely to affect PET quantification. For bone lesions, omitting bone prediction leads to errors above 10% and an increased SD that can be reduced by methods that account for bone. SEG2wBONE can be applied to improve bone quantification in clinical settings, where a segmentation-based method is routinely used. If MR artifacts are not accounted for, large errors can occur. The initial results suggest that the proposed atlas-based method for artifact correction can correct these errors for most frequently occurring metal implants. The stability of the method should be further evaluated on a larger patient cohort with additional anomalies.
DISCLOSURE
The costs of publication of this article were defrayed in part by the payment of page charges. Therefore, and solely to indicate this fact, this article is hereby marked “advertisement” in accordance with 18 USC section 1734. Financial research support was provided through grants PI771/5-1 and PI771/1-1 from the “Deutsche Forschungsgemeinschaft” and through the Swiss Werner Siemens Foundation. No potential conflict of interest relevant to this article was reported.
Footnotes
Published online Sep. 5, 2013.
- © 2013 by the Society of Nuclear Medicine and Molecular Imaging, Inc.
REFERENCES
- Received for publication August 28, 2012.
- Accepted for publication May 7, 2013.


Jump to section
Related Articles
Cited By...
- PET/MRI in the Presence of Metal Implants: Completion of the Attenuation Map from PET Emission Data
- Imaging Bone Metastases in Breast Cancer: Staging and Response Assessment
- Quantitative Evaluation of Segmentation- and Atlas-Based Attenuation Correction for PET/MR on Pediatric Patients
- Clinical Assessment of Emission- and Segmentation-Based MR-Guided Attenuation Correction in Whole-Body Time-of-Flight PET/MR Imaging
- Impact of Time-of-Flight PET on Quantification Errors in MR Imaging-Based Attenuation Correction
- Hybrid PET/MR Imaging: An Algorithm to Reduce Metal Artifacts from Dental Implants in Dixon-Based Attenuation Map Generation Using a Multiacquisition Variable-Resonance Image Combination Sequence
- Principles of PET/MR Imaging