


Abstract
This work aimed to evaluate the image quality and accuracy of attenuation and scatter corrections provided with the microPET Focus 120 scanner using the National Electrical Manufacturers Association NU4-2008 image quality phantom. Methods: Attenuation correction was obtained from transmission measurements using either a 68Ge or a 57Co point source. Fully corrected emission images were reconstructed using Fourier rebinning (FORE) and filtered backprojection (FBP). For attenuation data obtained with the 57Co source, fully corrected emission images were also reconstructed using FORE and 2-dimensional (2D) ordered-subset expectation maximization (OSEM), 3-dimensional (3D) filtered backprojection (3DRP), 3D OSEM, and 3D maximum a posteriori methods. The mean activity, the coefficients of variation (COVs) of the uniform slices, the recovery coefficients (RCs) for hot rods, and the spillover ratio (SOR) for nonemitting water and air compartments were measured. Results: For 57Co-based attenuation correction, the mean activity value differed by less than 3% from the true activity. Measuring the attenuation with 68Ge resulted in lower reconstructed activity and higher COV. On the basis of 57Co measurements, the SORs for air and water nonemitting compartments were the closest to zero for attenuation correction. The RC measured on emission images corrected for attenuation but not for scatter did not show any significant difference linked to the transmission method. However, higher RCs were noted for transmission measurement with 68Ge in coincidence with windowing when emission data were corrected for attenuation and scatter. This resulted from a lower mean value in the uniform area. 2D and 3DRP reconstruction methods showed little effect on the mean activity value, whereas iterative 3D methods gave 7% higher values. Higher RCs were found with iterative reconstruction than with FBP and 3DRP. However, the SOR seemed to be optimal with FBP. SORs were higher with iterative methods and decreased with the number of iterations. Conclusion: For studies of small rodents with the Focus 120, 57Co transmission seems to be the most suitable method for attenuation correction. FORE and 2D reconstruction methods appear to be a good compromise between overall image quality and reconstruction time: OSEM provides the largest contrasts, but FBP provides superior attenuation and scatter correction.
PET for small animals is used as a translational research tool between animal models and human clinical applications (1–3). The small dimensions of organs in animals such as rats or mice have prompted the development of dedicated PET scanners with high resolution and high sensitivity (4–6).
Concorde Microsystems and thereafter Siemens Medical Solutions Inc. have successively developed 5 commercial scanners: microPET-P4 (7), microPET-R4 (8), microPET Focus 220 (9,10), microPET Focus 120 (F-120) (6,11,12), and Inveon (13,14). Recently, the National Electrical Manufacturers Association (NEMA) released the NU4-2008 (NU4) standards, which provide a unified full protocol for performance measurements of small-animal PET (15). The performance in terms of spatial resolution, counting rate, and sensitivity has been evaluated for these 5 scanners, in particular for the F-120, using procedures similar to those given in NU4 (6–14,16). However, for image quality (IQ) evaluation, several phantoms that differed from the NU4 IQ phantom were used. The NU4 phantom is used for the standardized assessment of the overall IQ and accuracy of attenuation and scatter corrections of small-animal PET scanners.
The aim of the present study was to evaluate the IQ, the accuracy of attenuation and scatter-corrections methods, and the quantitative accuracy of the F-120 using the NU4 IQ phantom and methods (15). Where possible, the scanner was operated using the default parameters set by the manufacturer. For attenuation correction, 4 various methods provided for transmission measurements (57Co and 68Ge in singles mode, 68Ge in coincidence mode with and without windowing) were investigated. The attenuation-corrected sinograms were reconstructed using Fourier rebinning (FORE) (17) and 2-dimensional filtered backprojection (2D-FBP). From the analysis of these results, the most suitable method for transmission measurement was selected. Finally, these transmission data were used to reconstruct the phantom emission images with all available reconstruction methods provided with the scanner: FORE and 2D-FBP or 2D ordered-subset expectation maximization (OSEM) (18) for various numbers of iterations, 3-dimensional (3D) filtered backprojection (3DRP) (19), 3D-OSEM (16,18,20) for various numbers of iterations, and a 3D maximum a posteriori (MAP) algorithm dedicated to the microPET and Inveon scanners family (21–23).
MATERIALS AND METHODS
System Description
The F-120 (6,11) is a full-ring PET scanner intended for the imaging of small laboratory animals such as mice and rats. The detector consists of 4 rings and 96 specific detector blocks. Each block consists of a 12 × 12 array of 1.52 × 1.52 × 10 mm individual crystals of lutetium oxyorthosilicate arranged with a pitch of 1.59 mm to allow the insertion of a thin and highly reflective material between the crystals. Each block is optically coupled to a 12-channel position-sensitive photomultiplier by an 8 × 8 bundle of fiber optics. The effective field of view extends 10 cm transaxially and 7.6 cm axially. Transmission is obtained using rotation and translation of either a 57Co or 68Ge point source. The system automatically determines the number of passes of the point source in the field of view from the user-selected transmission time. Emission and transmission data are recorded and stored in list-mode. The system software allows postacquisition histogramming of the data in 3D sinograms, with a high flexibility in the choice of the frame time, span, and ring difference.
Randoms are estimated from a single block counting rate weighted by individual crystal efficiencies and are subtracted from the prompt sinograms to obtain the true sinograms (11). Dead time is corrected using the running global average method, and sinograms are normalized using a component-based method (24) before reconstruction. The software provides several reconstruction methods: 2D-FBP and 2D-OSEM (18) for reconstruction of 2D-rebinned sinograms with either single-slice rebinning (25) or FORE (17), 3DRP (19), 3D-OSEM (16,18,20), and MAP (21–23) for direct reconstruction of the 3D sinograms. For attenuation correction, transmission data and blank scans were used to compute correction factors that were applied to the decay-corrected and normalized true sinograms before reconstruction. Emission sinograms can be scatter-corrected using single-scatter simulation (26,27) by substraction of the scatter sinograms from the normalized true sinograms before attenuation correction. The manufacturer has developed its own algorithm for the scatter correction of transmission in windowed coincidence mode. The detector facing the point source is determined from the source location, and the scatter is estimated from the counts recorded in the adjacent detectors. No scatter-correction method is available for transmission in coincidence mode without windowing. Unpublished and proprietary methods were used for scatter correction of the transmission data in singles modes (David L. Bailey, written communication, May 28, 2009). The software version used for all acquisitions and reconstructions was 2.4.1.1.
Scanner Normalization and Calibration
The procedures implemented by the manufacturer were followed to obtain the normalization factors and to calibrate the scanner. For the normalization, a 10-h-long scan was obtained with a cylinder (9.4-cm diameter; 17-cm length) filled with 18F (20 MBq) in water solution. The normalization factors were computed (24) using the scanner software. For the scanner calibration, a small cylindric bottle (50-mL volume; 30-mm diameter) filled with water and 18F (145 kBq/mL) was used. Before imaging, a small aliquot was withdrawn and counted using a calibrated γ-counter (Canberra Industries). The protocol used for imaging was similar to the ones used for the IQ phantom. Transmission scanning was performed using the 57Co point source after a suitable period (20 h), to ensure that there was no meaningful residual radioactivity in the phantom. Emission images were reconstructed with all corrections and processed with ASIPro software (Siemens) for calibration factor generation.
Phantom
The NU4 IQ phantom (15) is a cylindric container with internal dimensions of 50 mm in length and 15 mm in radius and comprises 3 regions. The central part (15-mm length) is free of any object and serves as a uniform region. One end of the cylinder is occupied by a cylindric block of 20 mm in length and 15 mm in radius. Five fillable rods with diameters of 1, 2, 3, 4, and 5 mm are drilled parallel to and with their center at 7 mm from the cylinder axis. This part serves for resolution recovery measurements. At the other end of the phantom, 2 fillable cylindric chambers (15-mm length, 8-mm inner diameter, and 10-mm outer diameter) are attached to the cover. The axis of these chambers is parallel to and at 7.5 mm from the cylinder axis. One chamber is filled with air and the other with deionized distilled water (density, 1 g/mL). This part serves for the measurement of spillover from the radioactive liquid into the nonradioactive air and water. The phantom was made in our workshop following the NU4 sketches (15). The volume of the main compartment was 20.38 mL, determined by weighing the phantom before and after filling it with deionized distilled water. For all acquisitions, the phantom was lying on the scanner bed and centered in the scanner field of view, with its axis superimposed with the scanner axis.
Transmission Acquisitions
The transmission measurements were obtained with the 2 point sources delivered with the scanner. The activity of the 57Co source was 80.66 MBq on the day of measurement. Data were acquired in singles mode (CoS) for 515, 1,030, and 2,060 s and 1 h using the 120- to 125-keV energy window recommended by the manufacturer. The activity of the 68Ge source was 7.415 MBq on the day of measurement. Scans were collected for 1 h in singles mode (GeS) and in coincidence mode with windowing (GeCoiWin) and without windowing (GeCoi). As recommended by the manufacturer, the energy window was 350–650 keV for all 3 modes, and a timing window of 6 ns was used in coincidence mode.
For each acquisition mode, a blank scan was acquired just before the experiments. The manufacturer-recommended blank scan times (28,000 s for 57Co; 14,400 s for 68Ge) for fresh sources were adapted to take into account the source decay. Transmission and blank data were acquired in list-mode and histogrammed with a span of 47 and a ring difference of 23 using single-slice rebinning and with correction for randoms for the coincidence modes. Correction for scatter was applied, except for GeCoi. Finally, the microPET software applied a scaling operation and generated the attenuation sinograms, which were used to correct the emission data (David L. Bailey, written communication, May 28, 2009).
Transmission Reconstructions
The natural log of the attenuation sinograms was reconstructed using 2D-FBP with a ramp filter cutoff at the Nyquist frequency, resulting in 95 transaxial slices of the measured attenuation coefficients. The slice thickness was 0.796 mm and 2 slice matrices (128 × 128 and 256 × 256) were used, resulting in an in-slice pixel size of 0.865 and 0.432 mm, respectively.
Emission Acquisitions
The main chamber of the IQ phantom was filled with water and 4.921 MBq of 18F. This activity was determined by measuring the 18F syringe before and after phantom filling using a calibrated activimeter (CRC-12; Capintec). A 20-min acquisition was started when the activity reached 3.7 MBq (181.5 kBq/mL), as recommended in NU4 (15). Emission data were acquired with an energy window of 350–650 keV and a coincidence timing window of 6 ns. The obtained list-mode data were histogrammed into 3D sinograms using a span of 3 and a ring difference of 47, with randoms and dead-time corrections but without smoothing.
Emission Reconstructions
For each transmission method, fully corrected emission images of the phantom were reconstructed using FORE and FBP with a ramp filter cutoff at the Nyquist frequency. A total of 95 transaxial slices was obtained in both 128 × 128 and 256 × 256 matrices. The slice thickness was 0.796 mm, and the in-slice pixel size was either 0.865 or 0.432 mm. A full set of images was also obtained with attenuation correction but without the application of the emission scatter correction.
Emission data were also reconstructed with the other available methods using the attenuation data from the 515-s and 1-h CoS transmission measurements. 2D reconstructions of the FORE sinograms were generated with FBP and a Hanning filter with a cutoff at the Nyquist frequency and with OSEM (16 subsets) for 4, 8, 12, 16, and 20 iterations. Direct reconstructions of the 3D sinograms were obtained using 3DRP and a ramp or a Hanning filter with a cutoff at the Nyquist frequency; 3D-OSEM (12 subsets) for 4, 8, 12, 16, and 20 iterations; and MAP. The MAP algorithm (21–23) is a preconditioned conjugate gradient method that includes a nonnegativity constraint and a 3D Gibbs prior with a Huber potential function. It also uses detection-probability matrix coefficients for sensitivity and geometric blurring, which are provided by the manufacturer and stored on disk. MAP executed 18 iterations after 2 initial 3D-OSEM iterations with 12 subsets. MAP was set to either uniform resolution (MAP resolution) or uniform variance (MAP variance) in the reconstructed images. MAP variance uses a constant hyperparameter value that is automatically selected from the span, ring difference, and slice pixel size. MAP resolution uses a spatially variant hyperparameter (21). The faster version of MAP (Fast MAP) was also used. Fast MAP proceeds first with a FORE operation and then executes a 2D-MAP reconstruction (David L. Bailey, written communication, May 28, 2009).
Data Analysis
Amide (http://amide.sourceforge.net, A Medical Image Data Examiner, version 0.9.1, Andreas Loening) and Matlab (http://www.mathworks.com, version 7.5) were used for data analysis. A cylindric volume of interest (VOI) of 22.5 mm in diameter and 10 mm in length was drawn over the center of the uniform region of the phantom. The mean activity concentration (mean), the maximum and minimum values, and the percentage SD (%SD) were measured in this VOI. The same VOI was also used for measuring the mean attenuation coefficient in transmission-reconstructed images. The coefficient of variation (COV) expresses the ratio between SD and the mean reconstructed emission image value. Δvar is defined as (maximum – minimum)/mean.
For recovery coefficients (RCs), the image slices covering the central 10-mm length of the rods were summed with Matlab to obtain a single slice of lower noise. Circular regions of interest were drawn in the summed image, around each rod, with a diameter twice the physical diameter of the rods. The pixel coordinates of the location of the maximum region-of-interest values were determined and used to create axial line profiles along the rods. The mean pixel values measured along each profile, divided by the mean activity concentration found in the uniform region, were used to determine the mean and SD of the RC for each rod size. SD of the RC is given by the following equation (15): Eq. 1Two cylindric VOIs were defined in the air and water nonemitting compartments. They encompassed the central part of these compartments and were 4 mm in diameter and 7.5 mm in length. The ratio of the mean in each cold region to the mean of the uniform region was reported as spillover ratio (SOR). The SD was also calculated in the same manner (Eq. 1) as for the RC (15).
RESULTS
Because the image matrix size had no effect on the results, only those for the 128 × 128 matrix are presented.
Uniformity of Emission Images
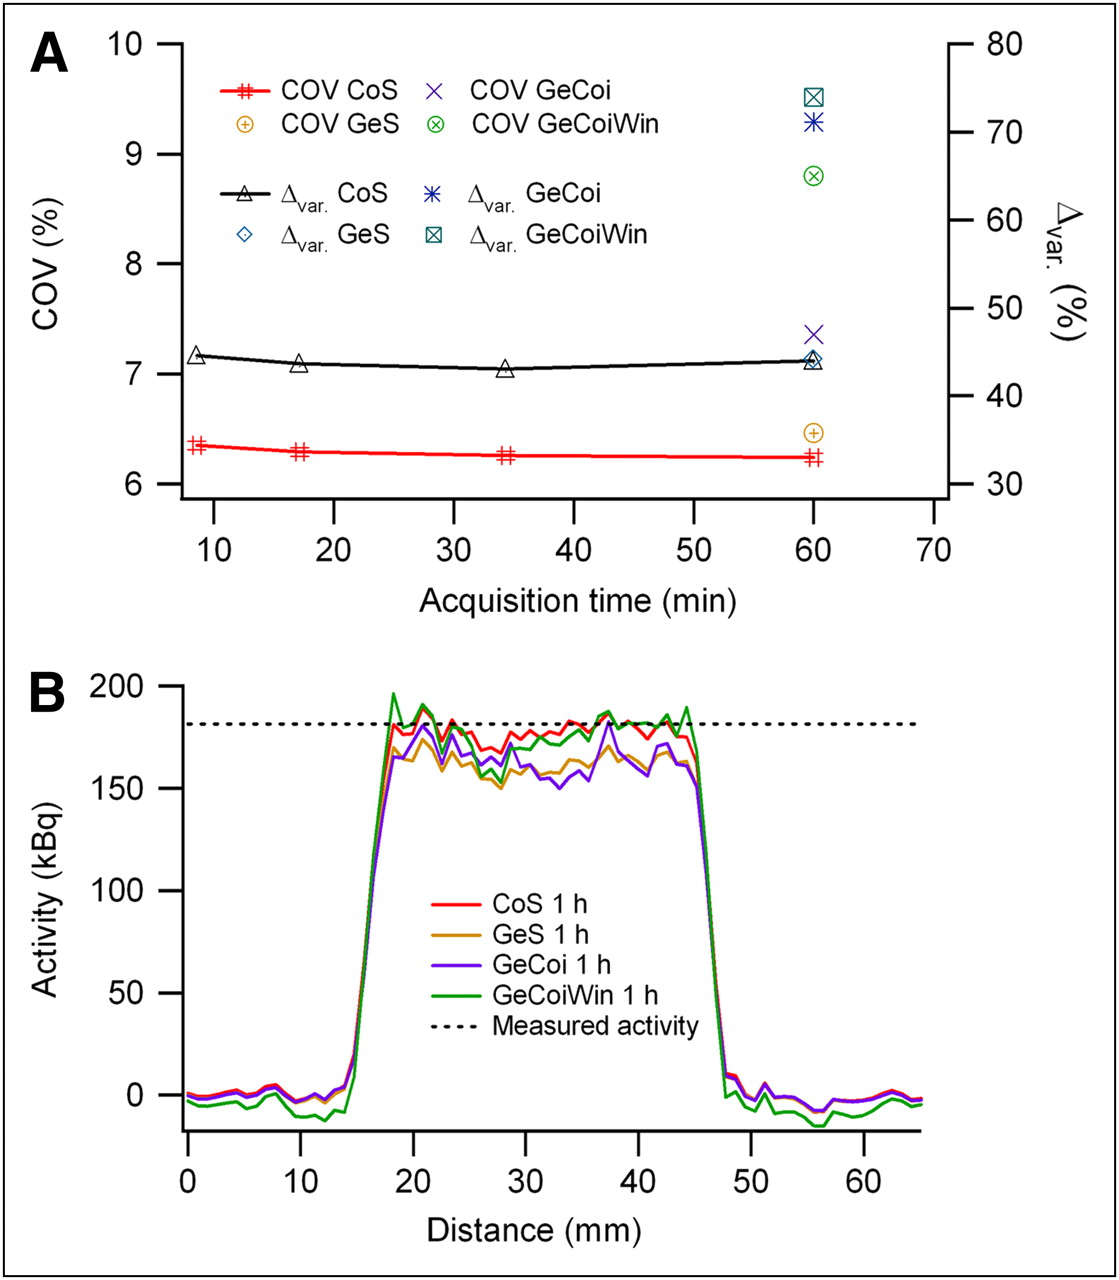
For the various transmission methods, the average, maximum, and minimum activity concentration values and the %SD measured in the uniform region of the phantom are reported in Table 1; COV and Δvar are presented in Figure 1A; and profiles across this region are given in Figure 1B. COV and Δvar of the uniform slices were the lowest for CoS and slightly increased with the reduction in CoS acquisition time (Fig. 1A).

Uniform part of phantom for different transmission modes: COV and Δvar (A) and examples of profiles along slice diameter (B).
Average (Mean), Maximum, and Minimum Activity Concentration and %SD in Uniform Region of Emission Images
Evaluation of Transmission Measurements
The values of the mean water attenuation coefficient obtained from the transmission reconstructed slices of the phantom uniform part are reported in Figure 2 for the measurements with both sources. The highest value was obtained with CoS, with a low dependence on the acquisition time. Examples of attenuation images and profiles for the different transmission modes are given in Supplemental Figure 1 (supplemental materials are available online only at http://jnm.snmjournals.org).
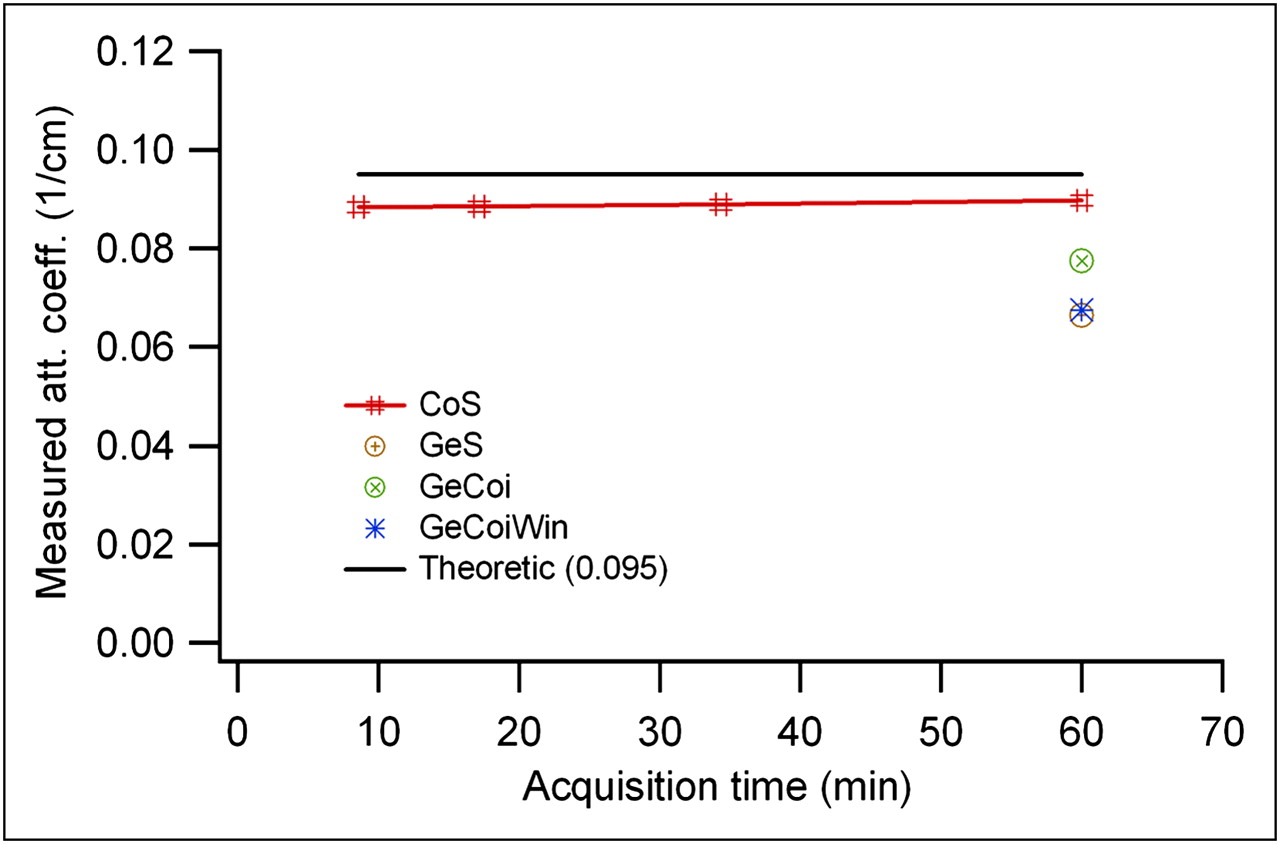
Measured linear attenuation coefficients (att. coeff.) as function of acquisition time for different acquisition modes with 57Co and 68Ge sources.
RCs
The RCs for each phantom hot rod were calculated (Table 2). RCs measured from emission images corrected for all effects except scatter did not depend on the transmission measurement method. This held true when scatter correction was applied, with the only exception being the GeCoiWin method for which higher RC values were observed, especially for the larger rods (≥3 mm).
Recovery Coefficient
Accuracy of Corrections
SOR and %SD measured for the nonemitting compartments on emission images corrected for all effects are given in Table 3 for the different transmission methods. With the exception of GeCoiWin, for which the SOR value was largely negative, SOR values close to zero were obtained for the water compartment. For the air compartment, a value close to zero was obtained with CoS. Positive values were obtained with GeS and GeCoi, and a negative value was obtained with GeCoiWin.
SOR (%) and %SD in Water and Air Cylinders for Fully Corrected Emission Images
2D Reconstruction Methods
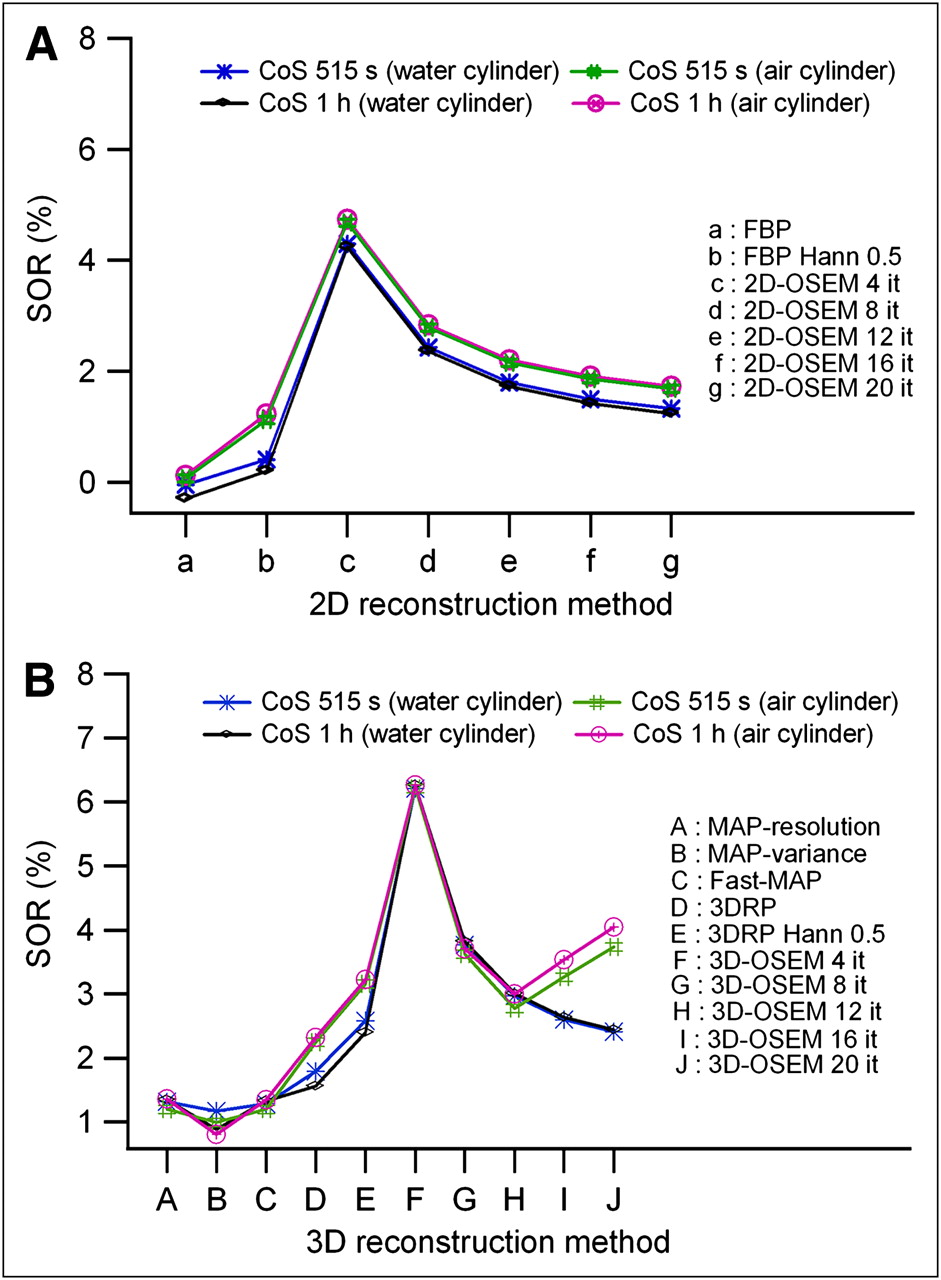
Several 2D reconstruction methods were applied to the fully corrected Fourier rebinned 2D sinograms using attenuation correction from the 515-s and 1-h CoS measurements. The reconstruction method had little effect on the mean activity (Fig. 3A). The use of the Hanning filter in FBP lowered the dispersion of the reconstructed pixel values, and the increase in the number of OSEM iterations increased the dispersion (Figs. 3A and 3B). Figures 4A and 5A show the variation of the RC for the 2- and 4-mm rods and the variation of the SOR for nonemitting compartments as a function of the 2D reconstruction methods. RC decreased when the Hanning filter was applied in FBP. Higher RCs were obtained with OSEM reconstruction than with FBP, but RC did not depend on the number of iterations. The lowest SOR was obtained for the images reconstructed with FBP (ramp filter). Slightly higher SOR values were obtained when the Hanning filter was used in FBP. Higher SOR values were recorded for OSEM reconstruction, although the SOR decreased with the increase in the number of iterations. The SOR was always higher for the air compartment than for the water compartment. RCs and SORs did not depend on the duration of the CoS transmission scan.

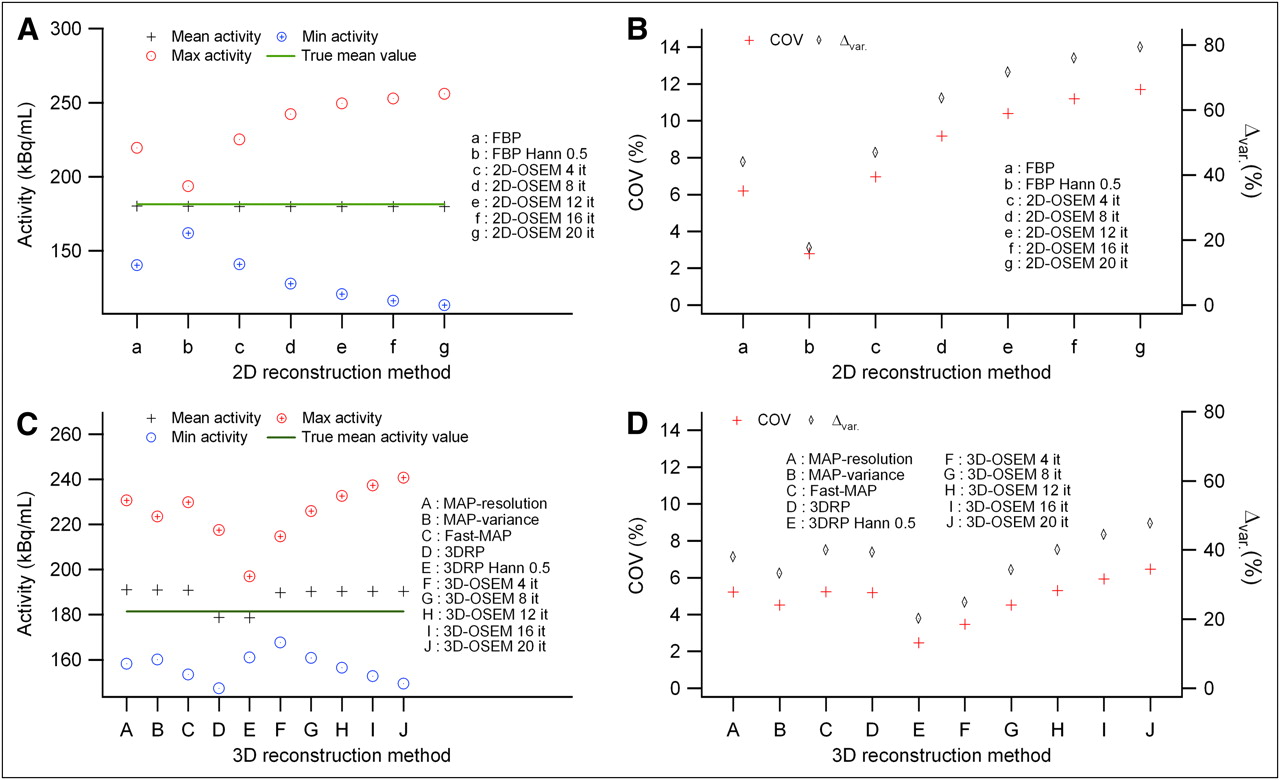
Activity concentration and COVs measured in uniform part of phantom as function of reconstruction methods: activity vs. 2D methods (A), COV vs. 2D methods (B), activity vs. 3D methods (C), and COV vs. 3D methods (D).
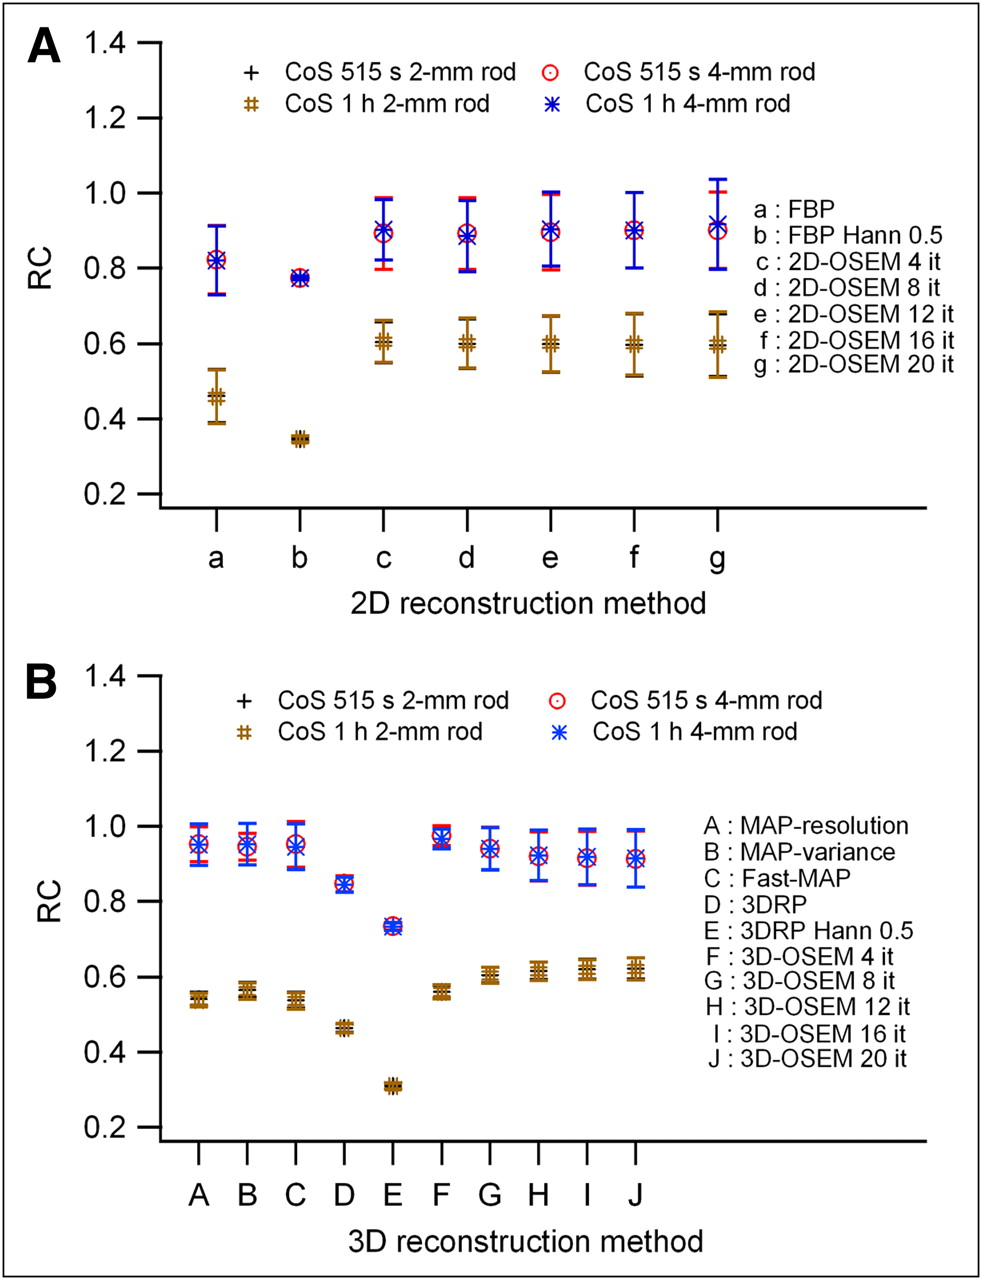
RCs of 2- and 4-mm rods measured as function of 2D (A) and 3D (B) reconstruction methods.

SORs for nonemitting air and water compartments as function of 2D (A) and 3D (B) reconstruction methods.
3D Reconstruction Methods
The various 3D reconstruction methods implemented in the F-120 software were applied to the 3D fully corrected sinograms. Attenuation was obtained from the CoS 515-s and 1-h transmission measurements. The iterative methods gave a nearly identical mean pixel value, which was about 7% higher than the value obtained with the 3D analytic method (Fig. 3C). Hanning filtering in 3DRP lowered the dispersion of the pixel value, and increasing the number of iterations in 3D-OSEM increased the dispersion (Figs. 3C and 3D). The dispersion was almost identical for MAP resolution and Fast MAP and slightly lower for MAP variance. RCs (Fig. 4B) were larger for 3D iterative methods than for 3DRP. Applying the Hanning filter in 3DRP lowered the RC. The RC varied slightly with the iterative method used and with the number of 3D-OSEM iterations. SORs for the air and water nonemitting compartments were plotted as a function of 3D reconstruction methods in Figure 5B. For both compartments, the lowest SOR values were obtained with the 3 MAP reconstruction methods, with MAP variance producing the lowest ones. The 3DRP algorithm generated larger SOR values in air than in water. 3D-OSEM generated the highest SOR values. For the water compartment, the SOR decreased with the increase in the number of 3D-OSEM iterations. For the air compartment, the SOR was almost identical to the value for the water compartment and decreased with the increase in the number of 3D-OSEM iterations up to 12 iterations. Then the SOR for the air compartment increased with the number of iterations and became larger than the SOR for the water compartment. The transmission time had almost no effect on the various measured parameters (Figs. 4B and 5B).
DISCUSSION
Several instrument and processing factors interplay in a complex way in the generation of PET images. Therefore, measuring the performance of each individual step involved in the process is not a sufficient predictor of the final IQ. However, these images and their accuracy in reproducing the distribution of radioactivity in the body are the only aim of most PET system users. It is, therefore, an absolute necessity to establish unified procedures for IQ determination under realistic conditions (28). Although such procedures exist for PET systems devoted to human studies (29,30), they were lacking for small-animal PET scanners. Although the recently released NEMA NU4-2008 performance tests (15) establish standardized procedures for measuring instrument performance in resolution, scatter fraction, counting rates, and sensitivity, they also describe a method to evaluate the overall IQ of small-animal PET scanners, in conditions mimicking a whole-body acquisition in a small rodent with hot lesions and uniform hot and cold areas.
The aim of this study was to apply the NEMA IQ test (15) to the F-120. The parameters recommended by the scanner manufacturer were used where possible for the data acquisitions, because these parameters were probably the ones used by most end-users. The manufacturer recommendations were applied to the choices of the energy windows, coincidence window, and the histogramming parameters; to the blank scan acquisition; and to the scanner normalization and calibration procedures. Previous studies have demonstrated that most of these recommendations were the optimum choice. For example, this was the case with the energy (350–650 keV) and timing (6 ns) window settings (6,11). The effect of the emission scatter correction was analyzed because it has been claimed that scatter contamination is low for small rodent studies (20) and should not necessarily be corrected (6).
Transmission Measurement Method
Attenuation correction is a requirement in most of the quantitative animal studies. Indeed, without attenuation correction, quantification errors in the range of 20%−40% were observed for mouse- and rat-sized phantoms (10,20,31). A previous study (10) concluded that CoS seemed to be the most suitable method for transmission measurement with the Focus 220, which uses the same detectors and electronics as the F-120 but has a larger transaxial field of 22 cm. This study was conducted not only with a larger-bore scanner but also with non-NEMA phantoms. It was therefore decided to investigate the 4 transmission methods available for the F-120, using the NU4 IQ phantom. Again, the transmission parameters were those recommended by the manufacturer, with the exception of the CoS measurements, for which the acquisition time was varied. The attenuation coefficient of water (Fig. 2) was the closest to the theoretic value of 0.095 cm−1 (10) with the CoS method. It decreased from 0.0897 to 0.0885 cm−1 when the CoS transmission time was lowered from 1 h to the minimal value (515 s) allowed by the scanner. Lower attenuation values were obtained when using the 68Ge source, in all modes. These results agree with those reported previously for the Focus 220 (10) and 120 (32,33). Lehnert et al. (10) concluded that 68Ge-based transmission measurements needed scatter correction and that the transmission scatter-correction algorithm used was not sufficiently accurate. More recently, Vandervoort and Sossi (32,33) came to the same conclusion for the singles mode with either a 68Ge or a 57Co source. For the F-120 and with GeS, they reported a value of 0.068 cm−1 for the attenuation coefficient of water, whereas we obtained a value of 0.066 cm−1. However, both reconstruction methods (MAP vs. FBP) and phantom size (50- vs. 30-mm diameter) were different and it is therefore difficult to further compare the results (10,32,33).
When reconstructing the data with FORE and FPB and applying all corrections, the activity concentration in the uniform part of the phantom was underestimated by 0.75% for CoS, 1.90% for GeCoiWin, 9.29% for GeS, and 7.25% for GeCoi (Table 1). However, the %SD, COV, and Δvar were largely higher for GeCoiWin than for CoS (Fig. 1A). Also, the activity concentration (Table 1) was higher with GeCoiWin than with GeCoi, despite the higher attenuation coefficient (Fig. 2) provided by GeCoi. The scanner was calibrated with a cylinder with a diameter (30 mm) and specific activity (145 kBq/mL) close to those of the IQ phantom and with CoS, which plays a role in the accuracy of mean activity concentration values.
The RCs were almost transmission method–independent (Table 2). The only noticeable exception was for the case of GeCoiWin, for which scatter correction of the emission data resulted in a higher RC. This higher value resulted mainly from the decrease of the uniform region activity after scatter correction (Table 1). Recently, Bao et al. (13) reported RCs of 0.17, 0.48, 0.72, 0.84, and 0.93 for the 5 rods of the NU4 IQ phantom imaged with the Inveon scanner, which has transaxial spatial resolutions similar to those of the F-120 (14). They also reconstructed their data with FORE and FBP, but they derived the attenuation-correction sinograms from a micro-CT scan. The SORs (Table 3) obtained with CoS were close to zero. This held true for the water compartment for GeS and GeCoi. With GeCoiWin, largely negative values were observed. The results for both RCs and SORs seem to indicate that the scatter-correction methods do not work properly with GeCoiWin. Recently, we learned from the manufacturer that incorrect transmission data are likely to be produced in coincidence mode because of a software bug (David L. Bailey, written communication, May 28, 2009). These incorrect transmission data could explain why the mean activity was close to the expected value with GeCoiWin whereas the measured attenuation coefficients were too low. Imperfect scatter correction in air with GeS and GeCoi was indicated by the positive SOR value.
In addition, Laforest et al. (11) obtained positive, but different, SORs for air and bonelike nonemitting compartments using FORE + FBP reconstruction with scatter and calculated attenuation corrections for a cylindric phantom of twice the diameter of the NU4 phantom. No value was reported for a water nonemitting compartment. Bao et al. (13), using the Inveon, FORE, and FBP and a micro-CT–derived attenuation correction, obtained for the NU4 phantom an SOR value of −0.57% for the water compartment and 1.65% for the air compartment.
Transmission measurement with the 57Co source seemed to be the most appropriate method for the F-120. This method gave the most accurate activity value, with the lowest noise and the best scatter correction in cold regions in the images of the NU4 IQ phantom reconstructed with FORE and FBP. Moreover, CoS, compared with the Ge-based method, largely allowed shorter measurement times. Lehnert et al. (10) came to the same conclusions for the Focus 220 from measurements made with larger-diameter phantoms. Two additional advantages of using 57Co instead of 68Ge are the much lower contamination from the emission in the transmission data when performing postinjection transmissions and the better contrast between attenuation coefficients for various materials at 122 keV (32).
Reconstruction Methods
It is unlikely that all animal studies will be reconstructed using FORE and FBP with a ramp filter cutoff at Nyquist frequency. A smoothing filter will probably be used in analytic reconstructions, or an iterative reconstruction algorithm will be preferred in many cases. In the NU4 protocol, the reconstruction should be performed with the method and the parameters recommended by the manufacturer. Such recommendations did not appear to exist for the F-120. It was therefore decided to reconstruct the phantom emission data with the various methods available in the F-120 software. Following the conclusions of the first part of this study, we obtained the attenuation correction using only the CoS data.
The mean activity was within 99% of the expected value for the analytic reconstruction methods and FORE + OSEM (Figs. 3A and 3C). However, a value overestimated by 5% was obtained with 3D-OSEM and MAP (Fig. 3C). The low-pass Hanning filter decreased the noise in the analytic reconstructions, and the well-known increase in noise with the number of iterations (34) was observed for OSEM reconstructions (Figs. 3B and 3D). In agreement with previous results (23), RCs (Fig. 4) were lower with the analytic than with the iterative reconstruction methods. RC decreased when the smoothing Hanning filter was used. The RCs were almost identical for FORE + OSEM, 3D-OSEM, and MAP and changed only slightly when the number of OSEM iterations was increased from 4 to 20. This observation is in agreement with the expected fast convergence of OSEM for hot regions in a null background (20). MAP reconstruction did not improve the contrast recovery, although it has been reported that the spatial resolution was improved and made more uniform across the field of view with this method (22). SORs (Fig. 5) were zero only for FORE + FBP. Positive values were observed for all other reconstruction methods. SORs decreased with the increase in the number of OSEM iterations, whereas the RC hardly changed with the number of iterations. This again shows the slowest convergence of OSEM in cold rather than in hot areas (20). The lowest SOR values for fully 3D reconstruction were obtained with the 3 MAP algorithms. The differences in SOR between the water and the air compartments were the smallest with FORE + FBP, MAP resolution, Fast MAP, and 3D-OSEM up to 12 iterations and were the largest for 3D-OSEM with more than 12 iterations. The reconstructions with FORE and a 2D method were 1 order of magnitude faster than the 3D reconstructions.
On the basis of the results obtained with the NU4 IQ phantom, FORE and a 2D reconstruction method seemed to be a good compromise between overall IQ and reconstruction time: OSEM provided the largest contrasts, but FBP provided superior attenuation and scatter correction for this phantom. It should also always be kept in mind that the quality of images reconstructed with iterative algorithms such as OSEM depends on the object size and on the contrasts present in the object (20). The NU4 IQ phantom was designed to mimic a mouse whole-body or rat brain study. Therefore, the above conclusion holds only for these studies, which are the main activity of our laboratory.
CONCLUSION
The IQ of the F-120 was evaluated using the standardized method described in NEMA NU4-2008. 57Co singles transmission appears to be the best and most convenient method for attenuation correction. Although more sophisticated fully 3D reconstruction methods are available, FORE and a 2D reconstruction method seems to represent a good compromise between overall IQ and reconstruction time for studies of small rodents with the F-120. Thanks to the wide range of methods used for attenuation correction and emission reconstruction in this study, the results should be helpful for future comparison with other small-animal PET devices.
Acknowledgments
The authors are grateful to the FRS-FNRS Belgium for financial support (Grant 3. 4551.08F). Mohamed Bahri is a “Collaborateur logistique FRS-FNRS,” and Alain Plenevaux is senior research associate from FRS-FNRS Belgium.
Footnotes
-
COPYRIGHT © 2009 by the Society of Nuclear Medicine, Inc.
References
- Received for publication March 6, 2009.
- Accepted for publication July 10, 2009.


Jump to section
Related Articles
Cited By...
- Neuro-functional correlates of protective effects of wheel-running exercise against cocaine locomotor sensitization in mice: a [18F]fallypride microPET study
- Performance Assessment of a Preclinical PET Scanner with Pinhole Collimation by Comparison to a Coincidence-Based Small-Animal PET Scanner
- Evaluation of 18F-UCB-H as a Novel PET Tracer for Synaptic Vesicle Protein 2A in the Brain
- In Vivo PET/CT in a Human Glioblastoma Chicken Chorioallantoic Membrane Model: A New Tool for Oncology and Radiotracer Development
- Performance Evaluation of the FLEX Triumph X-PET Scanner Using the National Electrical Manufacturers Association NU-4 Standards