


Abstract
A prospective study was undertaken to evaluate PET with 18F-fluoride for monitoring the response to bisphosphonates in Paget’s disease of bones. Methods: Fourteen patients with a monostotic (n = 9) or a polyostotic form (n = 5) of Paget’s disease were scanned at baseline and at 1 and 6 mo after the beginning of treatment. Dynamic acquisition and arterial blood sampling were used to calculate the influx constant Ki (by both the Patlak [Ki-PAT] method and the nonlinear regression [Ki-NLR] method). Kinetic modeling was compared with maximal standardized uptake values (SUVmax) and biochemical markers of bone remodeling. Results: Baseline uptake of 18F-fluoride by pagetic bones was significantly higher than in normal bones (P < 0.05). One month after the start of treatment, SUVmax, Ki-PAT, Ki-NLR, and K1 (the unidirectional clearance of fluoride from plasma to the whole of the bone tissue) decreased significantly by 27.8%, 27.9%, 27.5%, and 23.6%, respectively. Biochemical markers were already normalized in 6 of 9 patients with monostotic disease, although all had high 18F-fluoride uptake values. Six months after the start of treatment, 18F-fluoride uptake further diminished by 22.3%–25.6%. Biochemical markers were normal in all but 2 patients, although 10 of 14 patients still showed high 18F-fluoride uptake. One patient did not respond to treatment and maintained high uptake of 18F-fluoride throughout the study. SUVmax correlated with both Ki-PAT and Ki-NLR at baseline, 1 mo, and 6 mo (P < 0.05). Moreover, the change of SUVmax between baseline and 1 mo, as well as between baseline and 6 mo, also correlated with the change of Ki-PAT and Ki-NLR (P < 0.05). Conclusion: Our results show that 18F-fluoride PET can be used to noninvasively and accurately monitor the efficacy of treatment with bisphosphonates in Paget’s disease of bones. SUVmax correlates with Ki-PAT and Ki-NLR and, interestingly, varies in the same manner as kinetic indices. Therefore, the use of SUVmax could avoid the need for dynamic acquisition and arterial blood sampling and would facilitate the use of whole-body PET in a clinical setting.
PET using 18F-fluoride was introduced in the 1990s to quantify bone formation (1). 18F-Fluoride is taken up by mineralizing bone in proportion to osteoblastic activity. Using dynamic acquisition, arterial blood sampling, and kinetic modeling, PET fluoride has been used to study normal and pathologic bone metabolism. In a pig model, 18F-fluoride parameters were found to correlate with histomorphometric indices of bone formation (2). Schiepers et al. reported that the influx constant Ki varied according to the type and extent of bone disease (3): Ki values were the highest in Paget’s disease and the lowest in osteoporotic bones. Cook et al. showed that Ki and K1 (the unidirectional clearance of fluoride from plasma to the whole of the bone tissue) were high in pagetic bones, reflecting the increase of blood flow and bone mineralization that characterize this disease (4). The same group showed that PET fluoride could be used to monitor the therapeutic response of osteoporotic bone to bisphosphonates (5).
Paget’s disease of bone is a benign disease characterized by an accelerated turnover—that is, bone resorption and formation. Modern treatment of Paget’s disease relies on bisphosphonates, which are powerful blockers of bone remodeling (6). Clinicians usually evaluate the response to treatment by measuring blood or urine markers of bone resorption or formation (e.g., telopeptides and alkaline phosphatases) (7). However, these biochemical markers can be normal in the monostotic form of Paget’s disease and cannot be used as a reliable index of the disease activity. An accurate and noninvasive method that would allow one to measure the disease activity would be welcome and could help the clinician to decide whether the treatment should be prolonged or cancelled in any given patient. As used and validated in previous studies, PET fluoride is an invasive procedure because arterial blood sampling is required for full kinetic modeling. As an alternative to arterial catheterization, Cook et al. showed that the input function could be derived from a region of interest (ROI) drawn over the left ventricle or the thoracic aorta (8). This method is applicable only for bones included in the field of view encompassing the midthoracic region and still requires a dynamic acquisition. The most popular index for PET quantification is the standardized uptake value (SUV), which basically averages the tracer uptake with respect to the injected dose and the body weight. Calculation of the SUV does not require an arterial input function or a dynamic acquisition. A static image performed after a period of tracer incorporation is sufficient. In oncology, the SUV corrected for body weight and other simple semiquantitative indices have been used extensively to measure tracer uptake and evaluate the response to antineoplastic drugs and were found to correlate well with full kinetic modeling (9). For the assessment of bone formation by PET fluoride, the SUV was found to correlate well with full kinetic modeling in both normal and pathologic bone (10). However, to our knowledge, to date no study has compared kinetic modeling and the SUV for measuring the response to treatment in pathologic bones—especially the response to bisphosphonates.
In this prospective study, we evaluated PET fluoride in Paget’s disease. We studied the feasibility and accuracy of PET fluoride to monitor the response to bisphosphonates. Moreover, we wanted to evaluate whether a simple semiquantitative index—that is, SUV—could supersede kinetic modeling in that indication.
MATERIALS AND METHODS
Patient Population
We prospectively included 14 patients (5 women, 9 men), with a mean age of 66.5 y (range, 41–84 y). Nine patients had a monostotic form and 5 had a polyostotic form of Paget’s disease, as demonstrated by bone scintigraphy and radiographic studies. A single bone lesion was evaluated in each patient: scapula (n = 1), lumbar spine vertebra (n = 1), femur (n = 4), tibia (n = 4), and iliac bone (n = 4). In polyostotic patients, the most active lesion (based on clinical history, previous bone scintigraphy, or radiography) was selected for the study.
Patients were studied at baseline and at 1 and 6 mo after the start of treatment with bisphosphonates. Five patients received oral risedronate, 30 mg/d for 2 mo; 6 patients received intravenous injection of pamidronate, 60 mg (2 patients received 2 injections); 2 patients received 1 injection of zoledronic acid, 5 mg; and 1 patient received oral tiludronate, 400 mg/d for 3 mo (Table 1).
Patient Characteristics
The study protocol was approved by the local ethics committee. All patients gave written informed consent.
Biochemical Markers
At each time point of the study, serum total and bone-specific alkaline phosphatase (tAlk and bAlk) were measured as markers of bone formation. Serum cross-linked C-telopeptides of type I collagen (CTX) and second-morning void urinary cross-linked N-terminal telopeptides of type I collagen, corrected for creatinine (NTX), were measured as markers of bone resorption. Patients were fasting when blood and urine samples were collected.
PET Procedure
18F-Fluoride ion was produced by bombarding a target of enriched H218O with 10.5-MeV protons (p,n reaction). At the end of bombardment, the activity (about 4.6 GBq) was automatically transferred to a vial containing normal saline. The solution was then sterilized by passing through a Millipore filter (0.22 μm) into a sterile multidose vial.
At baseline, a radial arterial line was inserted under local anesthesia to collect blood samples and measure the input curve. For practical reasons and to reduce the burden of the study, we did not repeat the radial catheterization at each time point of the study; therefore, we used the initial input curve of the patient to calculate the input function of subsequent dynamic studies. We assumed that the input curve of 18F-fluoride is dependent on the cardiac function that remained stable throughout the study. An intravenous line was inserted in the contralateral forearm.
At each time point of the study, patients were carefully positioned on the PET device (ECAT HR 961; CTI) so that the pagetic bone was in the center of the field of view. The ECAT HR 961 is a high-resolution tomograph with a 15-cm axial field of view allowing simultaneous imaging of 47 transaxial slices in 2-dimensional mode (slice thickness, 3.125 mm), with a nominal in-plane resolution of 5-mm full width at half maximum (FWHM) (11). Before injection of the tracer, a 15-min transmission scan was obtained for subsequent attenuation correction.
The injection of the tracer was standardized to minimize the difference in time-to-peak plasma activity. A mean dose of 397 ± 40.7 MBq (10.75 ± 1.1 mCi) of Na18F diluted in 5 mL of saline solution was injected over 30 s with an infusion pump. Dynamic acquisition was started at midinjection. The catheter was then flushed with 20 mL saline solution.
The acquisition protocol consisted of a dynamic sequence of 12 frames of 10 s, 4 frames of 30 s, and 14 frames of 240 s.
All images were corrected for dead time, random, decay, scatter, and attenuation and reconstructed using filtered backprojection (cutoff frequency, 0.5; FWHM, 6 mm).
Blood Sampling
Arterial blood samples were obtained in all but one patient whose radial artery could not be catheterized. This patient (patient 11) agreed to come back on another day to undergo a dynamic PET acquisition centered on the thorax, so that we could use the cardiac cavity to measure an image-derived input curve.
Arterial blood samples (approximately 0.3 mL each) were obtained every 3–6 s for the first 2 min and then at longer intervals for the duration of the study.
Blood samples were centrifuged and plasma activity was counted in a γ-well-counter previously cross-calibrated against the PET scanner.
Data Processing
Regions of interest (ROIs) were drawn on the last frame image (i.e., 56–60 min after injection). The image of the pagetic bone was visually inspected and the 5 planes displaying the highest uptake were averaged to increase the statistics, improve the image quality, and facilitate the ROI placement. A polygonal ROI was drawn to closely encompass the area of highest uptake. A mirror ROI was put over the contralateral unaffected bone (or over the adjacent vertebra) (Fig. 1). The mean ROI size was 79 pixels, corresponding to a mean area of 34 cm2. The size of the smallest region used was 4 cm2. In patient 1, because the disease affected both femurs, it was not possible to collect a normal value. In patient 3, the control unaffected bone was not visible because of the very high uptake in the pagetic tibia. This impeded accurate placement of the ROI over the normal bone.
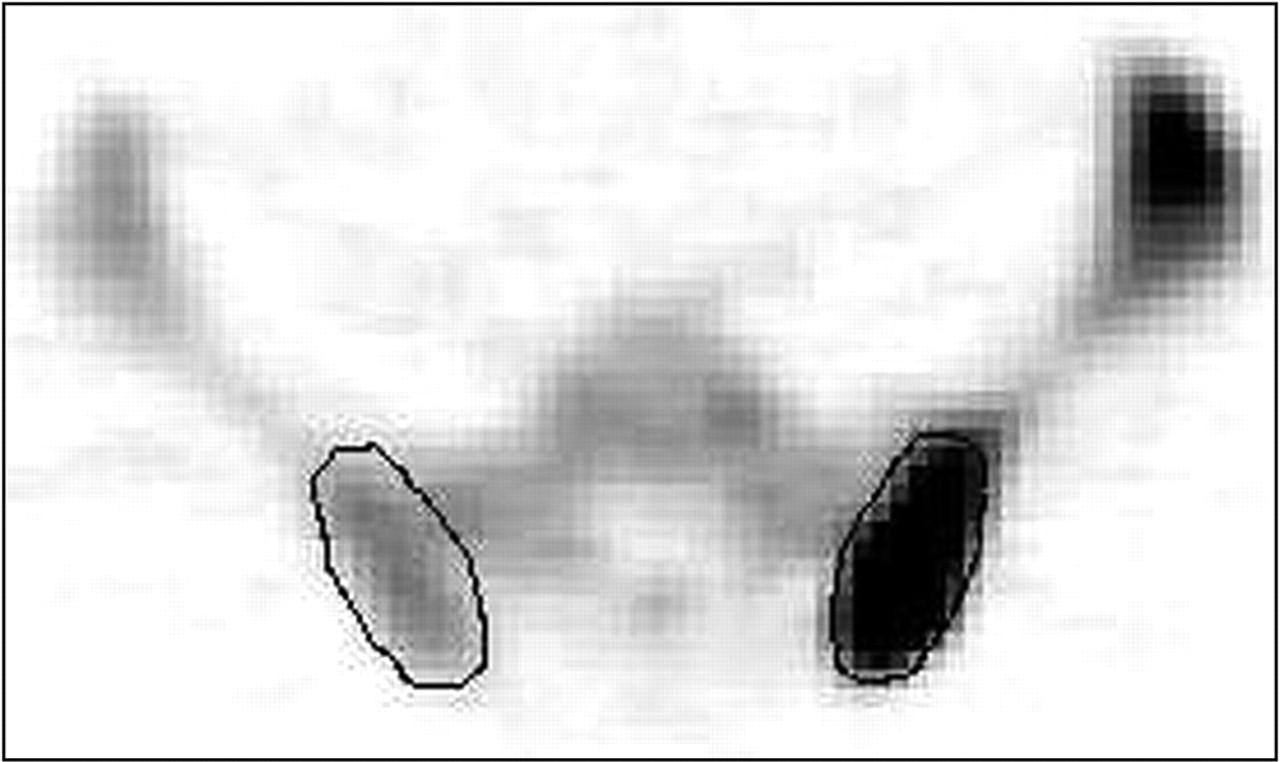
Illustration of the method used to draw ROIs on pagetic and normal contralateral bone. The region was manually drawn to closely encompass the area of highest uptake in the left ilium (on right side of axial image). A mirror ROI was drawn over contralateral nonaffected bone.
At each time point of the study, care was taken to draw the ROIs at the same level of both pagetic and contralateral bone.
The skeletal 18F-fluoride kinetic parameters were measured using the 3-compartmental tracer kinetic model described by Hawkins et al., which also holds for pathologic bone (1,3). The 3 compartments are the plasma, the bone extracellular fluid compartment, and the bone mineral compartment.
The model allows the estimation of the following rate constants: K1 is the unidirectional clearance of fluoride from plasma to the whole of the bone tissue (and directly correlated with blood flow), k2 is the reverse transport of fluoride from the extravascular compartment back to plasma, k3 is the incorporation of fluoride into the bone mineral compartment, and k4 is the release of fluoride from the bone mineral compartment.
Ki represents the net uptake of fluoride to the bone mineral compartment and reflects the level of osteoblastic activity in bone. It can be calculated by means of nonlinear regression analysis from the estimated values of the individual parameters and is then represented by: Ki = (K1 × k3)/(k2 + k3) (mL/min/mL). Ki/K1 can be used to represent the fraction of the tracer that undergoes specific binding to the bone mineral.
Ki can also be calculated by the Patlak graphical method, providing that the demineralization (i.e., the release of fluoride from the mineral bone)—the k4 constant—is equal to zero, which is a fair assumption in our experimental setting. Indeed, we studied the kinetics of 18F-fluoride for 60 min and it has been shown that the average half-time for turnover of bound fluoride is very much longer—that is, 65 ± 105.3 h (1). Both methods were used to calculate Ki; these values are noted as Ki-NLR and Ki-PAT, respectively. For the Patlak analysis, the equation was applied to the linear part of the time–activity curve—that is, between 4 and 60 min (frames 17–30). The same time was used for all skeletal sites, all patients, and all time points of the study.
SUVs were calculated with the following formula: SUVmax = maximal activity in the ROI × calibration factor × patient’s weight (in kg)/injected activity (in MBq [mCi]).
The maximal activity within the ROI was used to avoid the risk of underestimating the activity because of region misplacement. Indeed, with a tracer with such a high signal-to-noise ratio, even a slight ROI misplacement can lead to a significant decrease of the mean activity because the tissue surrounding the bone shows no uptake at all.
Finally, the ratio of pagetic bone to control bone (P/C ratio) was calculated for every parameter, SUVmax, Ki-NLR, and Ki-PAT.
Statistical Analysis
The Wilcoxon signed rank sum test was used to estimate statistically significant differences between pagetic and control bones at each time point of the study. The same test was used to evaluate the significance of changes induced by treatment. P < 0.05 was considered significant. The relationship between individual biochemical markers and PET quantitative indices, as well as between their variations with treatment, was addressed by the Pearson correlation test.
RESULTS
PET 18F-Fluoride Quantitative Parameters
Individual quantitative parameters are detailed in Table 2. At baseline, a large range of 18F-fluoride uptake was noted in normal bones: Ki-PAT ranged from 0.004 to 0.026 mL/min/mL, Ki-NLR from 0.005 to 0.034 mL/min/mL, and SUVmax from 1.94 to 14.28. The highest values were observed in iliac bone, scapula, and vertebra, whereas the lowest values were seen in tibia and femur. This reflects the greater bone turnover in trabecular bones (e.g., vertebra), as compared with tibia or femur, which are predominantly cortical bones. Baseline Ki-PAT, Ki-NLR, K1, Ki/K1, and SUVmax were statistically higher in pagetic than in normal bones (P < 0.05) (Table 3). The rate constants k2, k3, and k4 were not statistically different in pagetic and normal bones. A large range of fluoride uptake was also observed in pagetic bones, reflecting differences in disease activity at the time of the study. Ki-PAT ranged from 0.016 to 0.476 mL/min/mL, Ki-NLR ranged from 0.017 to 0.523 mL/min/mL, and SUVmax ranged from 6.99 to 77.8. On average, Ki-NLR was higher than Ki-PAT by 12% in pagetic bones (P < 0.05) and by 14% in normal bones (P < 0.05). The mean P/C ratio was 5.91 for SUVmax, 7.32 for Ki-PAT, and 7.25 for Ki-NLR.
Individual SUVmax, Ki-PAT, and Ki-NLR for Pagetic and Normal Bones at Baseline and at 1 and 6 Months After Start of Treatment
SUVmax, Ki-PAT, Ki-NLR, and Rate Constants in Pagetic and Normal Bones
One month after the start of bisphosphonate treatment, PET quantitative parameters of pagetic bones decreased in 13 of 14 patients. SUVmax, Ki-PAT, Ki-NLR, and K1 decreased by 27.84%, 27.87%, 27.48%, and 23.58%, respectively (P < 0.05). Ki-NLR was higher than Ki-PAT by 11% in pagetic bones (P < 0.05) and by 17% in normal bones (P < 0.05). The rate constants k2, k3, and k4 did not change significantly. The ratio Ki-NLR/K1 remained constant at 0.722 (compared with 0.718 at baseline), showing that the mineralization fraction remained constant. In normal bones, 18F-fluoride uptake remained constant, resulting in decreased P/C ratios of 3.69 for SUVmax (−37.56%), 4.84 for Ki-PAT (−33.90%), and 4.51 for Ki-NLR (−37.70%), respectively (P < 0.05). The nonresponder patient (patient 5, polyostotic disease) had an increase of SUVmax (+27.85%) and almost stable Ki-PAT (−1.42%), Ki-NLR (−6.17%), and K1 (+2.96%).
Six months after the start of treatment, SUVmax, Ki-PAT, Ki-NLR, and K1 decreased by 24.94%, 22.30%, 25.59%, and 25.59%, respectively, as compared with the 1-mo values. Ki-NLR was higher than Ki-PAT by 6% in pagetic bones (P < 0.05) and by 16% in normal bones (P < 0.05). Interestingly, the uptake of 18F-fluoride continued to decrease between 1 and 6 mo in the 6 patients with a single-injection intravenous treatment (patients 1, 2, 9, 11, 12, and 13). The overall decrease (baseline to 6 mo) was thus −44.64% for SUVmax, −42.75% for Ki-PAT, −45.27% for Ki-NLR, and −45.84% for K1. K1 measured at 6 mo in pagetic bone was no longer significantly different from K1 measured in the normal bone (0.087 vs. 0.047, P = nonsignificant; Table 3). The rate constants k2, k3, and k4 did not change significantly compared with those at 1 mo. The Ki-NLR/K1 ratio at 6 mo was 0.726, unchanged as compared with baseline and the 1-mo value, and significantly higher than the ratio measured in normal bone. P/C ratios were 2.76 for SUVmax (−25.29%), 3.93 (−18.76%) for Ki-PAT, and 3.46 for Ki-NLR (−23.40%) (P < 0.05). All 3 P/C ratios were close to 1 in 3 patients. In the remaining 11 patients, there was still clear evidence of disease activity. Patient 5 did not respond to treatment: The overall change (baseline to 6 mo) was +5.81% for SUVmax, −0.71% for Ki-PAT, and −8.22% for Ki-NLR.
Correlations Between SUVmax and Kinetic Parameters
At baseline, SUVmax was significantly correlated with both Ki-PAT and Ki-NLR (r2 = 0.54 and 0.55, respectively; P < 0.05). One and 6 mo after the start of treatment, SUVmax remained significantly correlated with Ki-PAT (r2 = 0.53 and 0.72 for 1 and 6 mo, respectively; P < 0.05) and with Ki-NLR (r2 = 0.53 and 0.75, respectively; P < 0.05) (Fig. 2). Ki-PAT and Ki-NLR were strongly correlated (r2 = 0.99; P < 0.05) at all time points of the study.

Correlations between SUVmax and Ki-PAT or Ki-NLR at baseline (A), 1 mo (B), and 6 mo (C) after start of treatment. All correlations were statistically significant (P < 0.05).
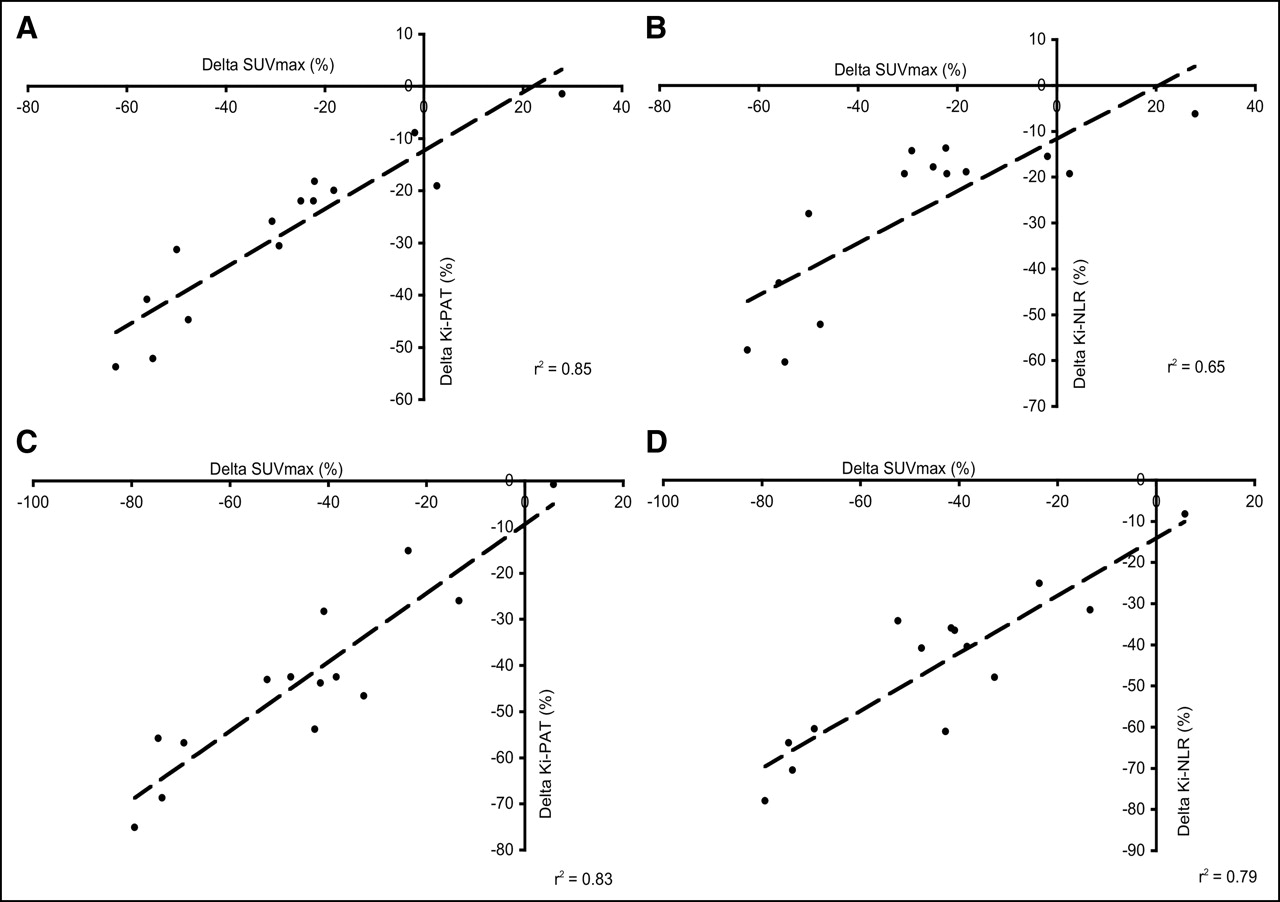
Changes in SUVmax under treatment (baseline to 1 mo and baseline to 6 mo) were correlated with changes of Ki-PAT (r2 = 0.85 and 0.83, respectively; P < 0.05) as well as with the changes of Ki-NLR (r2 = 0.65 and 0.79, respectively; P < 0.05) (Fig. 3).

Relationship between change observed in SUVmax, Ki-PAT, and Ki-NLR between baseline and 1 mo after start of treatment (A and B) and between baseline and 6 mo after start of treatment (C and D). All correlations were statistically significant (P < 0.05).
Comparison of PET Parameters with Biochemical Markers
At baseline, the markers of bone remodeling (tAlk, bAlk, CTX, NTX) were above the normal range in all patients with polyostotic disease (n = 5). In patients with monostotic disease (n = 9), tAlk, bAlk, CTX, and NTX were within the normal range in 6 of 9, 3 of 7, 6 of 8, and 2 of 8 patients, respectively. All markers of bone remodeling were significantly higher in patients with polyostotic disease (P < 0.05). The levels of biochemical markers were not correlated to PET SUVmax, Ki-PAT, and Ki-NLR.
One month after the start of treatment, CTX and NTX decreased by 53.45% and 44.43%, respectively. tAlk and bAlk decreased by 14.91% and 16.97%, respectively (Table 4). A weak correlation was found between CTX and SUVmax, Ki-PAT, and Ki-NLR (r2 = 0.35, 0.39, and 0.39, respectively; P < 0.05). NTX also correlated with Ki-PAT (r2 = 0.45; P < 0.05) and Ki-NLR (r2 = 0.46; P < 0.05) but not with SUVmax. bAlk and tAlk did not show any correlation with PET indices. None of the patients with polyostotic disease normalized the biochemical markers after 1 mo of treatment. On the other hand, all biochemical markers were normal at 1 mo in 6 of 9 patients with monostotic disease, although the 18F-fluoride uptake remained high, as measured by an average P/C ratio of 3 for SUVmax, 3.34 for Ki-PAT, and 3.37 for Ki-NLR.
Biochemical Markers of Bone Remodeling at Baseline, 1 Month, and 6 Months After Start of Treatment
Six months after the start of treatment, biochemical markers were within the normal range in all but 2 patients (patients 3 and 5). Patient 5 showed no biologic sign of response at 6 mo, which was in accordance with a stable 18F-fluoride uptake throughout the study. Patient 3 had clear evidence of a response to treatment, as shown by both biology and PET, but had severe polyostotic disease, which might account for the lack of normalization of the biology. No correlation was found between SUVmax and biochemical markers. A weak correlation was observed between CTX and Ki-PAT (r2 = 0.40; P < 0.05) and Ki-NLR (r2 = 0.39; P < 0.05). NTX were also correlated with Ki-PAT (r2 = 0.50; P < 0.05) and with Ki-NLR (r2 = 0.46; P < 0.05).
DISCUSSION
Paget’s disease of bone is often asymptomatic and the diagnosis can be incidental. The decision to treat depends on the symptoms (pain, loss of function) or the localization of the disease (risk of nerve compression). The clinician misses simple and reliable tools to monitor the treatment efficacy. Radiologic follow-up requires repeated x-ray exploration requiring strict identical incidences to be able to evaluate the disease progression (12). Bone scintigraphy allows one to evaluate the bone formation and can be performed under treatment because the uptake of the tracer by normal bone is not modified by therapeutic bisphosphonates (13–15), with the exception of etidronate (16,17). However, the bone uptake observed with planar bone scintigraphy cannot be easily and reliably quantified and the semiquantitative visual methods are not sensitive enough to measure the actual response. Indeed, it was shown that a 70% uptake decrease is necessary before the human eye could detect it (18,19). PET has several major advantages over bone scintigraphy: PET is a tomographic imaging technique, with a superior spatial resolution, and the signal-to-noise ratio is higher for 18F-fluoride than for 99mTc-labeled diphosphonates because of a better first-pass extraction and a more rapid renal excretion of the unbound fraction (20–22). Correction for photon attenuation allows quantification of the tracer uptake so that one can rely on numbers rather than on visual inspection to evaluate the response to treatment. In this study, we showed that 18F-fluoride PET can be used to quantify the response of pagetic bones to treatment. As early as 1 mo after the start of treatment, 18F-fluoride uptake was reduced by 27% and PET correctly classified the single nonresponder patient (patient 5). The semiquantitative index SUVmax, corrected for body weight, was tightly correlated with Ki-PAT and Ki-NLR (Figs. 2 and 3). Indeed, although full kinetic modeling may be the most accurate and complete method to measure the bone metabolism, it is not practicable in a routine follow-up program because it is a time-consuming and complex method. Therefore, simpler methods must be validated. Our data show that SUVmax can be considered as being as effective and accurate as kinetic modeling in measuring the response of pagetic bones to bisphosphonates. Not only is the SUVmax at each time point correlated with Ki-PAT and Ki-NLR, but also the change of SUVmax between 0 and 1 mo (or between 0 and 6 mo) is correlated with the change of the kinetic indices (Fig. 3). We believe that indices must vary in the same way and extent before we consider them interchangeable. This is the case with SUVmax, Ki-PAT, and Ki-NLR. SUVmax is certainly easier to implement in a clinical setting: it can be computed on a static image without the need for arterial blood sampling. However, if SUVmax is to be used for evaluation of response to treatment, it is mandatory to measure it exactly at the same time after injection. Indeed, looking back at the time–activity curves, the uptake in pagetic bones did not reach a plateau phase by the end of the acquisition (60 min) so it is foreseeable that an SUVmax measured at 1 h will be lower than one measured at 90 min.
The Ki values we measured in normal bones are comparable with those reported by other teams (1,3–5,10,23). We observed a systematic difference between Ki-PAT and Ki-NLR, the latter being on average 13% higher. Brenner et al. reported Ki-NLR being on average 7% higher than Ki-PAT (10). Thus, we believe that our methodology was correct in terms of acquisition and data processing. We used the same—that is, baseline—arterial input curve to model all follow-up PET procedures. Strictly speaking, it would have been more appropriate to obtain the arterial input function at each time of the study. This would have been very cumbersome for our patients and, because the input curve relies on the cardiac function, it is not expected to significantly vary with time, especially in the absence of cardiovascular disease, which was the case for our patients. The injection was strictly standardized to minimize the differences in time-to-peak plasmatic activity. We did not observe significant changes in Ki values for normal bones throughout the study, which, for us, means that our method yields consistent results.
Full kinetic modeling with nonlinear regression allows estimation of all rate constants, K1 to k4. In our study, we observed that K1 changed in a similar way and extent as Ki-NLR, Ki-PAT, and SUVmax. K1 measures the transfer of the tracer from the blood to the bone compartment and is thus dependent on the blood flow. K1 was elevated at baseline in pagetic bones but was not different from normal bones at 6 mo, although Ki-PAT, Ki-NLR, and SUVmax remained significantly higher (Table 3). The Ki-NLR/K1 ratio, representing the fraction of tracer that becomes bound to the mineral compartment, remained constant throughout the study. The decrease of 18F-fluoride uptake under treatment is thus related to a decrease in the clearance of fluoride from the blood to the bone compartment, although the rate of mineralization is not affected by bisphosphonates, at least until 6 mo after the start of treatment. The individual rate constants, k2, k3, and k4 did not change significantly throughout the study, although we observed a trend toward decrease for k2, k3, and, to a lesser extent, k4. The latter might account for the decrease in the Ki-NLR/Ki-PAT ratio (from 12% to 6% in pagetic bones) because this difference increases with increasing k4. However, rate constant results must be interpreted with caution: the error on the measure is not negligible because the ROIs are small, especially after response to therapy. The statistics within the region can thus be limited, amplifying the error on the parameter estimations. We used a 370-MBq injected dose, which can be considered as a high dose especially for the follow-up of a benign disease. This decision was made to ensure better statistics and accurate calculations of rate constants. If PET is to be used in a larger population as a monitoring tool, it is preferable to use a lower dose. In that view, SUVmax is appropriate: it is computed on a 10-min-long (or even longer) image, and thus the issue of statistics can be solved easily. We prefer to use the maximal activity in the ROI instead of the mean activity. SUVmax reduces the underestimation of activity due to the partial-volume effect if the ROI diameter falls below twice the FWHM of the resolution function. SUVmax limits the probability of error due to the size of the ROI that could, if too large, encompass nonmetabolically active regions. Moreover, the maximal activity in the ROI will hopefully be always in the bone tissue, which means that the contribution of unbound 18F-fluoride will be limited.
Biochemical markers of bone remodeling are of limited value to monitor the activity of Paget’s disease, especially in its monostotic form. One month after the start of treatment, all markers normalized in 6 of 9 patients, although the 18F-fluoride uptake was still very high. At 6 mo, all patients with monostotic disease had normal biology. PET could certainly be helpful in this category of patients by providing an objective quantification of disease activity. At 6 mo, biochemical markers were still high in 2 patients, although 11 patients still showed disease activity on PET. The practical implication of such an observation is unclear: Should the clinician go on with a treatment in the absence of any biologic sign of activity? What is the positive predictive value of positive PET in patients with a normalized biology? These issues certainly deserve further studies.
Another question that emerged from the analysis of our results is: What is the normal value of 18F-fluoride uptake and how could we set up a threshold value to discriminate between active and nonactive disease? We observed a large range of uptake in normal bones, with the uptake in a vertebral body being 4 times higher than that in the tibia, as reported by others (10,23). Bone metabolism is indeed lower in limbs (predominantly cortical bones) than in iliac bones or vertebra (trabecular bones). Obviously, the activity of the Paget’s disease was also variable and, although statistically different, the uptake in normal and pagetic bones did overlap. We did not conduct a receiver-operating-characteristic analysis to look for the best SUVmax threshold to differentiate pagetic from normal bone. We believe that this threshold value would vary with the bone location and with the age of the patient. It could be more convenient to use the uptake in the contralateral (or adjacent) normal bone as a reference value. This is why we studied the P/C ratio. Interestingly, the P/C ratios calculated with the 3 indices (SUVmax, Ki-PAT, and Ki-NLR) evolved in parallel: at 1 mo, P/C-SUVmax decreased by 37%, P/C-Ki-PAT by 34%, and P/C-Ki-NLR by 37%. A P/C ratio of 1 could be an interesting goal if one wants to normalize the metabolism of affected bone. However, further studies are needed to validate this index: in older patients, “normal” contralateral bone can be osteoporotic and, because the bisphosphonates decrease the 18F-fluoride uptake in osteoporotic bones (4), that would alter the P/C ratio independently of the response of the pagetic bone. Furthermore, the magnitude of changes in PET metabolic parameters that we observed in our pagetic population might not be as high in other bone diseases, especially those characterized by a reduction of bone metabolism such as osteoporosis.
CONCLUSION
Our study demonstrates that 18F-fluoride PET can be used to measure the activity of Paget’s disease of bone and to evaluate the response to treatment. SUVmax measured at 60 min can be proposed as a substitute to full-kinetic modeling: SUVmax correlates with Ki-PAT and Ki-NLR and varied in the same way and extent during treatment. Furthermore, the P/C ratio could be used to take into account the differences of uptake from one body region to another. 18F-Fluoride PET is a promising noninvasive tool to monitor the therapeutic efficacy of bisphosphonates regimens in Paget’s disease—in particular, for the monostotic form of the disease.
Acknowledgments
This work was supported by grant 3.4528.03 from the Belgian National Fund for Scientific Research (FNRS).
Footnotes
Received Apr. 12, 2005; revision accepted Jun. 9, 2005.
For correspondence contact: Max Lonneux, MD, PhD, Department of Nuclear Medicine, Cliniques Universitaires Saint-Luc, Ave. Hippocrate, 10, B-1200 Brussels, Belgium. E-mail: max.lonneux{at}imre.ucl.ac.be
REFERENCES
In this issue


Jump to section
Related Articles
Cited By...
- Is Response Assessment of Breast Cancer Bone Metastases Better with Measurement of 18F-Fluoride Metabolic Flux Than with Measurement of 18F-Fluoride PET/CT SUV?
- The Role of Imaging in Measuring Disease Progression and Assessing Novel Therapies in Aortic Stenosis
- Dynamic Bone Imaging with 99mTc-Labeled Diphosphonates and 18F-NaF: Mechanisms and Applications
- Semiautomatic Region-of-Interest Validation at the Femur in 18F-Fluoride PET/CT
- Coronary Arterial 18F-Sodium Fluoride Uptake: A Novel Marker of Plaque Biology
- The Precision and Sensitivity of 18F-Fluoride PET for Measuring Regional Bone Metabolism: A Comparison of Quantification Methods
- SNM Practice Guideline for Sodium 18F-Fluoride PET/CT Bone Scans 1.0
- Effects of Alendronate on Bone Metabolism in Glucocorticoid-Induced Osteoporosis Measured by 18F-Fluoride PET: A Prospective Study
- Quantitative Radionuclide Studies of Bone
- Long-Term Precision of 18F-Fluoride PET Skeletal Kinetic Studies in the Assessment of Bone Metabolism
- Skeletal PET with 18F-Fluoride: Applying New Technology to an Old Tracer