


Abstract
We reported recently a highly selective radioligand, 2-([2-([dimethylamino]methyl)phenyl]thio)-5-[123I]iodophenylamine (ADAM), for SPECT imaging of serotonin transporters (SERT). In this article we describe the kinetic modeling of [123I]ADAM and its ability to quantitatively and reproducibly measure the concentrations of SERT in the nonhuman primate brain. We also investigate simplified models of tracer behavior that do not require invasive arterial blood sampling. Methods: Three female baboons each underwent 3 [123I]ADAM SPECT studies. The studies consisted of a dynamic sequence of seventy-two 5-min scans after injection of 330 ± 50 MBq (mean ± SD) [123I]ADAM. Rapid arterial blood samples were obtained and corrected for the presence of labeled metabolites. Dynamic imaging and metabolite-corrected plasma data were analyzed using graphic analysis to give the distribution volumes (DVs) of different brain regions. DV ratios (DVRs) of target to cerebellum were derived and compared against a kinetic reference tissue model and simple target-to-background ratio. Results: Averaged over all 9 scans, the mean DV in the midbrain was 4.86 ± 1.06 mL/mL and the mean DV in the cerebellum was 2.25 ± 0.48 mL/mL. The mean test–retest repeatability of the midbrain DV was 14.5%. The reference tissue model gave a mean midbrain DVR of 2.01 ± 0.17 and correlated strongly with the DVR calculated from the full kinetic model (correlation coefficient [R2] = 0.94; P < 0.001), but with much improved repeatability (test–retest, 5.4%; intersubject variability, 5.2%). Similarly, the simple ratio method gave strong correlations with the full kinetic model (R2 = 0.89; P < 0.001) and a test–retest of 7.6%. Conclusion: Accurate, repeatable quantification of SERT in the nonhuman primate brain is possible using kinetic modeling of dynamic [123I]ADAM SPECT scans. Simplified models, which do not require arterial blood sampling, gave accurate results that correlated strongly with the full kinetic model. The test–retest reliability of the simplified reference region models was excellent. Quantification of SERT is possible using full kinetic modeling and also with simpler reference region methods.
Abnormalities in the serotonergic system are believed to be implicated in many neurologic and psychiatric disorders, such as depression, obsessive-compulsive disorder, drug addiction, schizophrenia, parkinsonian disorders, Alzheimer’s disease, and eating disorders (1–6). The role of serotonin transporters (SERT) in depression is of particular interest because it is a major target site for antidepressant medications.
Most reviewers acknowledge that there is a great demand for a widely available, highly selective SERT radioligand for PET and SPECT (6–8). This highlights the need for in vivo studies of SERT in depression and the interaction of these binding sites with endogenous neurotransmitter and specific serotonin reuptake inhibitor antidepressants. The widespread availability of a SPECT imaging agent with high selectivity for SERT would make it possible to study the efficacy of antidepressant drugs and to monitor at-risk individuals with a susceptibility to depression and suicide. The development of a SERT tracer that can accurately, quantitatively, and repeatedly measure SERT densities will make profound contributions to the understanding of the role of the serotonergic system in the pathophysiology of depressive illness (7,8). In vivo measurement of drug occupancy will provide a direct correlation of drug action and symptomatic improvement.
Previously, we have reported results from 3 selective radioligands for SPECT imaging of SERT: 5-[123I]iodo-2-([2,2-([dimethylamino]methyl)phenyl]thio)benzyl alcohol (9), 5-[123I]iodo-2-(2-[(dimethylamino)methyl]phenoxy)benzyl alcohol (10), and 2-([2-([dimethylamino]methyl)phenyl]thio)-5-[123I]iodophenylamine (ADAM) (11). All 3 tracers have exhibited good selectivity for SERT (12,13) and excellent imaging characteristics for SPECT (14,15). However, it became clear that [123I]ADAM was the superior tracer, with higher uptake, greater selectivity, and improved images because of its reduced background of nonspecific binding (16). [123I]ADAM exhibited considerably greater selectivity for SERT than the other monoamine transporters, with a binding affinity >50,000 times greater than that of dopamine and norepinephrine transporters (11). For this reason, we have concentrated on [123I]ADAM, and in this article we present the results of quantitative analysis of SERT densities in nonhuman primates.
Quantification of SERT, as with any other cerebral binding site, requires full kinetic modeling of the data, using complex and invasive arterial blood sampling to provide the input function to the mathematic model of tracer behavior. This procedure is relatively invasive, so several simplified quantitative models have been developed that do not require blood sampling. An alternative method for the kinetic modeling of radioligands uses a reference region approach, in which the input function to the model is derived from the images themselves (17–21). However, the reference region model still requires the acquisition of dynamic SPECT data over an extended period of time, which may make the imaging protocol difficult to perform on a routine basis. Further simplifications are found using the ratio of specific binding to some background region at equilibrium, requiring just a single short scanning session. These techniques remove the need for any blood sampling and considerably reduce the discomfort of the patient. However, these simple methods require careful validation against the gold standard kinetic models.
MATERIALS AND METHODS
Radiotracer Preparation
The synthesis of [123I]ADAM has been described in detail elsewhere (11).
Animal Preparation
The experiments were performed on three 15-kg female baboons (Papio anubis) under protocols approved by the local animal care committee. Each animal underwent 3 [123I]ADAM SPECT studies, with a minimum time of 4 wk between studies and a maximum time between studies of 11 wk for any 1 animal.
The animals were fasted for 24 h before the study and anesthetized with an intramuscular injection of 0.04 mg/kg glycopyrrolate followed by 1 mL/kg Saffan (0.9% [w/v] alfaxalone/0.3% alfadolone acetate) (Pittman-Moore, Middlesex, U.K.). A venous catheter was inserted in the arm for anesthesia, saline, and tracer injection. An arterial catheter was inserted in the leg. During the experiment, anesthesia was maintained with an intravenous infusion of 20% Saffan diluted with saline, at a rate of 40–80 mL/h as needed. Circulatory volume was maintained with an intravenous infusion of saline, and blood pressure was continuously measured. The animals were intubated with an endotracheal tube and ventilated with supplementary 100% oxygen (1–2 L/min) to maintain an oxygen saturation of >90%, which was monitored by a pulse oximeter. Core body temperature was maintained by a heated pad kept at a temperature of 37°C and continuously monitored.
Blood Sampling
Arterial blood sampling was performed automatically for the first 10–12 min, using a peristaltic pump feeding into a fraction collector, with individual samples taken every 8.4 s. After this time, arterial blood samples were withdrawn by hand at 30, 60, 120, 180, 240, 300, and 360 min after injection of the tracer.
Blood samples were spun in a centrifuge at 2000g for 5 min, and the separated plasma was counted in a Packard 5000 gamma counter (Packard Instrument Co., Downers Grove, IL). Some of the plasma samples were selected for further metabolite analysis (0, 0.42, 0.98, 1.54, 2.1, 5.04, 9.66, 30, 60, 120, 180, 240, 300, and 360 min after injection). These samples were extracted in the presence of unlabeled ADAM carrier (50 μg) with ethyl acetate. The extracted and aqueous layers were counted in the gamma counter to give the percentage yield in the extractable layer. After extraction, the ethyl acetate layer was condensed to dryness under nitrogen and dissolved in a mixture of ethanol and methanol. Thin-layer chromatography (TLC) was used to separate the pure compound from the radioactive metabolites, having been validated fully against high-performance liquid chromatography (S.-R. Choi, unpublished data, June 2000). The TLC mobile phase consisted of 80% ethyl acetate and 20% methanol. Finally, the quantity of unchanged parent compound in plasma was calculated from the product of the percentage yield after extraction and the fraction of pure compound determined by TLC.
SPECT Imaging
SPECT imaging was performed on a triple-head Picker Prism 3000XP gamma camera (Marconi Medical Systems, Cleveland, OH) fitted with low-energy, ultra-high-resolution fanbeam collimators (spatial resolution, approximately 6.7 mm at 10 cm). The radius of rotation was 14 cm, and a single energy window was used, centered at 159 keV, width 20%. A dynamic sequence of scans (5 min per frame × 72) was acquired over a period of 6 h, beginning immediately on injection of 330 ± 50 MBq (mean ± SD) [123I]ADAM. Data were acquired into a 128 × 128 array with 120 projections per scan over 360° and a zoom of 1.6.
A high-count SPECT image was created by reconstructing the summed projection data from every 5-min scan over the full 6-h time course of the experiment, providing a good quality image to assist with subsequent processing. Individual images were reconstructed using filtered backprojection, with a low-pass Butterworth 3-dimensional postfilter (order, 4.0; cutoff, 0.2 pixel−1). The data were corrected for the effects of photon attenuation using Chang’s first-order method, with the attenuation ellipses defined on the summed image of the entire dataset and applied, without modification, to all images individually. The summed image was reoriented to give transverse slices parallel to the orbitomeatal line, and then the same transformation parameters were applied to every other image in turn. Finally, adjacent slices were added together to give an image consisting of a 128 × 128 array of 21 slices covering the entire brain, with a pixel size of 1.4 × 1.4 mm and a slice thickness of 2.8 mm.
MRI
Each animal also had a single magnetic resonance (MR) scan to provide information on anatomic structure. The MR scans were acquired on a 1.5-T instrument (General Electric Medical Systems, Milwaukee, WI) with a spoiled gradient-recalled acquisition in steady-state sequence that produced 0.7 × 0.7 × 0.7 mm voxels, with a slice separation of 1.0 mm. The MR scans were resized and resliced in planes parallel to the orbitomeatal line.
Image Analysis
The summed SPECT images were coregistered with each animal’s corresponding MR image using a mutual information algorithm, with the quality of the registration verified by visual inspection of the overlaid images. The transformation parameters derived for the registration of the summed image were then applied to each individual image in the dynamic sequence. Guided by a baboon atlas (22), regions of interest (ROIs) were drawn on the MR image corresponding to the midbrain, thalamus, striatum, and cerebellum, and the ROIs applied directly to the coregistered SPECT images. The volumes of the ROIs were as follows: midbrain, 246 mm3 over 1 slice; cerebellum, 700 mm3 over 2 slices; striatum, 524 mm3 over 2 slices; and thalamus, 452 mm3 over 2 slices. All measured counts per pixel were decay corrected to the point of injection of the tracer. No correction was made for partial-volume effects, although the ROIs were restricted to regions completely within each brain structure to reduce the effects of partial volumes as much as possible. The image and blood data were converted to common units using an anthropomorphic brain phantom. After SPECT imaging of the phantom, an aliquot of activity was withdrawn and counted in the well counter, giving a cross-calibration figure between the SPECT images and the well counter.
Kinetic Modeling
The arterial plasma activity of unmetabolized radioligand provided the input function to the model of tracer behavior. The metabolite-corrected time–activity plasma data, Cp, were fit to a triexponential curve for times, t, after the peak, tpeak, of the plasma activity:
 Eq. 1
where the normalization factors, aj, sum to unity, and each component of exponential decay has its own decay constant, τj.
Eq. 1
where the normalization factors, aj, sum to unity, and each component of exponential decay has its own decay constant, τj.
The kinetic analysis of the dynamic SPECT and plasma data was performed using graphic analysis (23,24). Using this method, the equation describing the dynamics of reversible systems was given by a simple linear relationship (24):
 Eq. 2
where A(t) is the activity measured by the SPECT camera in a particular ROI at time t, Cp(t) is the plasma radioactivity of unmetabolized radioligand, DV is the distribution volume of the tracer in that region, and int is some time-dependent intercept term. If, at time t*, the time dependence of the intercept term becomes sufficiently small, then for T > t* the DV can be found from the slope of the graph of ∫0TA(t)dt/A(T) against ∫0TCp(t)dt/A(T). Another useful quantitative parameter of interest was the ratio of the DVs (DVRs) in a SERT-rich region, such as the midbrain, and a background region containing few or no SERT, such as the cerebellum.
Eq. 2
where A(t) is the activity measured by the SPECT camera in a particular ROI at time t, Cp(t) is the plasma radioactivity of unmetabolized radioligand, DV is the distribution volume of the tracer in that region, and int is some time-dependent intercept term. If, at time t*, the time dependence of the intercept term becomes sufficiently small, then for T > t* the DV can be found from the slope of the graph of ∫0TA(t)dt/A(T) against ∫0TCp(t)dt/A(T). Another useful quantitative parameter of interest was the ratio of the DVs (DVRs) in a SERT-rich region, such as the midbrain, and a background region containing few or no SERT, such as the cerebellum.
The application of a simplified reference tissue model to the kinetic data was also assessed. In the reference tissue model, a nondisplaceable region of the brain, such as the cerebellum, was used to provide the input function to the kinetic model. Using graphic analysis of the SERT-rich region (R) and a background region (B), the DVR was obtained without the need for arterial blood sampling from the equation (19):
 Eq. 3
This technique also was applied at every pixel in the images to derive a parametric image of DVR.
Eq. 3
This technique also was applied at every pixel in the images to derive a parametric image of DVR.
Finally, another measure of DVR was derived from the ratio of specific to nonspecific binding at equilibrium. When the concentration of ligand specifically bound to SERT in a receptor-rich region, R, was in equilibrium with the nondisplacement compartment, B, the distribution volume ratio was given by:
 Eq. 4
where t′ is the time of equilibrium. This is the familiar expression for determining DVR from the ratio of concentrations in the target and reference regions at equilibrium (25–27). However, this method is critically dependent on the identification of the point of transient equilibrium, which may vary between individuals. To investigate the optimum equilibrium time, the ratio technique was compared against the full kinetic model, calculating the ratio of midbrain to cerebellum over a range of times. Two methods were used to determine the optimum time point. One measured the root-mean-square (RMS) deviation between the ratio method and the full kinetic model as a function of time, with the expectation that at the optimum time point the RMS deviation would be a minimum. The other method measured the slope of the regression comparing the ratio technique against the full kinetic model, with the assumption that at the true equilibrium time the slope would be equal to 1.
Eq. 4
where t′ is the time of equilibrium. This is the familiar expression for determining DVR from the ratio of concentrations in the target and reference regions at equilibrium (25–27). However, this method is critically dependent on the identification of the point of transient equilibrium, which may vary between individuals. To investigate the optimum equilibrium time, the ratio technique was compared against the full kinetic model, calculating the ratio of midbrain to cerebellum over a range of times. Two methods were used to determine the optimum time point. One measured the root-mean-square (RMS) deviation between the ratio method and the full kinetic model as a function of time, with the expectation that at the optimum time point the RMS deviation would be a minimum. The other method measured the slope of the regression comparing the ratio technique against the full kinetic model, with the assumption that at the true equilibrium time the slope would be equal to 1.
Statistical Analysis
Differences among the various outcome measures across scans and analysis methods were assessed for significance using a repeated-measures ANOVA, and posthoc analysis of each pair of methods was tested using paired t tests, with Bonferroni corrections for multiple comparisons. Linear regression analysis was used to compare the different methods and to test for correlations. Test–retest differences were expressed as the absolute mean percentage difference between each scan and the mean of all scans for each subject. The test–retest reliability was assessed using the intraclass correlation coefficient, ri, defined as:
 Eq. 5
where sb is the mean sum of squares between subjects, sw is the mean sum of squares within subjects, and n is the number of scans within subjects (n = 3 in this study). Statistical significance was defined as P < 0.05, and summaries of study variables were reported as mean ± SD.
Eq. 5
where sb is the mean sum of squares between subjects, sw is the mean sum of squares within subjects, and n is the number of scans within subjects (n = 3 in this study). Statistical significance was defined as P < 0.05, and summaries of study variables were reported as mean ± SD.
RESULTS
Plasma Analysis
Plasma time–activity curves before and after corrections for the presence of labeled metabolites are shown in Figure 1 for a representative subject. After 6 h, the unmetabolized parent tracer represented 5.7% ± 1.5% of the total plasma radioactivity concentration. Triexponential fits to the plasma parent compound concentration gave good fits in all but 1 case, where a 4-exponential fit was required. The average normalized triexponential fit parameters were a1 = 0.924 ± 0.030, a2 = 0.052 ± 0.021, and a3 = 0.024 ± 0.012, and the corresponding time constants were τ1 = 0.77 ± 0.27 min, τ2 = 14.2 ± 10.1 min, and τ3 = 181 ± 46 min. The large spread across and within subjects for each parameter suggests that [123I]ADAM metabolism is highly variable and that a standard population-based triexponential curve may not be appropriate. The labeled metabolites were not fully identified, but they were not lipophilic and should not cross the blood–brain barrier.
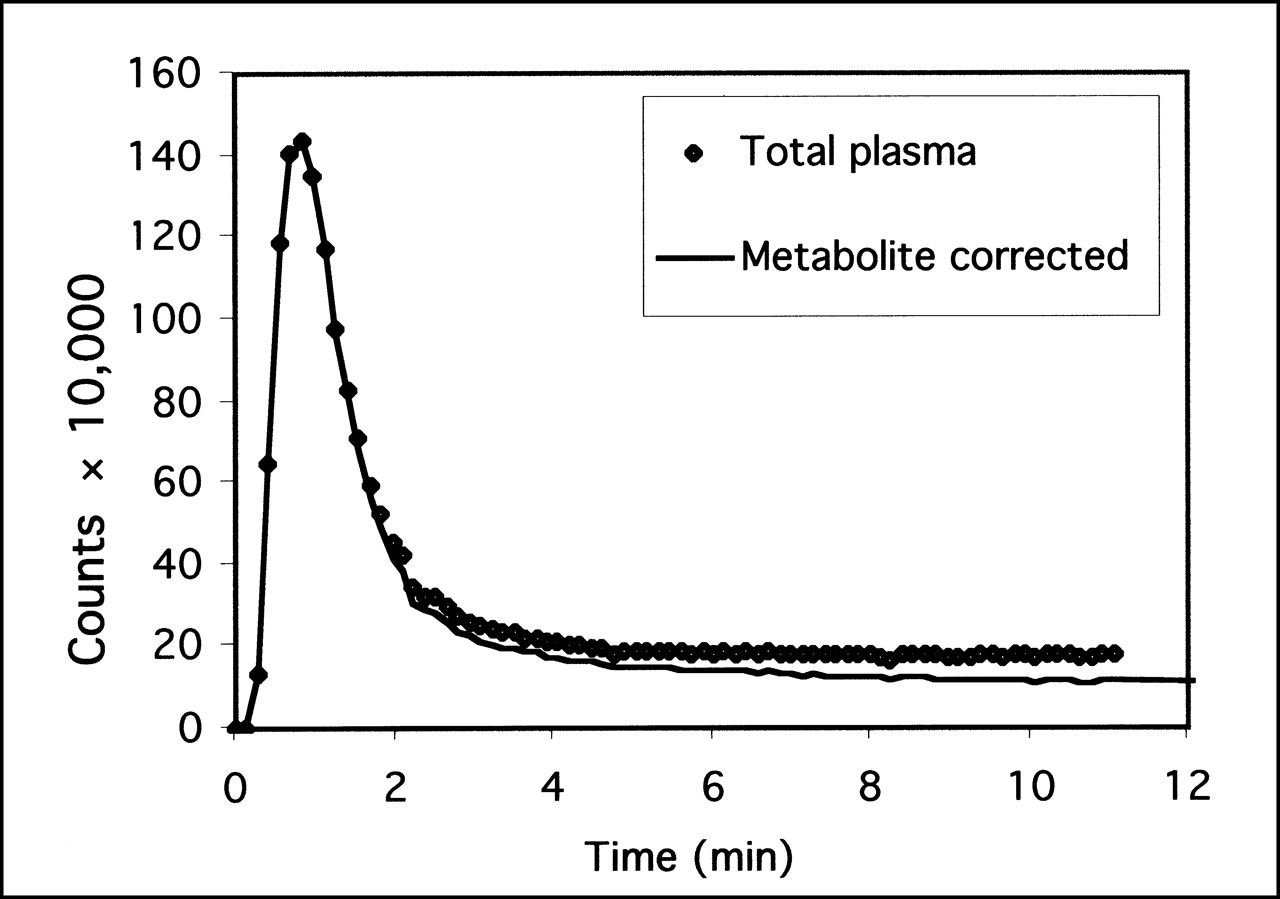
Plasma radioactivity as function of time for first 12 min of scan. Shown with total plasma activity is activity after correction for presence of labeled metabolites.
Kinetic Modeling
A typical set of time–activity curves for an individual subject is shown in Figure 2. Peak uptake in the cerebellum, a background region with low concentrations of SERT, occurred around 30 min, whereas the uptake in the midbrain peaked later at around 70 min. Specific binding in the midbrain (target minus cerebellum) reached equilibrium at roughly 180 min and remained fairly constant for the remainder of the study (washout rate after 5 h, 12.3% ± 16.4% per hour).

Typical set of time–activity curves for uptake of [123I]ADAM in various regions in brain. CER = cerebellum; MB = midbrain.
Kinetic modeling of the time–activity data using graphic analysis showed good linear fits to all regions (Fig. 3). The results of full kinetic analysis using metabolite-corrected arterial blood are summarized in Table 1, where the DVs are presented for the midbrain, cerebellum, thalamus, and striatum. Test–retest values were in the range 13.1%–15.5% for the different brain regions, and the intraclass correlation coefficient, ri, was low for all values. The intersubject variability was similar to the intrasubject value, ranging over 9.6%–13.9%.
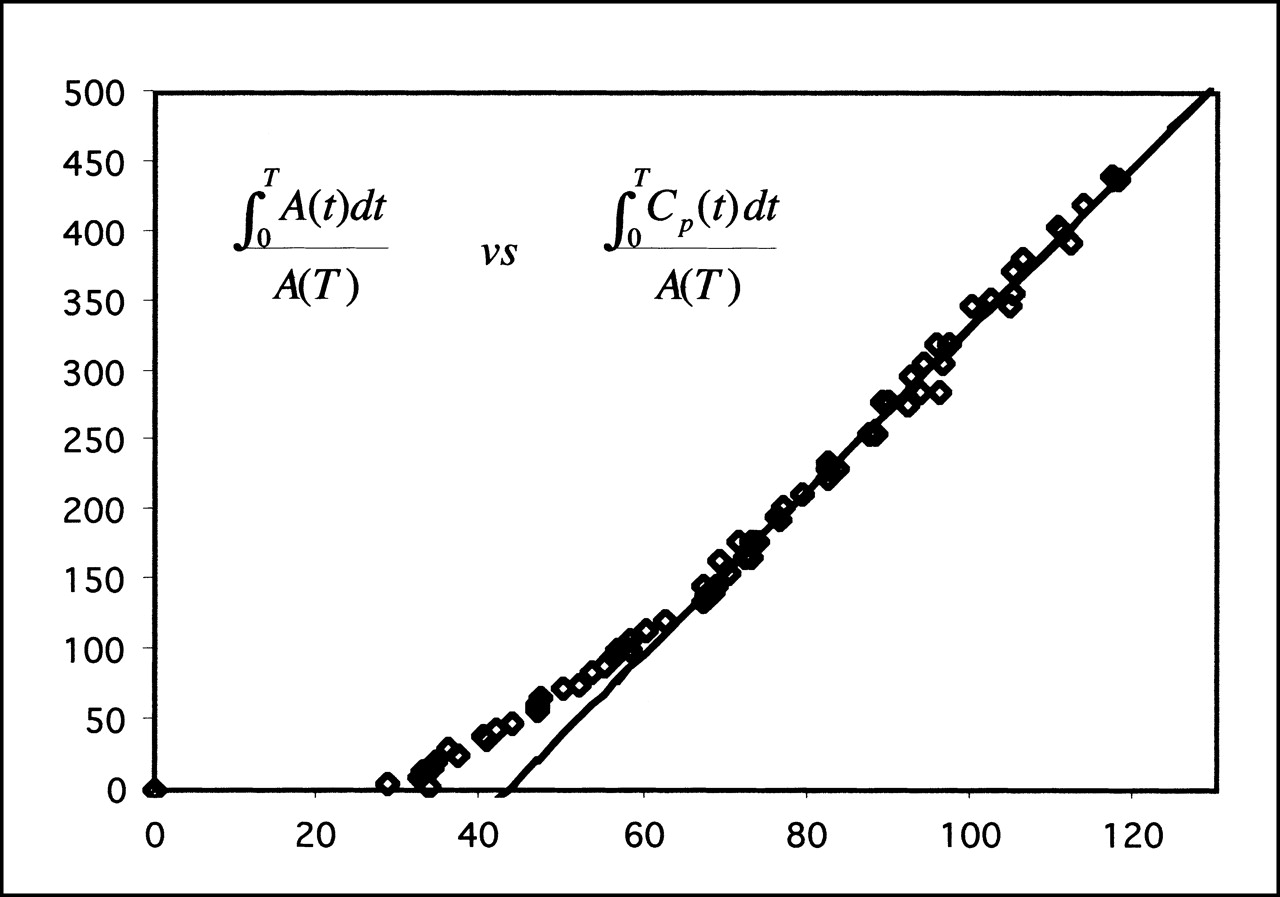
Example of graphic analysis of set of time–activity data for midbrain, showing good linearity achieved after t* = 130 min. Axes represent normalized integral of midbrain activity as function of normalized integral of plasma activity.
Kinetic Modeling Parameters Derived from Graphic Analysis of [123I]ADAM Uptake in Brain Combined with Metabolite-Corrected Arterial Plasma Data
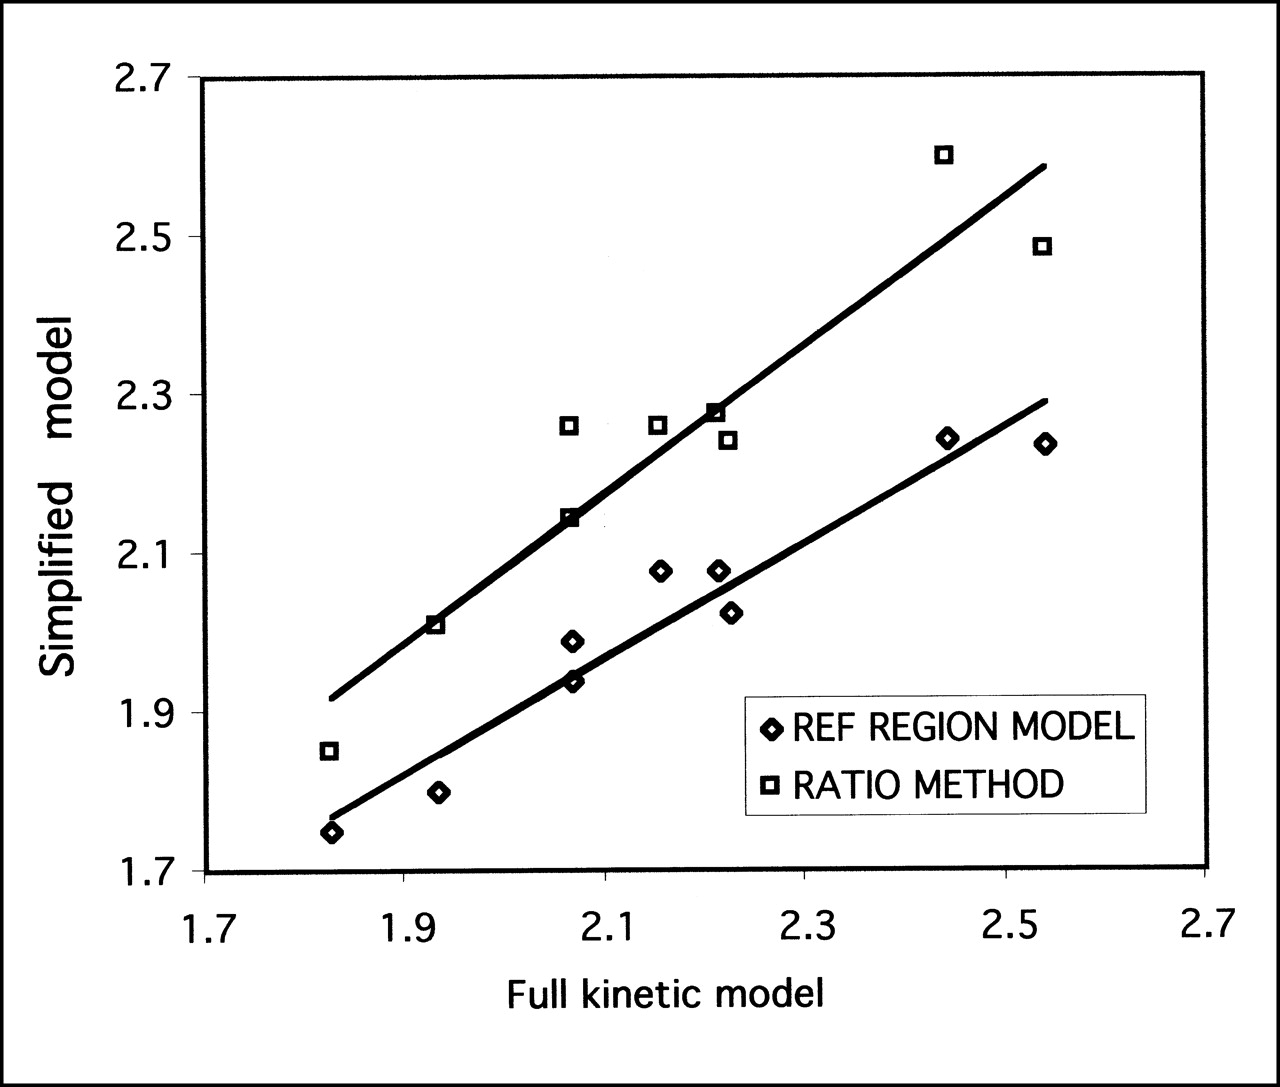
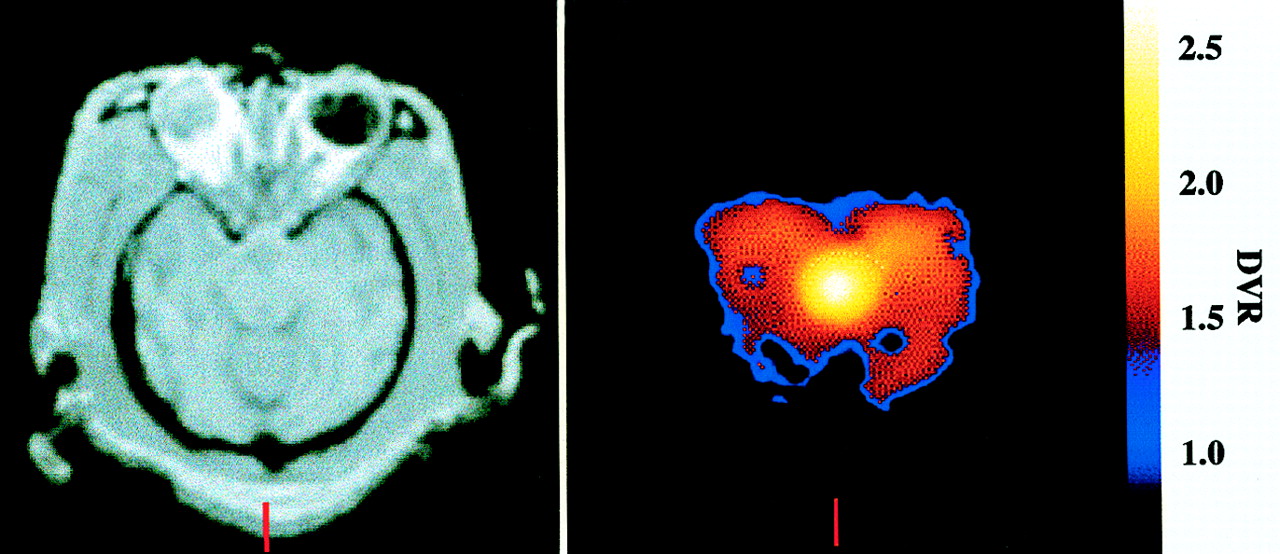
The DVR for regions of specific binding to that in the cerebellum was calculated and compared against the simplified reference tissue model and the ratio method (Fig. 4; Table 2). For all regions and for both simplified models, the correlations were excellent (R2 = 0.89–0.98; P < 0.001), indicating that both methods of simplified analysis yielded results highly correlated with the full kinetic model. The test–retest reliability for the simplified models was significantly better than that of the full kinetic model, with variabilities in the range 2.3%–8.2%, whereas the intraclass correlation coefficients were of the same magnitude as those of the full model. The intersubject variability was in the range 5.2%–9.8% for the different brain regions. For all regions, the reference tissue model gave the lowest test–retest variability, indicating a greater reproducibility than any other technique. Repeated-measures ANOVA revealed a significant difference between analysis techniques (P = 0.03), although posthoc paired t tests failed to reveal any differences between any combination of results (P > 0.05 after Bonferroni correction). Applying the reference tissue model pixel by pixel enabled the generation of parametric images of DVR, which is shown in Figure 5 in relation to an MR image of the same animal. Figure 5 shows the expected distribution of SERT in the brain, with high concentrations in the midbrain, lower concentrations in the cortex, and no specific uptake in the cerebellum.

Correlation between full kinetic model and 2 simplified models for DVRs of midbrain to cerebellum. For reference tissue model, correlation coefficient R2 = 0.94 (P < 0.001), and regression slope = 0.72 ± 0.07. For ratio method, R2 = 0.89 (P < 0.001), and slope = 0.93 ± 0.12.

Parametric image (right), at level of midbrain, obtained by calculating DVR at every pixel using reference tissue model compared against coregistered MR image (left) of same animal.
Comparison of DVRs Measured with Full Kinetic Modeling Against Reference Tissue Model and Simple Ratio Technique
The simple ratio method depends critically on being able to identify the point of equilibrium between the region of specific binding and the background region. The 2 methods for determining the optimum time point (RMS deviation and regression slope) gave similar results (Fig. 6), and they both indicated that the optimum time for measuring the ratio of midbrain to cerebellum was 160–180 min after injection of the tracer.
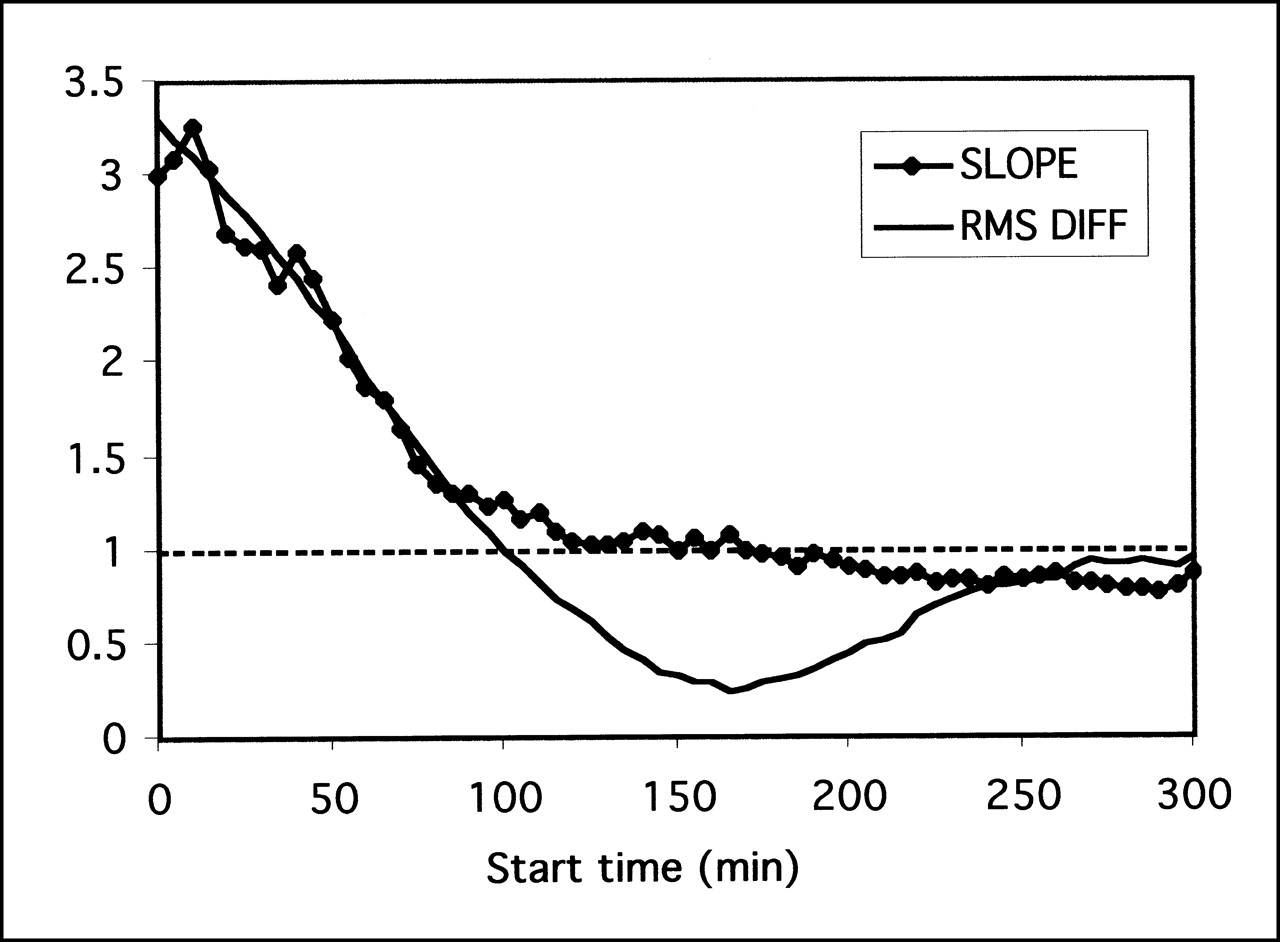
Determination of optimum time point for measuring ratio of midbrain to cerebellum. Ratios were derived as function of time and compared against full kinetic model result using slope of regression or RMS difference (RMS DIFF) between methods. RMS difference method reaches minimum at roughly same time as slope crosses unity, in range 160–180 min.
DISCUSSION
[123I]ADAM is a highly selective radioligand for imaging SERT in the primate brain, which can be used to give quantitative measures of SERT densities, such as DV and DVR. Kinetic modeling of [123I]ADAM binding to SERT was possible using graphic analysis of the dynamic tracer uptake and retention, exhibiting reasonable test–retest reliability and intersubject variability. Simplifications to the kinetic model, which do not require arterial blood sampling, showed excellent correlations with the full kinetic model and improvements in the reproducibility and intersubject variability. The reference tissue kinetic model gave the most accurate and reproducible results, although this technique still required the collection of a complete set of dynamic data. A further simplification, which required only a single scan, used the ratio of uptake in the target region to the cerebellum at equilibrium as a measure of specific binding. This also gave excellent correlations with the full kinetic model and the reference tissue model. Analysis of the optimum equilibrium time for this methodology indicated that the best time point for sampling the ratio of specific to nonspecific binding was around 160–180 min after injection of the tracer.
Analysis of the plasma activity indicated that there was a large variability in the concentration of unmetabolized tracer in the blood, within and between subjects. This was a result of low counting statistics in the plasma measurements, particularly at later time points, although it did not appear to affect the quantitative behavior of the tracer in the brain. However, it does imply that a population-based approach, using a single average input function to simplify the analysis of arterial plasma data, may not be appropriate for [123I]ADAM.
The uptake and washout of [123I]ADAM were relatively slow, requiring data acquisition for several hours. In fact, graphic analysis of the kinetic data required at least 2 h of imaging before the linear portion of the curve was attained and several more hours after that to obtain a reasonable linear fit. The intersubject variability of the DV obtained from the full kinetic model was relatively poor (11.5% in the midbrain) and was comparable with the test–retest reliability (14.5% in the midbrain). This explains the relatively low intraclass correlation coefficient (ri = 0.4 for the midbrain), which is a reflection of the fact that the intersubject variability was comparable with the test–retest reliability. If the within-subject sum of squares is roughly the same as the between-subject sum of squares, then ri simply indicates that the test–retest reliability is no better than the variability between different subjects. This was found to be true of all analyses in this study.
Although the repeatability of the values of DV was poor for all regions, the ratios of the DV to that in the cerebellum (DVR) gave much better results, with a test–retest reliability of 7.7% in the midbrain and an intersubject variability of 5.3%. This was a result of the removal in the ratio of any systematic error from the arterial blood measurements. This also was reflected in the reference tissue model, where, in the midbrain, the test–retest and intersubject variability measurements were 5.4% and 5.2%, respectively. As for the calculation of DVR from the full kinetic model, removing any potential bias or errors present in the arterial blood data had a dramatic effect on the improved reliability of the results. These low values of between- and within-subject variability suggest that the measurement of SERT densities in human subjects using [123I]ADAM should have the necessary sensitivity to detect the small changes resulting from disease or the presence of competing drugs. Similar results were obtained using the simple ratio technique, where the ratio of tracer uptake in the midbrain to that in the cerebellum at 180 min gave an accurate and repeatable measure of specific binding. In fact, whereas the reference tissue model appeared to slightly underestimate the value of DVR compared with that of the full kinetic model (midbrain slope = 0.72 ± 0.07), the ratio method gave a much better agreement (midbrain slope = 0.93 ± 0.12). This finding suggests that the simple ratio technique may be the method of choice for quantitative studies of SERT binding, particularly because the imaging protocol will be much more tolerable.
There was quantifiable uptake of [123I]ADAM in cortical regions of the brain, visible on the parametric image of DVR (Fig. 5). The uptake was, of course, considerably lower than that in the midbrain, with DVR values of around 1.5. However, given the importance of the cortical serotonin system, this was an important result of this study.
There is extensive evidence that the cerebellum, the reference tissue used in this study, itself contains SERT (28,29). The use of a reference region that contains some of the binding sites under study is potentially problematic. Although the cerebellum undoubtedly contains some SERT, of all the brain regions, it has by far the lowest concentration. Therefore, although it is not an ideal reference region, it is the best reference region that can be used. The excellent correlation of the reference tissue model with the full kinetic model supports the conclusion that the cerebellum has a sufficiently low level of SERT that it still can be useful as a reference region. Any error resulting from the presence of SERT in the cerebellum appears to be providing a consistent bias to the data that affects each subject equally. Hence, although the cerebellum is not an ideal reference region, it is still valid and should be investigated further, particularly given the importance of the simplified techniques.
CONCLUSION
[123I]ADAM gave quantitative, repeatable measurements of SERT binding in the nonhuman primate brain. Simplified kinetic models, using the cerebellum as a reference region, showed reduced variability primarily associated with the removal of any errors introduced in the plasma measurements. The values of DVR calculated using the ratio of target to cerebellum at 180 min also were strongly correlated with the full kinetic model, and this method may be the technique of choice because of the much simpler and more tolerable imaging protocol.
Acknowledgments
This study was supported by the National Institutes of Health (grants NS 35120 and MH-48125).
Footnotes
Received Feb. 5, 2001; revision accepted Jun. 12, 2001.
For correspondence or reprints contact: Paul D. Acton, PhD, Department of Radiology, University of Pennsylvania, 3700 Market St., Room 305, Philadelphia, PA 19104.
REFERENCES
In this issue


Jump to section
Related Articles
Cited By...
- Evaluation of the Serotonin Transporter Ligand 123I-ADAM for SPECT Studies on Humans
- Optimal Metabolite Curve Fitting for Kinetic Modeling of 11C-WAY-100635
- Imaging the serotonin transporter during major depressive disorder and antidepressant treatment: 2005 CCNP Young Investigator Award Paper
- SPECT of Serotonin Transporters Using 123I-ADAM: Optimal Imaging Time After Bolus Injection and Long-Term Test-Retest in Healthy Volunteers
- 123I-ADAM Binding to Serotonin Transporters in Patients with Major Depression and Healthy Controls: A Preliminary Study
- Biodistribution and Imaging with 123I-ADAM: A Serotonin Transporter Imaging Agent
- Characterization of the Binding Sites for 123I-ADAM and the Relationship to the Serotonin Transporter in Rat and Mouse Brains Using Quantitative Autoradiography
- Molecular Targeting with Radionuclides: State of the Science
- Long-Term Effects of "Ecstasy" Use on Serotonin Transporters of the Brain Investigated by PET
- Pharmacological Characterization of N,N-Dimethyl-2-(2-amino-4-methylphenyl thio)benzylamine as a Ligand of the Serotonin Transporter with High Affinity and Selectivity