


Article Figures & Data
Figures
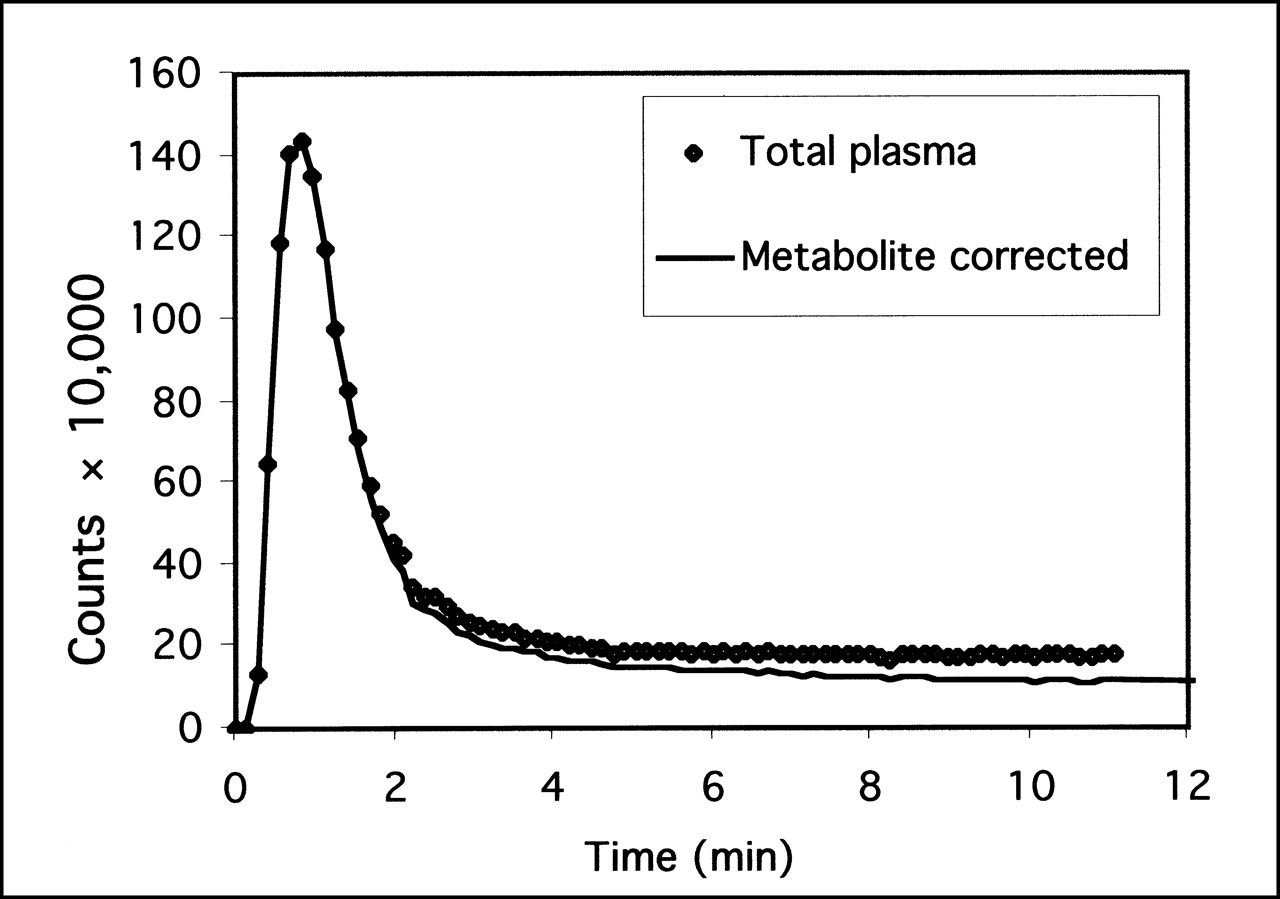
- FIGURE 1.
Plasma radioactivity as function of time for first 12 min of scan. Shown with total plasma activity is activity after correction for presence of labeled metabolites.
- FIGURE 2.
Typical set of time–activity curves for uptake of [123I]ADAM in various regions in brain. CER = cerebellum; MB = midbrain.
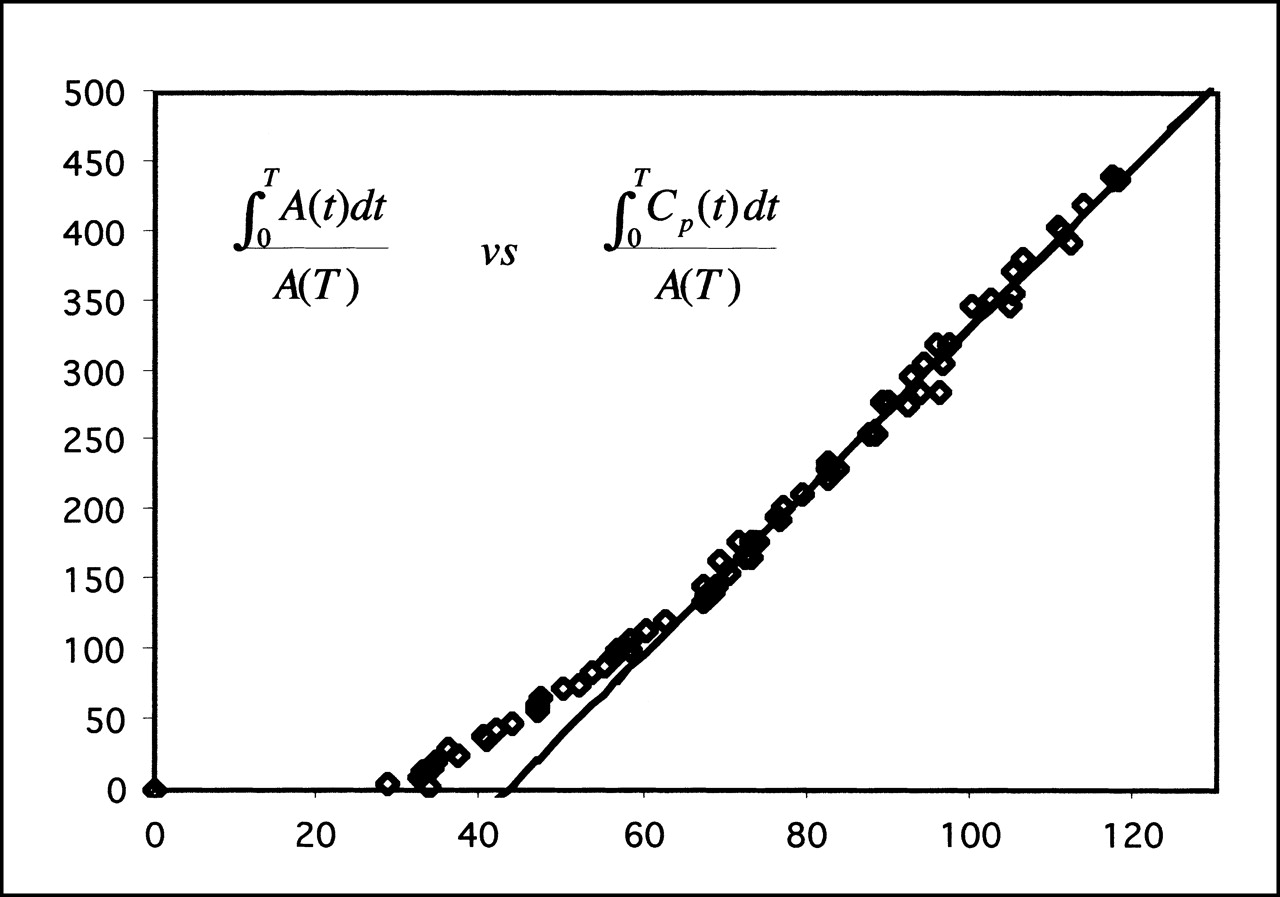
- FIGURE 3.
Example of graphic analysis of set of time–activity data for midbrain, showing good linearity achieved after t* = 130 min. Axes represent normalized integral of midbrain activity as function of normalized integral of plasma activity.
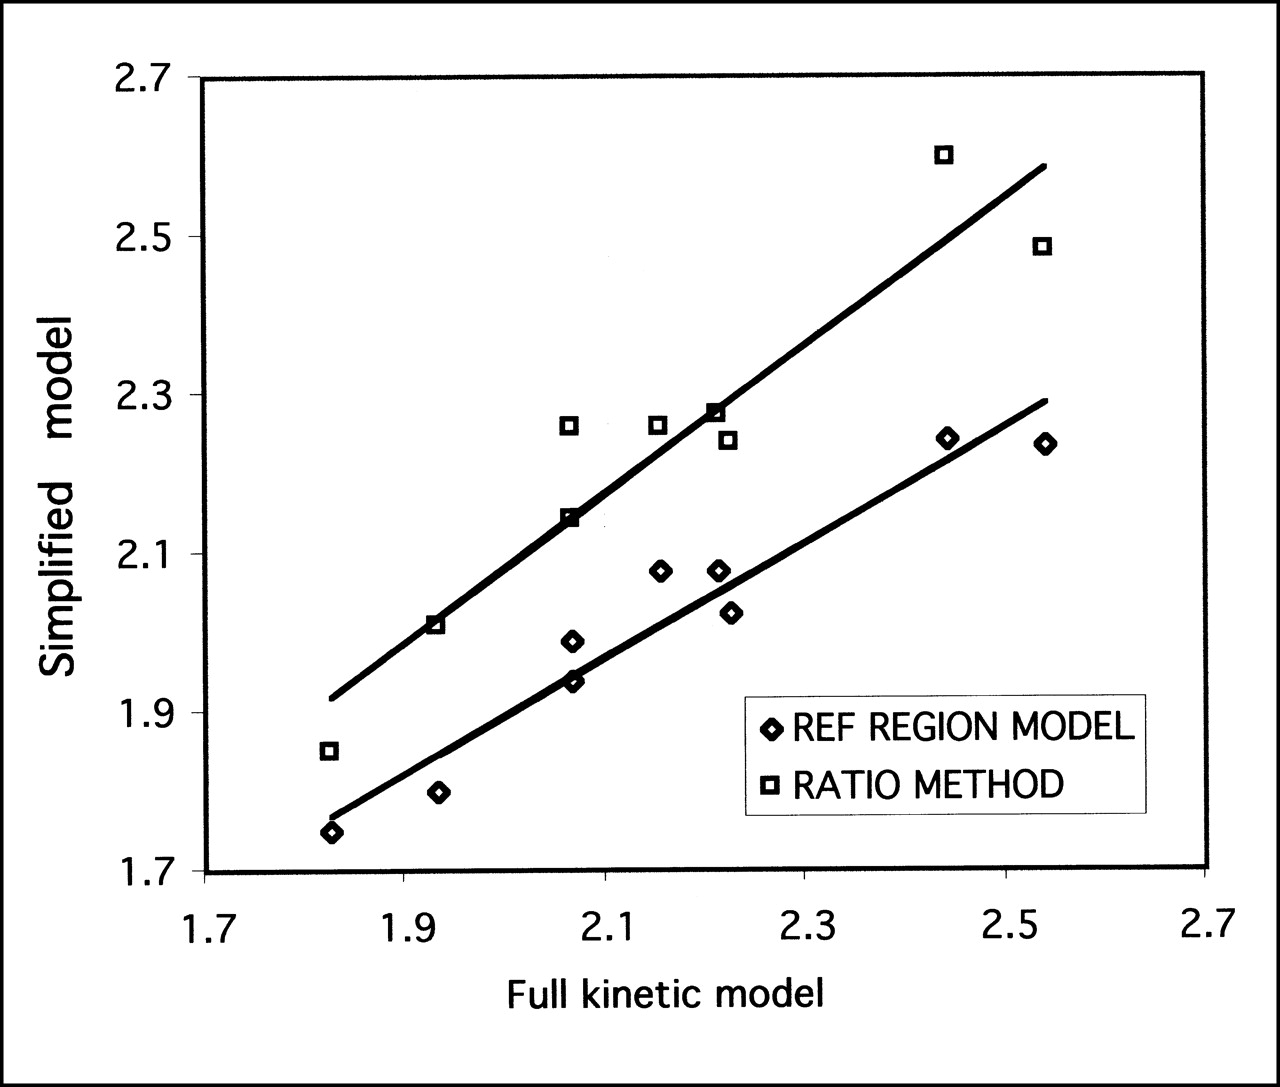
- FIGURE 4.
Correlation between full kinetic model and 2 simplified models for DVRs of midbrain to cerebellum. For reference tissue model, correlation coefficient R2 = 0.94 (P < 0.001), and regression slope = 0.72 ± 0.07. For ratio method, R2 = 0.89 (P < 0.001), and slope = 0.93 ± 0.12.
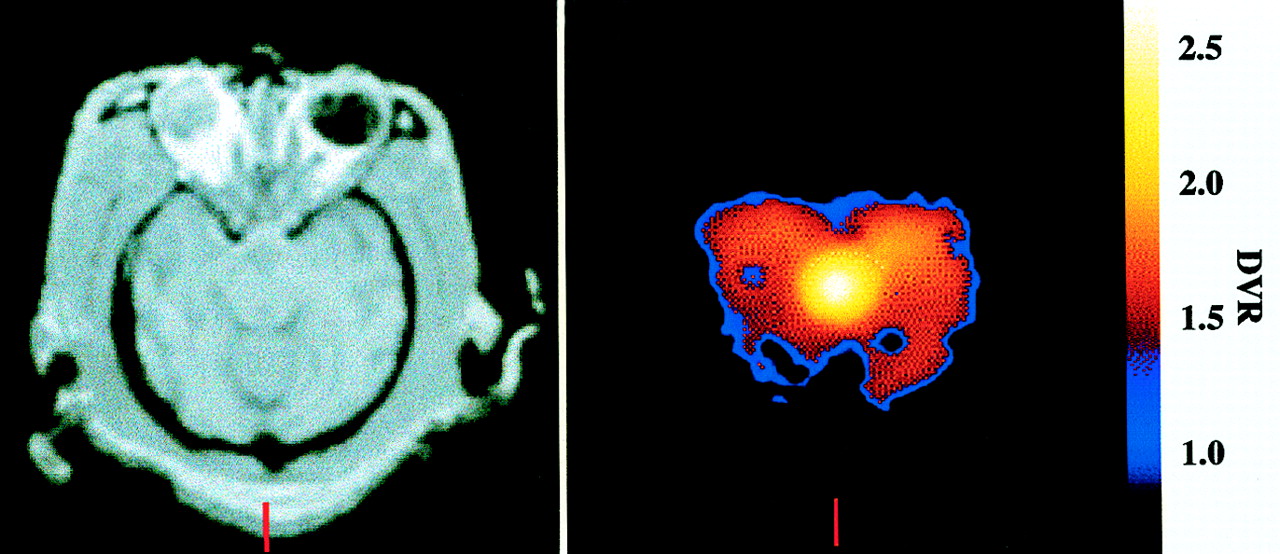
- FIGURE 5.
Parametric image (right), at level of midbrain, obtained by calculating DVR at every pixel using reference tissue model compared against coregistered MR image (left) of same animal.
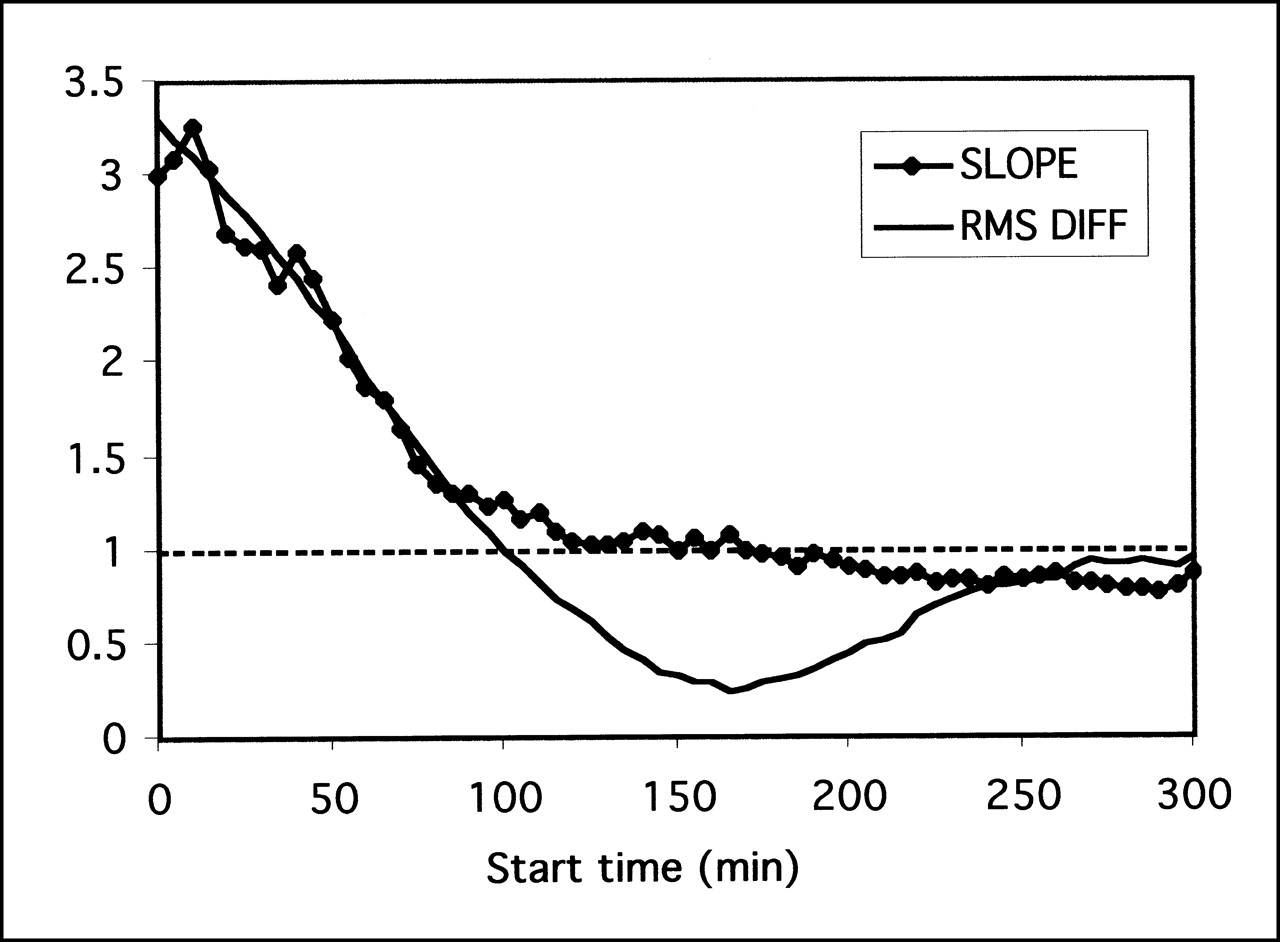
- FIGURE 6.
Determination of optimum time point for measuring ratio of midbrain to cerebellum. Ratios were derived as function of time and compared against full kinetic model result using slope of regression or RMS difference (RMS DIFF) between methods. RMS difference method reaches minimum at roughly same time as slope crosses unity, in range 160–180 min.


Tables
- TABLE 1
Kinetic Modeling Parameters Derived from Graphic Analysis of [123I]ADAM Uptake in Brain Combined with Metabolite-Corrected Arterial Plasma Data
Parameter MB t* (min) DV (mL/mL) CER MB THAL STR Mean ± SD 138 ± 28 2.25 ± 0.48 4.86 ± 1.06 3.83 ± 0.91 3.53 ± 0.68 Test–retest (%) 13.1 14.5 15.5 14.7 Intersubject (%) 10.4 11.5 13.9 9.6 ri 0.14 0.40 0.0 0.51 MB = midbrain; t
↵* = time after which graphic analysis curve becomes linear; CER = cerebellum; THAL = thalamus; STR = striatum; Test–retest = mean absolute difference between each subject’s mean value and each individual value; Intersubject = between-subject variability, calculated same way as Test–retest; ri = intraclass correlation coefficient.
- TABLE 2
Comparison of DVRs Measured with Full Kinetic Modeling Against Reference Tissue Model and Simple Ratio Technique
Parameter DVR Reference region Ratio MB THAL STR MB THAL STR MB THAL STR Mean ± SD 2.16 ± 0.23 1.70 ± 0.19 1.58 ± 0.15 2.01 ± 0.17 1.63 ± 0.16 1.53 ± 0.12 2.23 ± 0.22 1.83 ± 0.18 1.68 ± 0.19 Test–retest (%) 7.7 3.5 6.3 5.4 2.3 4.6 7.6 3.9 8.2 Intersubject (%) 5.3 8.8 6.8 5.2 8.1 5.4 6.9 7.1 9.8 ri 0.32 0.46 0.22 0.03 0.64 0.15 0.09 0.40 0.48 DVR R2 0.94 0.97 0.95 0.89 0.98 0.93 DVR slope 0.72 ± 0.07 0.86 ± 0.06 0.79 ± 0.07 0.93 ± 0.12 0.97 ± 0.05 1.23 ± 0.13 MB = midbrain; THAL = thalamus; STR = striatum; Test–retest = mean absolute difference between each subject’s mean value and each individual value; Intersubject = between-subject variability, calculated same way as Test–retest; ri = intraclass correlation coefficient; R2 = correlation coefficient of simplified methods against full kinetic model; slope = gradient of regression between simplified methods of analysis and full kinetic model.
In this issue


Jump to section
Related Articles
Cited By...
- Evaluation of the Serotonin Transporter Ligand 123I-ADAM for SPECT Studies on Humans
- Optimal Metabolite Curve Fitting for Kinetic Modeling of 11C-WAY-100635
- Imaging the serotonin transporter during major depressive disorder and antidepressant treatment: 2005 CCNP Young Investigator Award Paper
- SPECT of Serotonin Transporters Using 123I-ADAM: Optimal Imaging Time After Bolus Injection and Long-Term Test-Retest in Healthy Volunteers
- 123I-ADAM Binding to Serotonin Transporters in Patients with Major Depression and Healthy Controls: A Preliminary Study
- Biodistribution and Imaging with 123I-ADAM: A Serotonin Transporter Imaging Agent
- Characterization of the Binding Sites for 123I-ADAM and the Relationship to the Serotonin Transporter in Rat and Mouse Brains Using Quantitative Autoradiography
- Molecular Targeting with Radionuclides: State of the Science
- Long-Term Effects of "Ecstasy" Use on Serotonin Transporters of the Brain Investigated by PET
- Pharmacological Characterization of N,N-Dimethyl-2-(2-amino-4-methylphenyl thio)benzylamine as a Ligand of the Serotonin Transporter with High Affinity and Selectivity