
Main menu

  • Home
  • Content
    • Current
    • Ahead of print
    • Past Issues
    • JNM Supplement
    • SNMMI Annual Meeting Abstracts
    • Continuing Education
    • JNM Podcasts
  • Subscriptions
    • Subscribers
    • Institutional and Non-member
    • Rates
    • Journal Claims
    • Corporate & Special Sales
  • Authors
    • Submit to JNM
    • Information for Authors
    • Assignment of Copyright
    • AQARA requirements
  • Info
    • Reviewers
    • Permissions
    • Advertisers
  • About
    • About Us
    • Editorial Board
    • Contact Information
  • More
    • Alerts
    • Feedback
    • Help
    • SNMMI Journals
  • SNMMI
    • JNM
    • JNMT
    • SNMMI Journals
    • SNMMI

User menu

  • Subscribe
  • My alerts
  • Log in
  • Log out
  • My Cart

Search

  • Advanced search
Journal of Nuclear Medicine
  • SNMMI
    • JNM
    • JNMT
    • SNMMI Journals
    • SNMMI
  • Subscribe
  • My alerts
  • Log in
  • Log out
  • My Cart
Journal of Nuclear Medicine

Advanced Search

  • Home
  • Content
    • Current
    • Ahead of print
    • Past Issues
    • JNM Supplement
    • SNMMI Annual Meeting Abstracts
    • Continuing Education
    • JNM Podcasts
  • Subscriptions
    • Subscribers
    • Institutional and Non-member
    • Rates
    • Journal Claims
    • Corporate & Special Sales
  • Authors
    • Submit to JNM
    • Information for Authors
    • Assignment of Copyright
    • AQARA requirements
  • Info
    • Reviewers
    • Permissions
    • Advertisers
  • About
    • About Us
    • Editorial Board
    • Contact Information
  • More
    • Alerts
    • Feedback
    • Help
    • SNMMI Journals
  • View or Listen to JNM Podcast
  • Visit JNM on Facebook
  • Join JNM on LinkedIn
  • Follow JNM on Twitter
  • Subscribe to our RSS feeds
Research ArticleMolecular Imaging of Cancer: From Molecules to Humans

Causes and Consequences of Increased Glucose Metabolism of Cancers

Robert J. Gillies, Ian Robey and Robert A. Gatenby
Journal of Nuclear Medicine June 2008, 49 (Suppl 2) 24S-42S; DOI: https://doi.org/10.2967/jnumed.107.047258
Robert J. Gillies
  • Find this author on Google Scholar
  • Find this author on PubMed
  • Search for this author on this site
Ian Robey
  • Find this author on Google Scholar
  • Find this author on PubMed
  • Search for this author on this site
Robert A. Gatenby
  • Find this author on Google Scholar
  • Find this author on PubMed
  • Search for this author on this site
  • Article
  • Figures & Data
  • Info & Metrics
  • PDF
Loading

Abstract

In this review we examine the mechanisms (causes) underlying the increased glucose consumption observed in tumors within a teleological context (consequences). In other words, we will ask not only “How do cancers have high glycolysis?” but also, “Why?” We believe that the insights gained from answering the latter question support the conclusion that elevated glucose consumption is a necessary component of carcinogenesis. Specifically we propose that glycolysis is elevated because it produces acid, which provides an evolutionary advantage to cancer cells vis-à-vis normal parenchyma into which they invade.

  • cancer
  • glucose
  • metabolism
  • carcinogenesis
  • acid-base
  • somatic evolution

In 1976, Sidney Weinhouse, a pioneer in the investigation of cancer metabolism (Fig. 1), stated that, “Since our perspectives have broadened over the years, the burning issues of glycolysis and respiration in cancer now flicker only dimly” (1). 18F-FDG PET imaging has rekindled interest in the metabolic control of cancer by demonstrating a remarkable preponderance of metastatic cancers to trap far more glucose than normal tissue. This observation has been the starting point for Darwinian-based mathematic models to answer the question: “Why do metastatic cancers have such high rates of glucose consumption”? Driving this research is the assumption that all aspects of tumor biology including progression, invasion, and metastases are the result of a continuous optimization process governed by Darwinian dynamics (Fig. 2). This leads to a fundamental assumption that any common phenotype (including aerobic glycolysis) must always confer a selective advantage on the cells that possess such a phenotype. Within an evolutionary/bioenergetic context, aerobic glycolysis would appear to be a conundrum because glycolytic metabolism is very inefficient (producing only 2 mol of adenosine triphosphate [ATP] per mole of glucose vs. 36 mol of ATP per mole of glucose for the citric acid cycle) and generates an acidic, potentially toxic environment. Thus, there does not appear to be a significant adaptive advantage of using glycolysis when oxygen is present (the Warburg effect). Yet, its prevalence in the overwhelming majority of metastatic tumors is compelling evidence that aerobic glycolysis plays a very significant role in promoting tumor development.

FIGURE 1. 
  • Download figure
  • Open in new tab
  • Download powerpoint
FIGURE 1. 

Sidney Weinhouse. (Courtesy of the Office of NIH History, National Institutes of Health.)

FIGURE 2. 
  • Download figure
  • Open in new tab
  • Download powerpoint
FIGURE 2. 

Charles Darwin, circa 1870, by Julia Margaret Cameron (1815–1879).

To address this, the evolutionary dynamics of carcinogenesis have been modeled using several mathematic methods, including information theory, evolutionary game theory, reaction–diffusion models, and modified cellular automata (2–12). Insights from these models combined with modern imaging, what we have termed “imag(in)ing,” have demonstrated that hypoxia and acidosis develop inevitably in the microenvironment of premalignant epithelial tumors, such as ductal carcinoma in situ (DCIS). This results from aberrant proliferation that carries cells away from their underlying blood supply, which remains on the opposite side of an intact basement membrane (BM). These conditions serve as microenvironmental selection forces that govern cellular adaptation during the later stages of somatic evolution. The models demonstrate that, after this evolutionary pathway, aerobic glycolysis does in fact confer a significant growth advantage because it produces a toxic, acidic environment which is more toxic to adjacent tissue compared with the cancer cells themselves. In the process, corollaries have been uncovered that explain other observed phenomena in cancers, namely the extreme variability in gene expression patterns.

This review will discuss causes and consequences of increased aerobic glycolysis by connecting mechanistic information to teleology. It will begin with an introduction to canonical views of carcinogenesis and its molecular controls. This will be followed by a brief review of the evidence that 18F-FDG uptake is elevated in metastatic cancers and a discussion of the molecular causes and consequences of this elevated glycolysis in cancer. Evolutionary Game Theory models and their predictions will then be described and the subsequent imaging of cancer histopathology, tumor hypoxia, and tumor pH. These data have led to additional conceptual models, derived from mathematic models, which attempt to describe carcinogenesis as a series of adaptations to environmental selections.

CARCINOGENESIS AND MICROENVIRONMENT

Cancer Progression

Before we consider the pathophysiology of cancer, the developmental origin of cancer cells and their normal physiologic niches must be discussed. In adults, there are essentially 2 types of tissues: epithelia and stroma. These are behaviorally distinct tissues in that epithelia are highly polarized and will grow in monolayers along a single axis, whereas stromal cells are phenotypically plastic, highly motile, and can grow in response to morphogenetic gradients in any direction. Neoplasia of epithelia gives rise to carcinomas, such as breast, lung, pancreatic, prostate, or melanoma, which have a high prevalence in adults. Stromal cancers include sarcomas, gliomas, and liquid cancers, which are more prevalent in the young (Table 1). In mature organs, epithelia and stroma are physically separated by a BM made of laminin, collagen IV, proteoglycan, and various growth factors and proteases (13). On one side of the BM, epithelial cells grow in a mono- or bilayer of polarized cells, forming a duct that is contiguous with the outside world. On the other side of the BM lies a stroma of connective tissue containing fibroblasts, muscle, blood, and lymphatic vessels, which are constantly remodeling (Fig. 3). Epithelial and stromal components are established during embryogenesis from the 3 primordial germ cell layers of ectoderm, endoderm, and mesoderm that give rise to skin and nervous system, epithelia, and mesenchymal tissues, respectively (Fig. 4). Epithelia are generally derived from endoderm and ectoderm (dermis), and stromal components are generally derived from mesoderm. However, there is significant plasticity, and cell fates are more dependent on spatial and conditional factors than their cell of origin (14). This plasticity has significance to cancer, as epithelial cells undergo a transition to a mesenchymal phenotype (an epithelial-to-mesenchymal transition) concomitant with their adoption of an invasive phenotype (15).

FIGURE 3. 
  • Download figure
  • Open in new tab
  • Download powerpoint
FIGURE 3. 

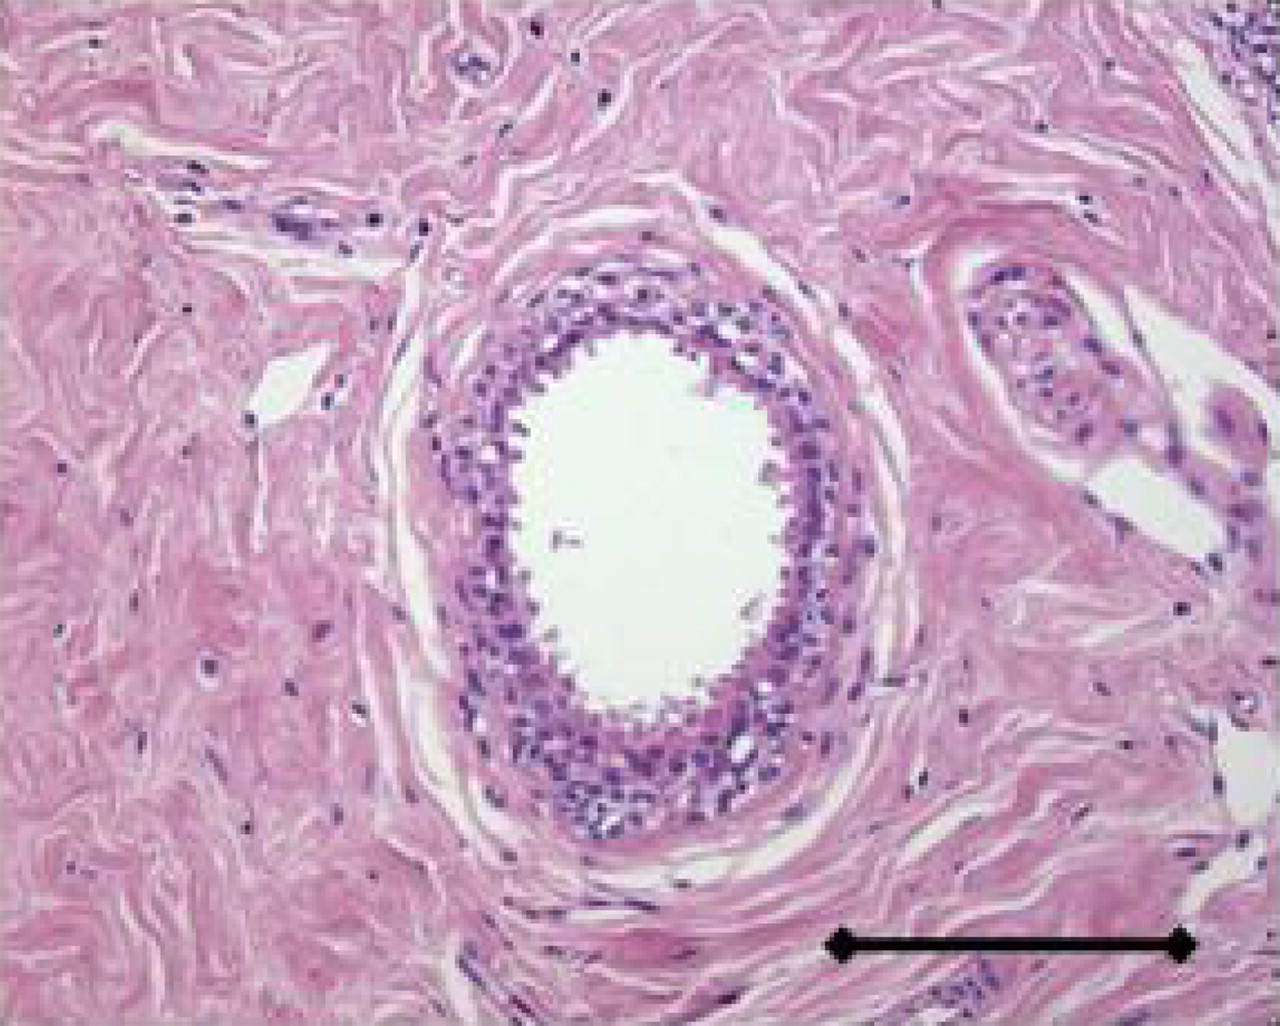
Normal human breast duct. Bar = 0.2 mm.

FIGURE 4. 
  • Download figure
  • Open in new tab
  • Download powerpoint
FIGURE 4. 

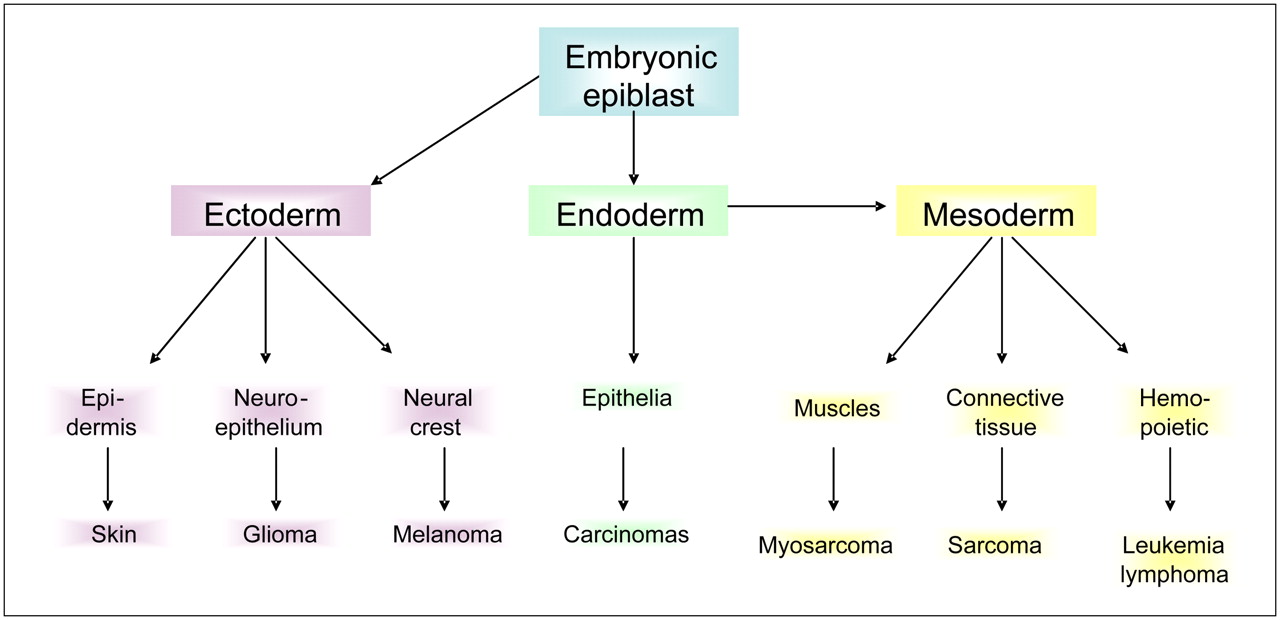
Developmental origins of tissues and cancers.

View this table:
  • View inline
  • View popup
TABLE 1

Incidence of Cancers and Mortality in U.S. Adults and Children (All Races, per 100,000)

Development of carcinomas proceeds through distinct stages, as shown for colorectal cancer in Figure 5. The initial genetic changes result in hyperplasia that progresses into dysplasia within the lumen of the ducts. The dysplastic condition, known as carcinoma in situ (CiS), or adenoma in the case of colorectal cancer (CRC), progresses through early, middle, and late phases yet still remains separated from the stroma by the BM. Once the BM is breached, the cells make contact with the stroma to become a locally invasive cancer. Further evolution is then required to allow the avascular microscopic disease to “partner” with the stromal cells to promote angiogenesis and extracellular matrix remodeling. The invasive tumor cells, either directly or indirectly via lymphatics, enter the bloodstream (intravasation). A small fraction of these are able to extravasate and colonize distant sites, forming metastatic cancer.

FIGURE 5. 
  • Download figure
  • Open in new tab
  • Download powerpoint
FIGURE 5. 

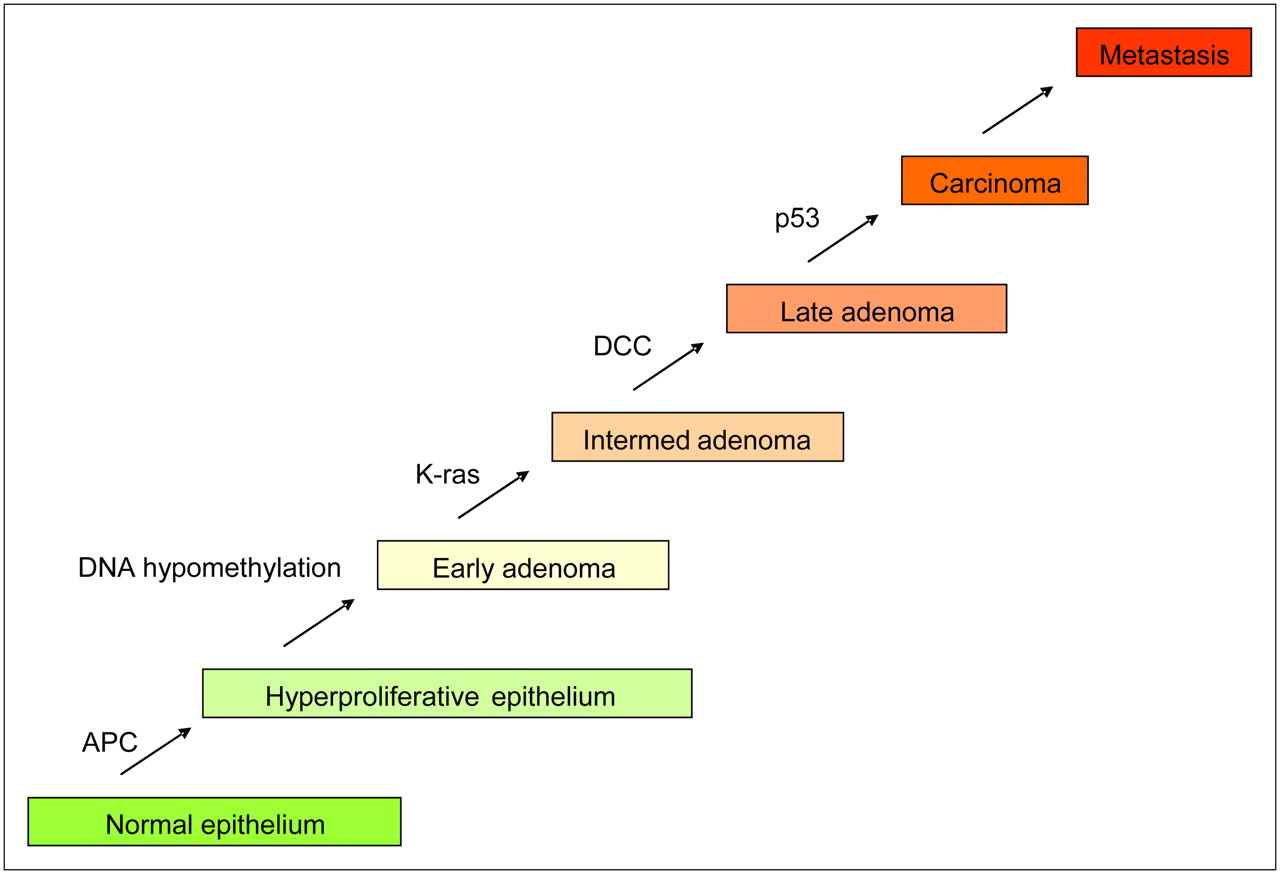
Genetic changes during colorectal carcinogenesis. APC = adenomatosis polyposis coli; DCC = deleted in colorectal cancer; Intermed = intermediate. (Modified from (23).)

Although significant differences among cancers exist, there are some phenotypic elements common to all cancers, which are known as the “hallmarks of cancer”: evading apoptosis, self-sufficiency in growth signals, insensitivity to antigrowth signals, tissue invasion and metastasis, limitless potential to replicate, and sustained angiogenesis (16). We propose that all commonly observed traits must confer specific adaptive advantages to cancer cells as they progress. In other words, the hallmarks of cancer can be viewed as the phenotypic adaptation necessary to overcome all of the proliferation barriers that evolving tumor populations encounter during their progression through carcinogenesis.

Early Carcinogenesis

The initial steps in carcinogenesis result in the transformation of normal epithelium to epithelium that is hyperplastic, which results in cellular proliferation away from the BM, forming multilayer growth. We argue that, whatever the mechanism, these steps have to involve a deregulation of cell–cell and cell–matrix growth inhibitory interactions that maintain the epithelia in a monolayer (17). Despite the importance of this step, the molecular mechanisms of initiation and promotion have remained elusive. It is commonly assumed that this step requires genotoxic stress, as cancers can be initiated by chemicals that form DNA adducts (18). Hence, radiation damage or inflammation-derived reactive oxygen species, combined with deficiencies in DNA repair, could also be initiating events. The initiating events likely involve mutational activation of proto-oncogenes to oncogenes. Proto-oncogenes are normal cellular constituents that are involved in regulation of cell cycle and proliferation that, when activated, can give rise to unregulated growth, a hallmark of cancers. These can be activated through chemical carcinogens, and some have homologs in RNA viruses. Fusion of these 2 approaches with characterization of the src oncogene by Varmus and Bishop was awarded the Nobel Prize in 1986 (19). Table 2 lists common classes of proto-oncogenes and the incidence of their representative oncogenes.

View this table:
  • View inline
  • View popup
TABLE 2

Representative Oncogenes and Tumor Suppressor Genes

Chronic activation of pro-proliferative pathways would normally be opposed by the action of proliferation suppressor gene products that include cell cycle checkpoint genes (20,21). Hence, carcinogenesis is also associated with loss of function of tumor suppressor genes, some of which are listed in Table 2. Typically, humans that are heterozygous for tumor suppressor genes have increased susceptibilities to cancers after loss of heterozygosity. This heritable loss of function can occur through genetic mutations, through chromosomal loss, or through epigenetic mechanisms, such as DNA methylation (22).

Genetic Models of Carcinogenesis

The developmental progression of many cancers can be evaluated and predicted according to their complement of induced oncogenes and repressed tumor suppressor genes. Fearon and Vogelstein were the first to document this for colorectal cancer, CRC (23). In this work, they identified distinct stages of CRC from normal epithelium to metastatic disease (Fig. 5). In samples from each of these stages, they identified chromosomal and genetic alterations associated with each stage. As cancers progressed, they accumulated genetic alterations such that, for example, the incidence of mutated ras increased from ∼7% in early adenoma to ∼55% in intermediate, ∼60% in late, and ∼45% in invasive carcinomas. Thus, it can be proposed that this mutation caused cells to be more aggressive but that it was not necessary once cells metastasized. These data support a clonal, evolutionary model of carcinogenesis, such as that diagrammed in Fig. 6. Environmental or endogenous factors induce genotoxic stress, which is normally repaired. However, with relative frequency, genetic alterations can be fixed in a cell (green) that will render it more proliferative. These expand and accumulate successive mutations (blue, red) that each contribute to development of a more aggressive cancer phenotype. This model represents current thinking, which is decidedly genocentric.

FIGURE 6. 
  • Download figure
  • Open in new tab
  • Download powerpoint
FIGURE 6. 

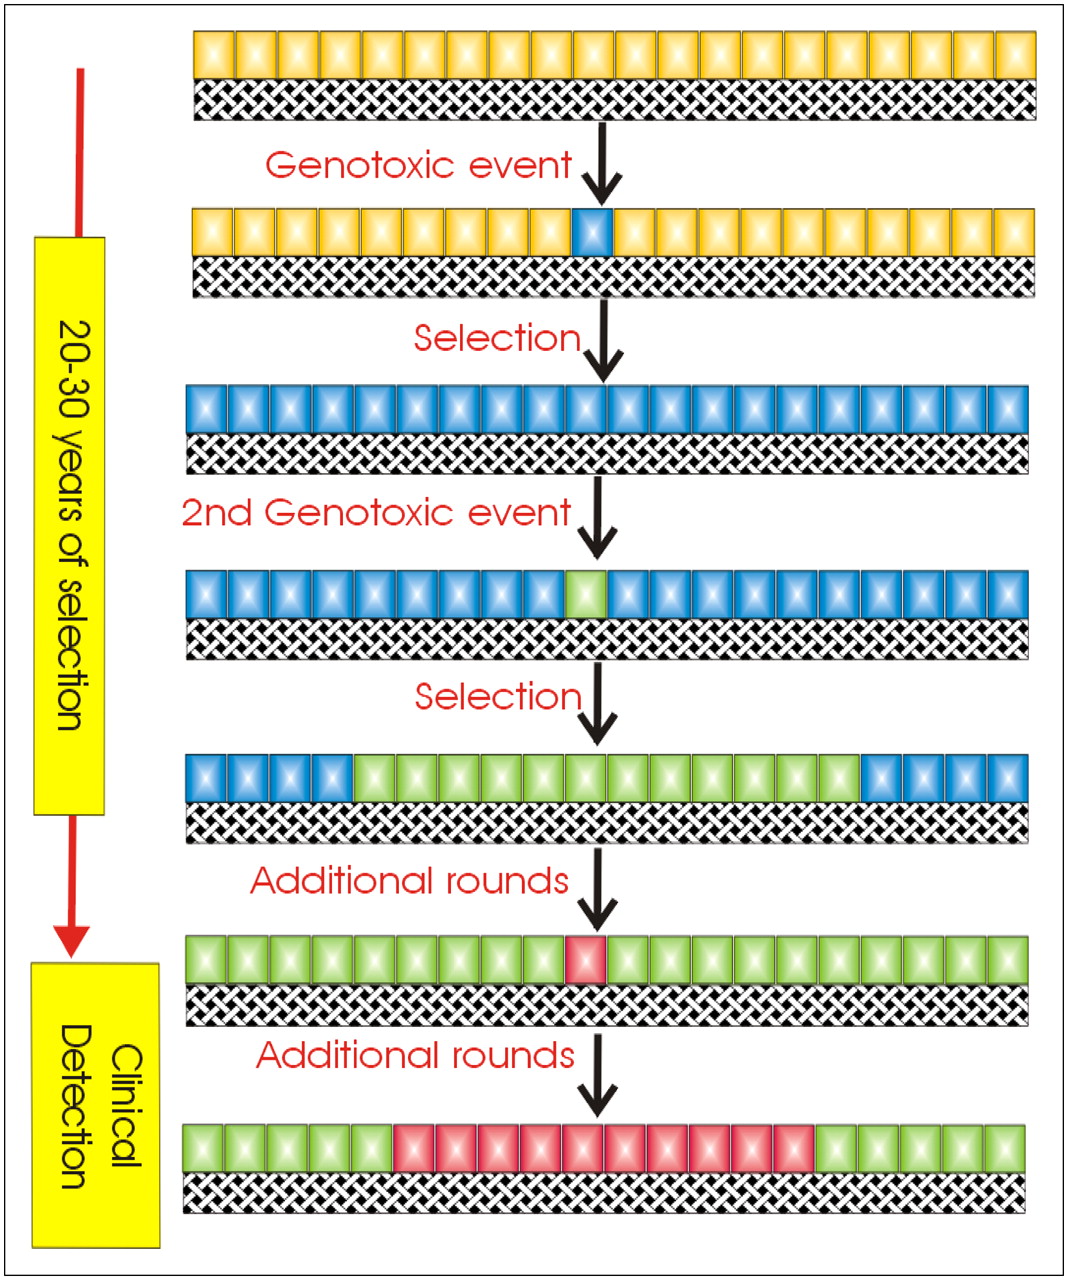
Model for clonal growth of cancers.

Although this model alludes to the clonal expansion of tumor cells as an evolutionary process, it virtually ignores the altering environmental landscape that leads to selection. The interaction between gene products and their environment in carcinogenesis has been the subject of recent models from our group and others.

Microenvironment During Cancer Progression

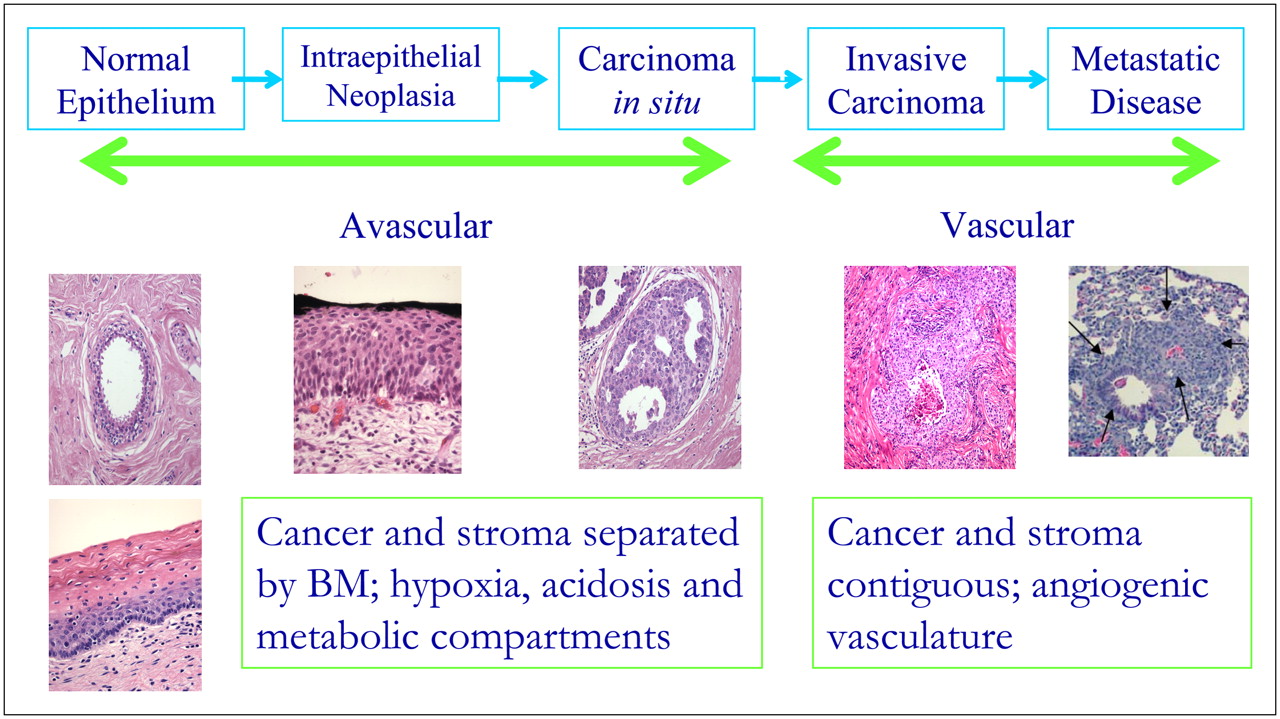
As preinvasive cancers proliferate and evolve, their microenvironment is altered, as shown in Figure 7. Normal epithelia are single cell layers growing on a BM surface, surrounded by stroma. These cells are adjacent to blood vessels on the other side of the BM and so are well perfused with serum growth factors and nutrients. Hence, the proliferation of normal epithelial cells into the lumen must be constrained through cell–cell and cell–BM interactions. If epithelial cells die, they are sloughed off into the lumen. The lack of cell–cell contact will induce an adjacent cell to divide to fill the space. Notably, proliferating cells require attachment to the BM to proliferate and survive. If this attachment is abrogated, the cell will die through a process termed “anoikis,” which is a specialized form of cell death (24,25). Thus, the earliest phenotypic changes observed in carcinogenesis must be adaptations that suppress anoikis. These include acquisition of the ability to proliferate when not in contact with the BM as well as relaxation of cell–cell contact inhibition so that cells can continually proliferate under conditions that would ordinarily suppress growth. Such alterations can be triggered by a multitude of genetic changes, which introduces the principle of “functional equivalence.” This principle states that multiple genetic alterations can produce similar phenotypic sequelae. Thus, at this early stage, many genetic alterations can initiate cancer growth, but they must have in common a phenotype of resistance to anoikis and reduced cell–cell contact inhibition.

FIGURE 7. 
  • Download figure
  • Open in new tab
  • Download powerpoint
FIGURE 7. 

Morphologic changes associated with cancer progression.

With increased hyperplasia (dysplasia), the growing epithelium becomes many layers thick. As we have pointed out in prior work, this results in steeper gradients for delivery of substrates (13) as well as stromal-derived growth factors. A notable consequence of this increasing gradient is that the periluminal cells become increasingly oxygen deprived as hyperplasia transitions to dysplasia in CiS lesions. In breast cancers, staining for hypoxia-induced gene products, such as glucose transporter isoform 1 (Glut-1) or carbonic anhydrase (CA) IX (CA-IX), shows that periluminal hypoxia becomes evident in late-stage DCIS (comedo) lesions (26). Thus, during transition from early to late dysplastic lesions, regional variations in the local microenvironment occur with, among other things, substantial periluminal hypoxia. This heterogeneity in the microenvironment alters the selection forces in the “adaptive landscape” and, thus, the adaptive properties of the evolving cancer phenotypes.

Hypoxia and acidosis will select for cells that are apoptosis- resistant (27–32). Notably, the genetic alterations that occur early during carcinogenesis (i.e., to relax contact inhibition) may or may not increase the fitness for this second round of selection. If they do, then they are said to exhibit “multibarrier effects.” For example, K-ras not only will reduce contact inhibition, it will also make cells more resistant to apoptosis and thus would be an effective multibarrier oncogene. Alterations to integrins can reduce anoikis but will not necessarily render cells apoptosis-resistant.

A consequence of hypoxic selection may be increased glucose consumption through stabilization of hypoxia-inducible factor (HIF) 1α (HIF-1α) (30). Hence, it is possible that the glycolytic phenotype is established during this phase of cancer progression. Indeed, increased 18F-FDG uptake in mouse tumors occurs before transition to an invasive phenotype (33). Glucose metabolism invariably leads to increased acid production, and the effect of this on acidification of the interstitial pH can be exacerbated by reduced perfusion in the periluminal volume of in situ lesions (34,35). Acid pH has been shown to increase invasive behavior (36–42). Thus, one mechanism of cancer progression may involve elevated glycolysis leading to acidosis that leads to invasion. However, although it is often observed, according to the equivalence principle, elevated glucose consumption need not be a prerequisite for cancers to transition from a CiS to an invasive carcinoma. Alternative mechanisms can be envisioned whereby cells can acquire an invasive phenotype without glycolysis and acidosis.

Transitioning to an invasive cancer involves breaking through the BM, giving epithelial cells direct access to the vasculature and the stroma for the first time in their natural history (vide supra). It is at this time, through unknown mechanisms, that these cancer cells undergo an epithelial-to-mesenchymal transition. These mesenchymelike cells are more highly motile than their epithelial precursors and can be characterized by expression of stroma-specific markers (43–45).

With direct access to the stroma, cancer cells can disperse through the heme or the lymphatic vasculature. Migration of these cells through lymphatic vessels results in colonization of the draining lymph nodes in a characteristic pattern. Thus, in breast cancer, the draining axillary lymph nodes are generally the first to become involved and are thus known as sentinel nodes. Either directly or indirectly via lymphatics, invasive cancer cells eventually find themselves in the bloodstream. It has been estimated that a 1-cm3 tumor will shed as many as 106 cancer cells per day into the blood (46). Through specific endothelial cell interactions, cancer cells will lodge in ectopic sites that are specific for different cancers. The occurrence of metastases in specific organs led to Paget's “seed–soil” hypothesis, wherein the host organ provides factors necessary for the growth of the metastatic lesion (47). Despite intensive study for more than a century, these factors remain unknown.

In order to form successful metastases, the cancer cells must survive, colonize, and grow in the host tissue. Survival is a rare event, estimated at less than 1 cell per 1,000, although this may be dependent on the relative population of cells with “stemlike” properties (48). Colonization results in micrometastases, which can be abundant and are less than 1.0 mm in diameter. The switch from micro- to macrometastases is incompletely understood but likely involves neoangiogenesis (49).

The acid-mediated invasion hypothesis proposes that successfully invasive tumor lesions export glucose-derived H+, which leads to degradation of the extracellular matrix, thereby allowing more efficient invasion of the cancer into a host organ. This has been shown both theoretically (11) and empirically using window chambers (50). Figure 8 shows periodic acid–Schiff staining of a biopsy from an invasive metastatic colon cancer in the liver, showing a “halo” of less dense extracellular matrix surrounding the lesion. Hence, we propose that successful metastatic cancers are those that can produce H+. As these H+ are glucose-derived, then it follows that successful metastatic cancers consume high amounts of glucose, to produce acid. This appears to be the case, as evidenced from 18F-FDG PET.

FIGURE 8. 
  • Download figure
  • Open in new tab
  • Download powerpoint
FIGURE 8. 

Periodic acid–Schiff staining of hepatic colorectal metastasis.

18F-FDG PET OF AEROBIC GLYCOLYSIS IN METASTASES

Perhaps no other imaging test has had as much impact on the fundamental understanding of human cancer as has 18F-FDG PET. Although 18F-FDG avidity can be highly variable in primary cancers, it has an extremely high sensitivity and specificity for metastases. This was comprehensively reviewed in 2001 (51) and discussed within the context of drug development in 2005 (52). Table 3 shows a recapitulation of data from Gambhir et al. (51). Although the ranges are broad, the average sensitivity and specificity are high. Generally speaking, once a cancer progresses to distant metastases beyond lymph nodes, the sensitivity and specificity are greater than 90% (except for prostate cancers).

View this table:
  • View inline
  • View popup
TABLE 3

Sensitivity and Specificity of 18F-FDG PET for Detection and Staging of Metastases

These data are mirrored in Table 4, which includes studies that are more recent than the 2001 review. Note that the sensitivity of cervical and prostate lymph node metastases are not high, but most other metastatic carcinomas have sensitivities and specificities of greater than 90%. As discussed in previous publications, reductions in sensitivity are primarily caused by small lesions with motion, and reductions in specificity can be due to local inflammation (53).

View this table:
  • View inline
  • View popup
TABLE 4

Detection of Metastases by 18F-FDG PET

The common observation of enhanced 18F-FDG uptake indicates that it is a fundamental property of metastases (vide infra). This could suggest a commonality of mechanisms, yet this does not appear to be the case, as described later in this article.

MOLECULAR MECHANISMS REGULATING GLUCOSE UPTAKE

Glucose metabolism is essential to generate both catabolic and anabolic precursors. Thus, it is not surprising that there are a multitude of pathways that activate glucose metabolism. It has long been assumed that the primary function of glucose is to provide energy to the cell in the form of ATP as an alternative to mitochondrial respiration. Hence, a major regulator of glucose consumption is the availability of oxygen, which was first described by Pasteur (Fig. 9) in 1856 (54,55). Thus, glucose consumption is higher in hypoxic tissues (55,56). Although 18F-FDG uptake can be elevated in response to hypoxia, seminal studies comparing 18F-FDG uptake with retention of hypoxic markers (18F-misonidazole, 18F-pimonizaole) have shown little correlation between hypoxia and 18F-FDG uptake in humans (57,58), indicating that cancers continue to consume glucose at high rates, even in the presence of adequate oxygen, an effect first described by Warburg (Fig. 10) in 1930 (59).

FIGURE 9. 
  • Download figure
  • Open in new tab
  • Download powerpoint
FIGURE 9. 

Louis Pasteur.

FIGURE 10. 
  • Download figure
  • Open in new tab
  • Download powerpoint
FIGURE 10. 

Otto Warburg.

Hence, “aerobic glycolysis” can be described as a cancer hallmark (60). Elevated rates of 18F-FDG uptake are strongly negatively correlated to patient outcome in many cancers (51,61), as are elevated lactate levels (62,63). Hence, elevated glucose consumption may play an essential role in cancer progression. Genes of glycolysis are ubiquitously overexpressed in cancers (64) (65). Thus, it is of fundamental importance to understand the molecular mechanisms regulating the metabolic switch to aerobic glycolysis. The biochemical uptake mechanisms of 18F-FDG were reviewed by Pauwels et al. in 2000 (66). As discussed later in this article, there does not appear to be a single mechanism for control of aerobic glycolysis in all cancers. A conceptual framework for interpreting this observation is discussed at the end of this section.

GLUT and HK

The 2 major proteins that are unequivocally associated with increased 18F-FDG uptake in cancers are the glucose transporter, primarily GLUT-1, and hexokinase, primarily HK-2 (67–69). Thus, insights can be obtained by examining the molecular controls over the expression and activity of these proteins. Given the physiologic importance of glucose uptake, it is not surprising that GLUT-1 expression is regulated by several hormones, both extracellular, such as insulin, prolactin, follicle stimulating hormone, noradrenaline, and vasopressin, and intracellular, such as testosterone, estrogen, progesterone, glucocorticoids, retinoic acid, and thyroxin (70,71). Some of these effects are likely mediated via activity of the SP1 transcription factor (72,73) or cyclic adenosine monophosphate (cAMP) levels (74), both of which can be dysregulated in cancers.

In addition to control by glucose levels, HK-2 expression can be affected by hormones such as insulin, and second messengers such as cAMP (75,76). The HK-2 isoform is notable because it is reversibly bound to mitochondria and is a key regulator of glycolysis and survival in multiple cancers, where it is a poor prognostic indicator (77–79). When bound to mitochondria, HK-2 preferentially uses mitochondrion-generated ATP to phosphorylate glucose very efficiently (80). Drugs, such as clotrimazole, can induce a dose-dependent detachment of hexokinase from mitochondria and inhibit glycolysis (81). Notably, the binding site for HK-2 on the mitochondrial membrane is the voltage-dependent anion channel (VDAC), a mitochondrial protein (porin) involved in exchange of metabolites for oxidative phosphorylation, as well as the release of cytochrome c during intrinsic apoptosis cascade (82). This is one of many instances wherein elevated glycolysis is correlated to apoptosis resistance, although delineation of a function relationship between these 2 processes has been elusive.

Mitochondrial Defects

Given the importance of glucose in energy metabolism, it is perhaps not surprising that mitochondrial defects would result in increased “aerobic” glycolysis (83). Thus, even under normoxic conditions, the cell machinery sensing the presence of oxygen would be ineffective. Indeed, Warburg's original hypothesis stated that increased aerobic glycolysis was due to a deficiency in respiration (84). Despite elegant and sophisticated methods (at the time), he was not able to prove his hypothesis during his lifetime. However, with more modern molecular techniques, mitochondrial defects have been correlated with increased aerobic glycolysis. For example, increased 18F-FDG uptake in vivo and glucose consumption in vitro correlate strongly to a loss of mitochondrial markers, such as the F1-ATPase, in lung cancers (85). Mitochondrial impairment is often seen in clear cell renal carcinomas (86). In colorectal cancers, transcriptome and proteome analyses have observed that expression of glycolytic and tricarboxylic acid cycle proteins were inversely proportional (87–89). Also, in breast cancer, the metabolic proteome undergoes a pronounced shift toward an enhanced glycolytic phenotype concurrent with a profound reduction in the F1-ATPase levels with a classification sensitivity of approximately 97% to overall and disease-free survival (90). Notably, the expression of F1-ATPase alone allowed identification of a subgroup of breast cancer patients with significantly worse prognosis. In more empiric studies, directed depletion of mitochondrial DNA resulted in reduced electron transport activity and increased glycolysis (91), or accumulated mutations in the NADH dehydrogenase subunit 2, ND2, led to increased HIF-associated aerobic glycolysis (92).

The molecular signals between mitochondria and glycolysis are likely identical to the “retrograde signaling” involved in the Pasteur effect. A central mechanism appears to involve the activity of pyruvate dehydrogenase (PDH), which is responsible for importing pyruvate into the mitochondria as a substrate for the tricarboxylic acid cycle (also known as the Krebs cycle or the citric acid cycle). The mammalian pyruvate kinase M2 isoenzyme is regulated by ATP, adenosine diphosphate, AMP, ribose-5-phosphate, fructose-1,6-bisphosphate, and the regulatory enzyme pyruvate dehydrogenase kinase 1 (PDK1). Recently, it has been shown that phosphotyrosine residues can bind to and inactivate the M2 isoform and that this diverts carbons from energy production into anabolic processes (92a). A companion article showed that knockdown of the M2 (embryonic) form of PK and replacement with the M1 (adult) isoform resulted in inhibition of aerobic glycolysis in 3 different tumor cell lines (92b). Inhibition of PDH kinase with, for example, dichloroacetate, leads to increased aerobic metabolism, decreased glycolysis, and reversal of apoptosis resistance (93). The hypoxia-inducible factor, HIF-1 (discussed later in this article), directly transactivates the gene encoding PDK1, which will lead to inhibition of PDH activity (94). Notably, reductions in PDH activity through the aforementioned mechanisms may result in increased pyruvate and lactate levels, and these will stabilize HIF-1 in an oxygen-independent manner (95). The AMP-activated kinase (AMPK) may also play an important role in transducing mitochondrial signals to the cytoplasm. For example, upregulation of glycolysis in response to mitochondrial inhibition is dependent on AMPK activity (96). Physiologically, the AMPK family of proteins comprises heterotrimeric enzymes that enhance uptake and oxidative metabolism of fatty acids and glucose, and coordinately inhibit anabolic pathways (97). They are activated by LKB1, a kinase that is inactivated in a rare hereditary form of cancer, Peutz-Jeghers syndrome (98). Mitochondrial biogenesis itself is stimulated by oncogenic signals (e.g., c-myc) and this is inhibited by chronic HIF activation (99).

It is also notable that the mitochondria are also central to the intrinsic apoptotic pathway (100). Thus, it is tempting to ascribe both increased aerobic glycolysis and apoptosis resistance (both hallmarks of cancer) to a single, central mechanism. However, empirically proving this hypothesis has proven elusive (101).

Hypoxia-Inducible Factor

HIF-1α and HIF-2α are independently paired with HIF-1β to create basic helix–loop–helix heterodimeric transcription factors that are differentially expressed in a variety of cancers (102). HIF-1α is constitutively synthesized and is degraded in an oxygen-dependent manner (103). Besides the aforementioned hypoxia and substrate-level stabilization by pyruvate and lactate, HIF proteins can be stabilized by multiple genetic factors, such as epidermal growth factor and insulin receptor activation, nitrous oxide, Akt (kinase B) activity, and ras/MEK activity (104–113). Because of this, HIF can be characterized as being reversibly increased by physiologic stress (e.g., hypoxia) or by hormonal growth factor stimulation or as being constitutively active under normoxic conditions through heritable alterations, such as activated oncogenes. Activation of HIF regulates a pleiotropic response that can involve the altered expression of up to 454 genes (114). Among the most commonly observed pathways affected are those that would be predicted to be part of a response to hypoxia, for example, increased glycolysis, increased angiogenesis, and increased iron metabolism. A major consequence of HIF activation is the stimulation of glycolysis through increased transcription of glycolytic genes (115). It is clear that HIF proteins are expressed in cancer and that their prevalence coincides with severity of disease (113,116,117). Its centrality to the regulation of glucose metabolism has led to the general belief that it alone can be responsible for the Warburg or Pasteur effects (118,119).

MYC

myc was first characterized as the transforming gene of the avian myelocytomatosis virus (v-myc). The mammalian homolog c-myc gene was first discovered in Burkitt's lymphoma, associated with a translocation in chromosome 8. The protein MYC is an oncogenic transcription factor that contains a basic helix–loop–helix leucine zipper domain. It is half of a heterodimeric transcription factor complex, usually associated with Max, another basic helix–loop–helix transcription factor. The c-myc proto-oncogene is upregulated, primarily by amplification, in from 6% (breast) to 60% (hepatocellular carcinoma; colon) of cancers and is strongly correlated to outcome (120,121). Among the many MYC/Max transcriptional targets are the genes for glycolysis (122), including lactate dehydrogenase (123,124). MYC expression leads to increased lactate production rates even under aerobic conditions, and this has been implicated to play a role in sensitivity to apoptosis (125).

In addition to directly transactivating glycolytic genes, MYC also affects glycolysis through an interaction with HIF-1. A seminal study investigating this relationship showed that HIF-1α indirectly activates p21cip1, a key cyclin-dependent kinase inhibitor that controls a G1 checkpoint, by physically binding to the MYC N-terminal region and subsequently derepressing p21cip1 function (126). The heterodimeric HIF-1 transcription factor has also been shown to activate the MXI1 gene, which encodes a repressor of MYC transcriptional activity, as well as promoting the proteosomal degradation of MYC independently of MXI1 (127). Thus, under normal conditions, HIF and MYC appear to be antagonistic, as one transcription factor signals deprivation and the other signals for growth and proliferation, respectively. However, if MYC is overexpressed, as in many cancers, HIF appears to cooperate with it in inducing transcription of HK-2 and PDH kinase, which cooperatively result in increased aerobic glycolysis, as well as transactivation of VEGF (128).

PI3K/Akt/mTOR

Phosphatidylinositol-3-kinase (PI3k) is a key regulator of fundamental cellular functions including transcription, translation, proliferation, growth, and survival (129,130). PI3k phosphorylates the 3′-OH group of phosphatidylinositol-4,5-bisphosphate (PIP2) to produce phosphatidylinositol-3,4,5-triphosphate (PIP3) (131). PIP3 acts as a binding site for plekstrin homology domain-containing proteins to translocate to the inner leaflet of the plasma membrane (132). The PTEN (phosphatase and tensin homolog deleted on chromosome 10) tumor suppressor is a PIP3 phosphatase that acts to reconvert PIP3 back to PIP2. It is inactive through deletion or mutation in many cancers, resulting in constitutively high levels of PIP3.

Akt (protein kinase B) is a 57-kDa Ser/Thr kinase that exists in 3 isoforms, with Akt-1 being most associated with epithelium-derived cancers (133). Akt contains a plekstrin homology domain and preferentially binds to PIP3, which translocates it to the plasma membrane where it is phosphorylated on Thr308 and Ser473 by membrane kinases, such as the phosphoinositide-dependent kinase, PdK-1 (134,135). In breast cancers, the Akt pathway is activated in late DCIS and in the majority of invasive breast cancers, and this is moderately correlated to PTEN loss (136,137).

Activated P-Akt phosphorylates several targets involved in aerobic glycolysis and antiapoptosis. Phosphorylated Akt stimulates glucose consumption in transformed cells without affecting the rate of oxidative phosphorylation (138). When the BAD protein is phosphorylated by Akt, it is prevented from inhibiting the antiapoptotic BCL-2 and BCL-XL proteins (139). The activation of Akt by transforming mutations, such as the amplification of HER-2/neu in breast cancer and the formation of the BCR/ABL fusion gene in chronic myelogenous leukemia, seems to be essential for the transforming activity of these oncogenes (140). High expression of Akt activity makes cells more susceptible to death after glucose withdrawal, causing this to be termed “glucose addiction” (141).

p53/TIGAR/PFKB3

p53 is a tumor suppressor transcription factor that is mutated in up to 80% of cancers (142). Its physiologic function is to produce cell cycle arrest or apoptosis in response to DNA damage (143,144). It is dysfunctional in mutated forms and hence fails to induce checkpoint arrest in response to genotoxicity, thus increasing the accumulation of potentially carcinogenic mutations (145). It has only recently been recognized that wild-type p53 plays a key role in regulating glucose consumption (146). For example, p53-induced apoptosis involves the systematic activation of multiple pathways, including those involved in glucose metabolism (147). Wild-type p53 can repress GLUT1 transcription, and mutations within the DNA-binding domain of p53, which are usually associated with malignancy, impair this repressive effect, thereby resulting in increased glucose metabolism and cell energy supply (148). Like MYC, p53 also directly affects mitochondrial biogenesis. For example, wild-type p53 affects the synthesis of cytochrome c oxidase 2, which has been ascribed to being responsible for aerobic glycolysis in p53-deficient tumors (149).

The effects of p53 on glycolysis may be mediated by a recently characterized protein, the TP53-induced glycolysis and apoptosis regulator (TIGAR), which inhibits glycolysis by modulating fructose-2,6-bisphosphate (F26bP) levels (150). F26bP increases the rate of glycolysis by allosterically activating phosphofructokinase. F26bP levels are regulated by a family of bifunctional phosphofructo-2-kinase/fructose-2,6-bisphosphatases (PFKFB1–PFKFB4). Especially relevant is isozyme 3, PFKFB3, which is activated by mitogenic stimuli and steroid hormones, and is constitutively expressed by several human tumor cells, possibly through activation by the oncogene, Ras (151,152). The gene for PFKB3 is also HIF-induced (153) and is found to be markedly elevated in multiple aggressive primary neoplasms, including colon, breast, ovarian, and thyroid carcinomas (154). Once transcribed, the protein can be activated by phosphorylation (155). Inhibition of inducible PFK-2 protein expression decreases 5-phosphoribosyl-1-pyrophosphate, a product of the pentose phosphate pathway (PPP) and an important precursor for nucleic acid biosynthesis (156).

Ras

The Ras superfamily of low-molecular-weight GTP-binding proteins includes H-Ras, K-Ras, and N-Ras, which are all active in human cancer (157). Ras activation in tumors is frequently the result of a point mutation in the Ras gene (158), which leads to constitutive activation of downstream effector enzymes that regulate cell cycle progression, survival, and migration. One of the most studied signaling pathways is through serine/threonine kinase Raf, which phosphorylates and activates a cascade of mitogen-activated protein kinases (MAPKs) and cell cycle regulatory proteins (159,160). Additionally, Ras interacts directly with the catalytic subunit of type I PI3k (161,162), which stimulates the activity of Akt (163).

Among their many functions, Ras proteins have been implicated in the regulation of aerobic glycolysis (164–167). Pharmacologic inhibition of Ras (164,168) with farnesylthiosalicylate or dominant-negative expression (169) result in the inhibition of Ras signaling to both the Raf/MEK/ERK and the PI3k pathways (170), which result in a substantial downregulation of glycolytic enzymes, including Glut-1. Likewise, stable transfection with H-Ras promotes increased glucose uptake and lactate production (171–173). In these cases, H-Ras upregulated 6-phosphofructo-1-kinase (PFK-1) activity through induction of F26bP (171,173). Increased PFK-1 activity in rat kidney cells stably transfected with Ras and human papillomavirus type 16 E7 oncoprotein leads to higher levels of fructose-1,6-bisphosphate, which allosterically activates the tetramerization of pyruvate kinase type M2 (174). This results in increased AMP levels, which suppressed DNA synthesis and cellular proliferation, probably though activation of AMPK (165,175,176). Similar results were observed in mouse fibroblasts bearing K-Ras codon-specific mutations (167).

Teleology

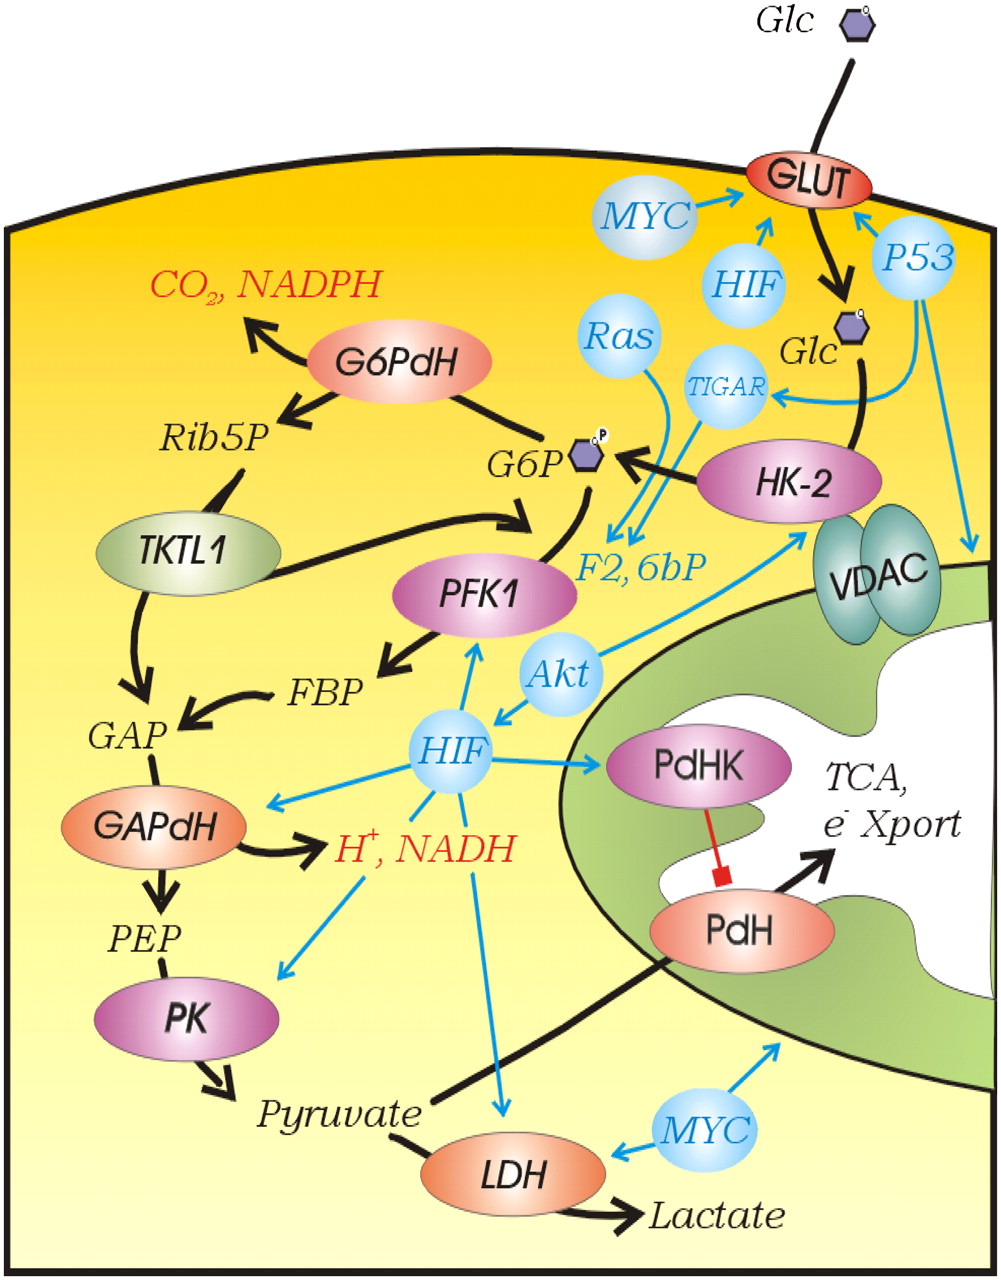
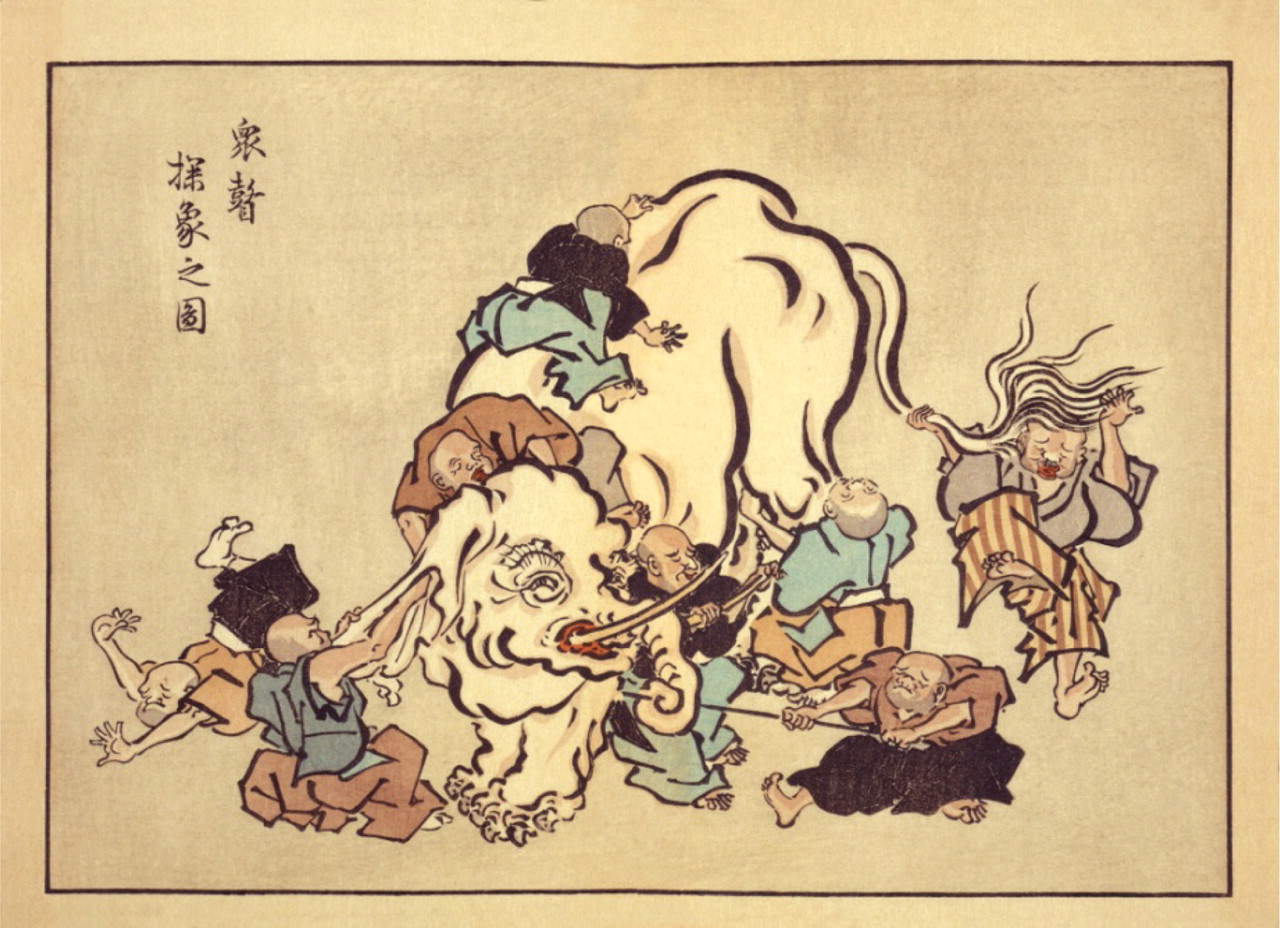
The aforementioned observations are consistent with the unsurprising conclusion that uptake and use of glucose can be controlled by a multitude of factors, all of which have been observed to participate in the increased aerobic glycolysis of cancers (Fig. 11). This stimulates the question: Is increased aerobic glucose consumption merely an epiphenomenon of oncogenic transformation or is it necessary for cancer progression? The sheer prevalence of increased 18F-FDG uptake in metastatic tumors would suggest that it is necessary. Evolutionary models are based on the assumption that any common phenotype must impart a selective advantage. Darwinian evolution is based on selection on phenotypes, not genotypes. A corollary to this is the concept of functional equivalence, in which multiple (epi)genetic mechanisms can give rise to similar phenotypes (4), and this principle can explain the well-documented genetic heterogeneity of cancers (177–180). Although it is tempting to coalesce all of the regulatory mechanisms of glycolysis into a single unified mechanism, such an endeavor may prove futile, if functional equivalence is involved. The heterogeneity of regulatory mechanisms itself conveys the message that the glycolytic phenotype itself is selected, and the mechanism by which it is induced is evolutionarily irrelevant. Like the blind men and the elephant (Fig. 12), all of the aforementioned descriptions of glycolytic control are likely correct yet incomplete, and the only common element is glycolysis itself.

FIGURE 11. 
  • Download figure
  • Open in new tab
  • Download powerpoint
FIGURE 11. 

Regulation of glycolysis. Kinase reactions are shown in purple, dehydrogenases are shown in red, and regulatory elements are shown in blue. Abbreviations are as in text. e− Xport = electron transport.

FIGURE 12. 
  • Download figure
  • Open in new tab
  • Download powerpoint
FIGURE 12. 

Blind Monks Examining an Elephant, by Itcho Hanabusa (1652–1724). (Ukiyo-e print illustration from digital catalog of U.S. Library of Congress [3g08725u.tif]).

We have previously presented evidence that the glycolytic phenotype is selected in early in situ cancers because they are faced with intermittent hypoxia (181). However, this does not explain why the glycolytic phenotype is maintained after these cancer cells have access to blood vessels and a normoxic environment during the process of metastasis (182–184). If cancers progress via Darwinian somatic evolution, it can be argued that, if it were no longer needed, the glycolytic phenotype would be selected against because it is inefficient and produces toxic by-products. However, it is also possible that these “by-products” are not toxic at all but provide important components for survival and metastasis.

CONSEQUENCES OF INCREASED GLUCOSE UPTAKE

Consumption and metabolism of glucose can produce several by-products, including ATP, reduced nicotinamide adenine dinucleotide (NADH) phosphate (NADPH), and acids. The relevant pathways are shown in Figure 11. Any or all of these may provide important components that could result in positive Darwinian selection and result in increased cancer progression and metastasis: production of ATP, production of acids (H+), production of NADPH (glutathione), and production of lactate.

Bioenergetics

The dominant perception of energy metabolism in cancer has been that ATP production is fueled by oxidative metabolism of glutamine and glucose and by the anaerobic metabolism of glucose through the Embden–Meyerhof pathway (EMP) of glycolysis, and that this ATP is needed to support a high level of oncogene-induced proliferation. However, the available data are equivocal. In a careful review of the available data from careful mass balance studies, it was concluded that, on average, cancers derive 17% of their ATP turnover from EMP glycolysis, whereas normal tissues derive around 20% (185). The total ATP turnover in MCF-7 breast cancer cells is 80% oxidative and 20% glycolytic and the entire contribution from glucose (glycolysis and oxidation) to total ATP turnover was about 23%, or twice that of glutamine (186). Uterine, lung, breast, liver, and skin cancers all derive a significant amount of energy from oxidative phosphorylation (187). A review of the mass balance of the end products of metabolism (lactate and CO2) showed that acid loads were approximately equally split between oxidative and nonoxidative products (188). The mole stoichiometries are 1 ATP per lactate and 5–6 ATP per CO2, suggesting that approximately 15% of the ATP turnover was derived from glycolysis. Thus, although the role of glycolysis in providing ATP is often invoked as a rationale for its increase in cancers, such a claim is not substantiated by available evidence. Hence, if increased ATP production is not the reason for selection of a glycolytic phenotype, other sequelae of glucose metabolism might be.

PPP

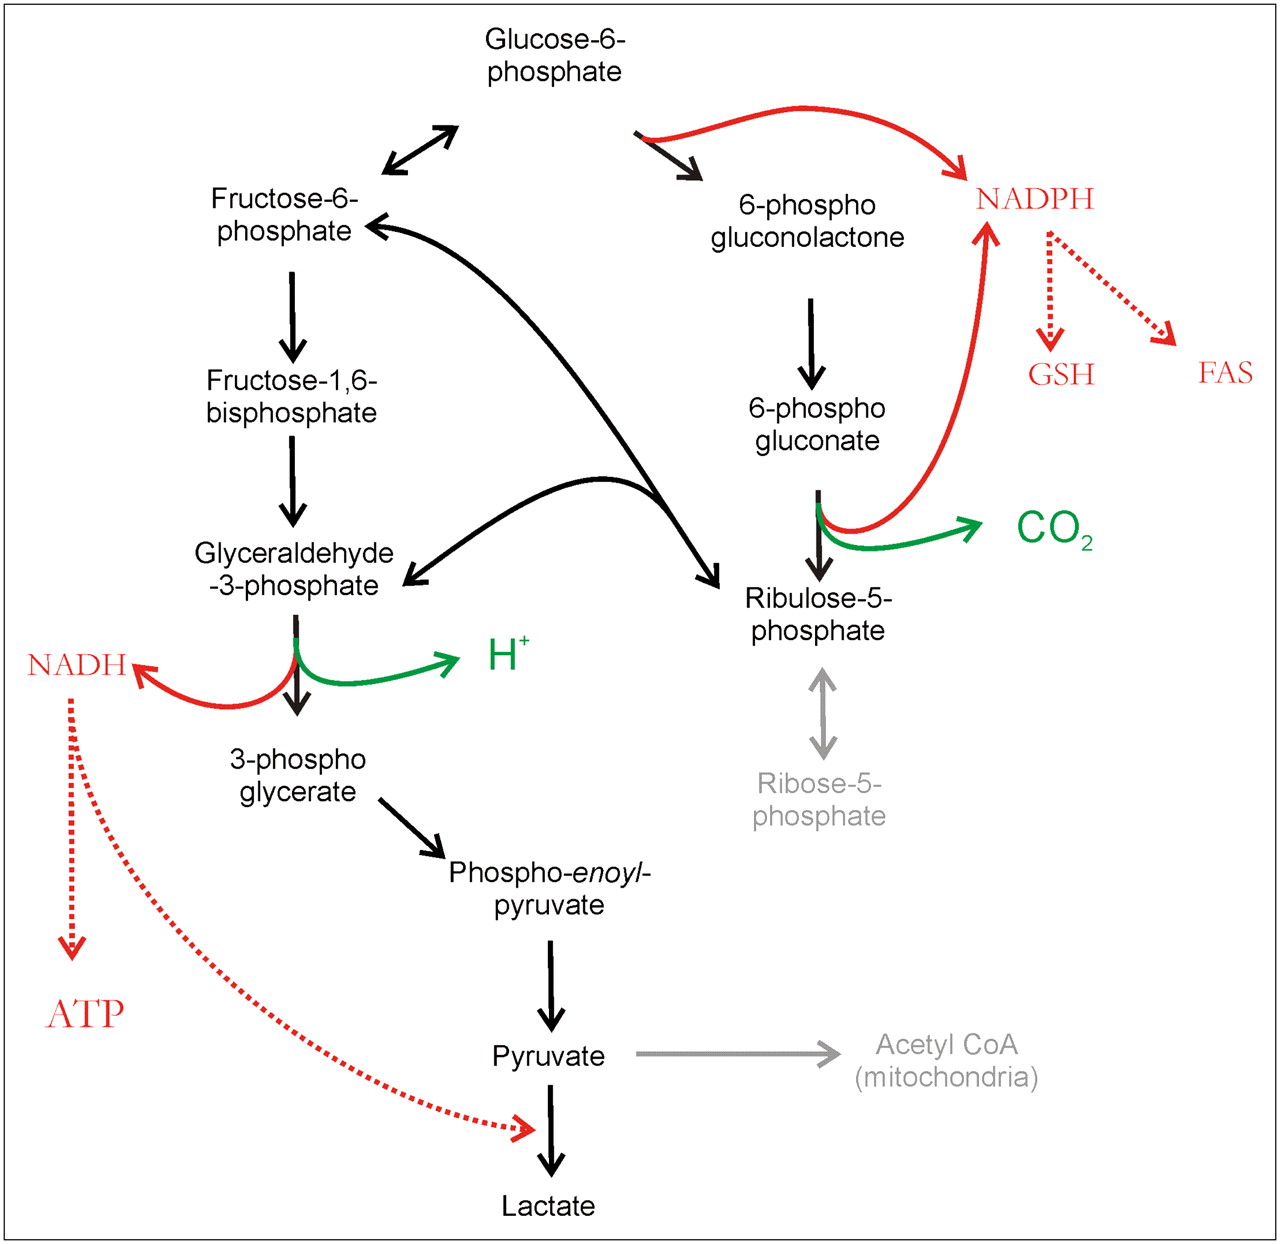
It has been alternatively proposed that some cancers, notably colorectal cancers, upregulate the PPP to convert glucose to pyruvate (189–194). Figure 13 illustrates the relationship between the PPP and EMP, which differ primarily in their redox products. The EMP produces NADH, whereas the PPP produces NADPH as well as ribose-5-phosphate (195). The production of ribose-5P for nucleic acid biosynthesis had been proposed as a rationale for the increase in the PPP by Warburg. NADPH and NADH are equivalent in terms of their ability to maintain an oxidizing cytoplasm in the face of anaerobiosis (196). NADPH can be used for reducing glutathione for antioxidant defenses and there is evidence that PPP activity makes cells more resistant to reactive oxygen species–induced apoptosis (197). NADPH is also a necessary cofactor for fatty acid synthesis and, indeed, increased rates of fatty acid synthesis have been observed in many cancers (198,199). NADH can be used to reduce pyruvate to lactate or to make ATP via mitochondrial oxidative phosphorylation (200). Entry into the upper (oxidative) part of the PPP is regulated by glucose-6-phosphate dehydrogenase (201). The lower, nonoxidative part of the PPP is controlled by transketolase enzyme reactions. A mutated transketolase transcript (TKTL1) has been detected in human malignancies and correlated to poor patient outcome in CRC (202). Thus, the PPP-derived metabolites include antioxidants, nucleic acid precursors, and substrates for fatty acid synthesis, any one of which could be selected to enhance cancer cell survival.

FIGURE 13. 
  • Download figure
  • Open in new tab
  • Download powerpoint
FIGURE 13. 

Pathways of glycolysis. Glucose-6-phosphate can be metabolized by Embden–Meyerhoff pathway (left) or PPP (right). In PPP, conversion to ribulose-5-phosphate (oxidative phase) is accompanied by elaboration of CO2 and generation of 2 NADPH molecules, which are used to reduce glutathione (GSH) or fatty acid synthase (FAS). Ribulose can reenter glycolysis via transketolase conversion to fructose-6-phosphate and GAP. CoA = coenzyme A.

Acidosis

Whether glucose is metabolized aerobically or anaerobically, the secreted end products are acids: CO2 and lactate, respectively. CO2 is hydrated to (HCO3−+H+) in a reaction catalyzed by CA. An extracellular CA isozyme, CA-IX, is upregulated by HIF and promotes this hydration to contribute to extracellular acidification (203–205). Although the end-product lactate is an acid, the H+ is actually produced at the level of GAPdH during glycolysis. Hence, production of lactate and H+ is not tightly coupled, an effect that has been observed with in vivo pH and metabolite mapping (206). Lactate is efficiently removed from cells via a monocarboxylate transporter, MCT-4, which can also be HIF-inducible (207). The hydrogen ions are removed by ion transporters, notably the sodium-hydrogen exchanger, NHE-1 (208), although other transporters, such as V-ATPase and anion exchangers, may also be used to export H+ (209,210). Increased acid production and export, combined with poor perfusion, gives rise to an extracellular pH (pHe) of tumors that is undeniably acidic (211–214). Notably, the production of acid is not dependent on the EMP, as cells deficient in glucose-6-phosphate isomerase (which converts glucose-6-phosphate to fructose-6-phosphate) continue to produce acid, primarily glutamine-derived CO2, at a high rate (215–217).

Acidosis has long been viewed as a toxic consequence of increased glycolysis, but recently it has been proposed that it is selectively more toxic to normal parenchymal tissues compared with invading cancers. In many tumor types, acute or chronic treatment with low pH stimulates in vitro invasion and in vivo metastases. This has been shown most dramatically for melanoma cancer wherein lowering culture pH to 6.7 resulted in a significant increase in the incidence of in vivo metastases, after tail vein injection of treated cells (42). This acid treatment leads to increases in interleukin-8 (IL-8), vascular endothelial growth factor (VEGF), and matrix metalloproteinases 2 and 9, and inhibiting these factors reduced both in vitro invasion and in vivo metastasis (218). In breast cancer, acid treatment has been shown to induce release of matrix-degrading proteases, for example, cathepsins B and L (39,219).

Interest in measuring tumor pH has a long history, which was recently reviewed (220). Early measurements used microelectrode measurements in both human and experimental cancers, which showed that the extracellular pH (pHe) was acidic (211). Subsequently, radioactive weak acid tracers, such as 14CO2 and 14C-dimethyloxazolidinone (DMO), showed that the intracellular pH (pHi) of tumors was alkaline (221,222). 31P MRS studies agreed with tracer studies in showing that tumor pHi was neutral to alkaline (223,224). These observations were confirmed by the simultaneous measurement of pHi and pHe with an exogenous 31P-labeled pHe indicator, 3-aminopropylphosphonate (225). Subsequent measurements have shown unequivocally that the pHe of tumor xenografts is acidic, whereas the pHi is neutral to alkaline (226). Although 31P MRS can be spatially localized, the low gyromagnetic ratio limits voxel sizes to approximately 8 × 8 × 8 mm. Higher resolution can be obtained with other nuclei, such as 1H and 19F (227–230), which have been used to measure localized tumor pH using spectroscopic imaging (MRSI) with spatial resolution approaching 1 × 1 × 1 mm (228,231,232). Although these provided unparalleled resolution, drawbacks to these MRSI approaches include long acquisition times even at a high field (∼40 min at 4.7 T). In the early 2000s, pH-dependent T1 relaxometry was introduced, with the promise that it could generate pH maps with high spatiotemporal resolution. Several pH-dependent contrast reagents (CR) have been synthesized (233,234). An issue with these measurements is the need for simultaneous pixel-by-pixel correction for concentration (235). Nonetheless, methods have been developed to image pHe with imaging resolution using MRI relaxometry (236,237). An alternative method uses the rate of acid-catalyzed exchange of exogenous or endogenous amide hydrogens with bulk water to measure pH (238–240). This approach, chemical exchange saturation transfer (CEST), is relatively insensitive, requiring greater than 50 mM exchangeable amides. Although it has been made more sensitive using pH-sensitive paramagnetic lanthanide chelates (ParaCEST) (241–243), this approach still has a lack of sensitivity, requiring greater than a 10 mM contrast agent and, like pH-dependent relaxometry, also requiring knowledge of the CA concentration.

Lactate

It is also possible that lactate itself is a signal for increased survival, invasion, and metastasis. Lactate levels can be measured in human tumors by 1H magnetic resonance spectroscopy (MRS) (244). Such measures have shown that lactate levels are strong indicators of poor prognosis in brain, breast, lung, and liver cancers (245–248). Notably, lactate levels did not correlate with histopathologic stage of oligodendrogliomas, suggesting that this may not be a universal observation (249). As described previously, lactate can directly lead to the stabilization of HIF-1α (250). Lactate can also induce an increase in the expression of hyaluronan and hyaluronidase (CD44) in stromal fibroblasts and tumor cells, and these are important components of increased invasion and metastasis (251).

CONCLUSION

Imag(in)ing is the interplay between mathematically based teleologic models and empiric data. Empiric 18F-FDG PET data have emphasized the sheer preponderance of elevated glucose trapping in cancers, a phenomenon first described half a century ago. Teleology modeling has asked why this must be so and has come to the conclusion that elevated glucose consumption must be a necessary phenotype for the formation of metastatic cancers and therefore must be considered a hallmark of cancer. This is supported not only by the commonality of the observation but also by the multitude of molecular mechanisms that can give rise to this phenotype, a principle known as functional equivalence. In then asking “Why do cancers consume glucose?” 3 metabolic sequelae were considered: bioenergetics, PPP formation of NADPH and ribose, and production of acid. Although bioenergetic production of ATP is often cited as an important consequence of elevated glucose consumption, this is not supported by available empiric evidence. Although PPP is elevated in some cancers, this is not universally observed. Production of acid is an inevitable consequence of increased glucose consumption. Although mechanistic descriptions are not fully developed, increased acid production has been shown to correlate with and cause an increased capacity of cancer cells to invade host tissues. Thus, it is proposed that the phenotype of elevated glucose consumption in cancers is selected through somatic evolution because it leads to increased acid production.

Footnotes

  • COPYRIGHT © 2008 by the Society of Nuclear Medicine, Inc.

References

  1. 1.↵
    Weinhouse S. The Warburg hypothesis fifty years later. Z Krebsforsch Klin Onkol Cancer Res Clin Oncol. 1976;87:115–126.
    OpenUrlPubMed
  2. 2.↵
    Gatenby RA, Gawlinski ET. A reaction-diffusion model of cancer invasion. Cancer Res. 1996;56:5745–5753.
    OpenUrlAbstract/FREE Full Text
  3. 3.
    Gatenby RA. Population ecology issues in tumor growth. Cancer Res. 1991;51:2542–2547.
    OpenUrlAbstract/FREE Full Text
  4. 4.↵
    Gatenby RA, Gillies RJ. A microenvironmental model of carcinogenesis. Nat Rev Cancer. 2008. In press.
  5. 5.
    Gatenby RA, Frieden BR. Information theory in living systems, methods, applications, and challenges. Bull Math Biol. 2007;69:635–657.
    OpenUrlCrossRefPubMed
  6. 6.
    Smallbone K, Gavaghan DJ, Gatenby RA, Maini PK. The role of acidity in solid tumour growth and invasion. J Theor Biol. 2005;235:476–484.
    OpenUrlCrossRefPubMed
  7. 7.
    Gatenby RA, Vincent TL. An evolutionary model of carcinogenesis. Cancer Res. 2003;63:6212–6220.
    OpenUrlAbstract/FREE Full Text
  8. 8.
    Gatenby RA, Vincent TL. Application of quantitative models from population biology and evolutionary game theory to tumor therapeutic strategies. Mol Cancer Ther. 2003;2:919–927.
    OpenUrlAbstract/FREE Full Text
  9. 9.
    Gatenby RA, Frieden BR. Application of information theory and extreme physical information to carcinogenesis. Cancer Res. 2002;62:3675–3684.
    OpenUrlAbstract/FREE Full Text
  10. 10.
    Patel AA, Gawlinski ET, Lemieux SK, Gatenby RA. A cellular automaton model of early tumor growth and invasion. J Theor Biol. 2001;213:315–331.
    OpenUrlCrossRefPubMed
  11. 11.↵
    Gatenby RA, Gawlinski ET. Mathematical models of tumour invasion mediated by transformation-induced alteration of microenvironmental pH. Novartis Found Symp. 2001;240:85–96.
    OpenUrlPubMed
  12. 12.↵
    Gatenby RA. Application of competition theory to tumour growth: implications for tumour biology and treatment. Eur J Cancer. 1996;32A:722–726.
    OpenUrlCrossRef
  13. 13.↵
    Engbring JA, Kleinman HK. The basement membrane matrix in malignancy. J Pathol. 2003;200:465–470.
    OpenUrlCrossRefPubMed
  14. 14.↵
    Kalluri R, Neilson EG. Epithelial-mesenchymal transition and its implications for fibrosis. J Clin Invest. 2003;112:1776–1784.
    OpenUrlCrossRefPubMed
  15. 15.↵
    Yang J, Mani SA, Donaher JL, et al. Twist, a master regulator of morphogenesis, plays an essential role in tumor metastasis. Cell. 2004;117:927–939.
    OpenUrlCrossRefPubMed
  16. 16.↵
    Hanahan D, Weinberg RA. The hallmarks of cancer. Cell. 2000;100:57–70.
    OpenUrlCrossRefPubMed
  17. 17.↵
    Gatenby RA, Smallbone K, Maini PK, et al. Cellular adaptations to hypoxia and acidosis during somatic evolution of breast cancer. Br J Cancer. 2007;97:646–653.
    OpenUrlCrossRefPubMed
  18. 18.↵
    Melendez-Colon VJ, Luch A, Seidel A, Baird WM. Cancer initiation by polycyclic aromatic hydrocarbons results from formation of stable DNA adducts rather than apurinic sites. Carcinogenesis. 1999;20:1885–1891.
    OpenUrlAbstract/FREE Full Text
  19. 19.↵
    Oppermann H, Levinson AD, Varmus HE, Levintow L, Bishop JM. Uninfected vertebrate cells contain a protein that is closely related to the product of the avian sarcoma virus transforming gene (src). Proc Natl Acad Sci USA. 1979;76:1804–1808.
    OpenUrlAbstract/FREE Full Text
  20. 20.↵
    Hartwell LH, Weinert TA. Checkpoints: controls that ensure the order of cell cycle events. Science. 1989;243:629–634.
    OpenUrlAbstract/FREE Full Text
  21. 21.↵
    Vaziri H, Squire JA, Pandita TK, et al. Analysis of genomic integrity and p53-dependent G1 checkpoint in telomerase-induced extended-life-span human fibroblasts. Mol Cell Biol. 1999;19:2373–2379.
    OpenUrlAbstract/FREE Full Text
  22. 22.↵
    Pan H, Califano J, Ponte JF, et al. Loss of heterozygosity patterns provide fingerprints for genetic heterogeneity in multistep cancer progression of tobacco smoke-induced non-small cell lung cancer. Cancer Res. 2005;65:1664–1669.
    OpenUrlAbstract/FREE Full Text
  23. 23.↵
    Fearon ER, Vogelstein B. A genetic model for colorectal tumorigenesis. Cell. 1990;61:759–767.
    OpenUrlCrossRefPubMed
  24. 24.↵
    Li Z, Zhao J, Du Y, et al. Down-regulation of 14-3-3zeta suppresses anchorage-independent growth of lung cancer cells through anoikis activation. Proc Natl Acad Sci USA. 2008;105:162–167.
    OpenUrlAbstract/FREE Full Text
  25. 25.↵
    Frisch SM, Ruoslahti E. Integrins and anoikis. Curr Opin Cell Biol. 1997;9:701–706.
    OpenUrlCrossRefPubMed
  26. 26.↵
    Wykoff CC, Beasley N, Watson PH, et al. Expression of the hypoxia-inducible and tumor-associated carbonic anhydrases in ductal carcinoma in situ of the breast. Am J Pathol. 2001;158:1011–1019.
    OpenUrlCrossRefPubMed
  27. 27.↵
    Gatenby RA, Smallbone K, Maini PK, et al. Cellular adaptations to hypoxia and acidosis during somatic evolution of breast cancer. Br J Cancer. 2007;97:646–653.
    OpenUrlCrossRefPubMed
  28. 28.
    Park HJ, Lyons JC, Ohtsubo T, Song CW. Acidic environment causes apoptosis by increasing caspase activity. Br J Cancer. 1999;80:1892–1897.
    OpenUrlCrossRefPubMed
  29. 29.
    Williams AC, Collard TJ, Paraskeva C. An acidic environment leads to p53 dependent induction of apoptosis in human adenoma and carcinoma cell lines: implications for clonal selection during colorectal carcinogenesis. Oncogene. 1999;18:3199–3204.
    OpenUrlCrossRefPubMed
  30. 30.↵
    Semenza GL. Hypoxia, clonal selection, and the role of HIF-1 in tumor progression. Crit Rev Biochem Mol Biol. 2000;35:71–103.
    OpenUrlCrossRefPubMed
  31. 31.
    Kim CY, Tsai MH, Osmanian C, et al. Selection of human cervical epithelial cells that possess reduced apoptotic potential to low-oxygen conditions. Cancer Res. 1997;57:4200–4204.
    OpenUrlAbstract/FREE Full Text
  32. 32.↵
    Graeber TG, Osmanian C, Jacks T, et al. Hypoxia-mediated selection of cells with diminished apoptotic potential in solid tumours. Nature. 1996;379:88–91.
    OpenUrlCrossRefPubMed
  33. 33.↵
    Abbey CK, Borowsky AD, Gregg JP, Cardiff RD, Cherry SR. Preclinical imaging of mammary intraepithelial neoplasia with positron emission tomography. J Mammary Gland Biol Neoplasia. 2006;11:137–149.
    OpenUrlCrossRefPubMed
  34. 34.↵
    Schornack PA, Gillies RJ, Schornack PA, Gillies RJ. Contributions of cell metabolism and H+ diffusion to the acidic pH of tumors. Neoplasia (New York). 2003;5:135–145.
    OpenUrl
  35. 35.↵
    Gillies RJ, Schornack PA, Secomb TW, et al. Causes and effects of heterogeneous perfusion in tumors. Neoplasia (New York). 1999;1:197–207.
    OpenUrl
  36. 36.↵
    Smallbone K, Gavaghan DJ, Gatenby RA, Maini PK. The role of acidity in solid tumour growth and invasion. J Theor Biol. 2005;235:476–484.
    OpenUrlCrossRefPubMed
  37. 37.
    Bourguignon LY, Singleton PA, Diedrich F, Stern R, Gilad E. CD44 interaction with Na+-H+ exchanger (NHE1) creates acidic microenvironments leading to hyaluronidase-2 and cathepsin B activation and breast tumor cell invasion. J Biol Chem. 2004;279:26991–27007.
    OpenUrlAbstract/FREE Full Text
  38. 38.
    Madan AK, Yu K, Dhurandhar N, Cullinane C, Pang Y, Beech DJ. Association of hyaluronidase and breast adenocarcinoma invasiveness. Oncol Rep. 1999;6:607–609.
    OpenUrlPubMed
  39. 39.↵
    Rozhin J, Sameni M, Ziegler G, Sloane BF. Pericellular pH affects distribution and secretion of cathepsin B in malignant cells. Cancer Res. 1994;54:6517–6525.
    OpenUrlAbstract/FREE Full Text
  40. 40.
    Montcourrier P, Mangeat PH, Valembois C, et al. Characterization of very acidic phagosomes in breast cancer cells and their association with invasion. J Cell Sci. 1994;107:2381–2391.
    OpenUrlAbstract/FREE Full Text
  41. 41.
    Rofstad EK, Mathiesen B, Kindem K, Galappathi K. Acidic extracellular pH promotes experimental metastasis of human melanoma cells in athymic nude mice. Cancer Res. 2006;66:6699–6707.
    OpenUrlAbstract/FREE Full Text
  42. 42.↵
    Schlappack OK, Zimmermann A, Hill RP. Glucose starvation and acidosis: effect on experimental metastasic potential, DNA content and MTX resistance of murine tumour cells. Br J Cancer. 1991;64:663–670.
    OpenUrlCrossRefPubMed
  43. 43.↵
    Kalluri R, Neilson EG. Epithelial-mesenchymal transition and its implications for fibrosis. J Clin Invest. 2003;112:1776–1784.
    OpenUrlCrossRefPubMed
  44. 44.
    Kokkinos MI, Wafai R, Wong MK, Newgreen DF, Thompson EW, Waltham M. Vimentin and epithelial-mesenchymal transition in human breast cancer: observations in vitro and in vivo. Cells Tissues Organs. 2007;185:191–203.
    OpenUrlCrossRefPubMed
  45. 45.↵
    Larue L, Bellacosa A. Epithelial-mesenchymal transition in development and cancer: role of phosphatidylinositol 3′ kinase/AKT pathways. Oncogene. 2005;24:7443–7454.
    OpenUrlCrossRefPubMed
  46. 46.↵
    Bockhorn M, Jain RK, Munn LL. Active versus passive mechanisms in metastasis: do cancer cells crawl into vessels, or are they pushed? Lancet Oncol. 2007;8:444–448.
    OpenUrlCrossRefPubMed
  47. 47.↵
    Paget S. The distribution of secondary growths in cancer of the breast. Lancet. 1889;133:571–573.
    OpenUrlCrossRef
  48. 48.↵
    Hill RP, Perris R. “Destemming” cancer stem cells. J Natl Cancer Inst. 2007;99:1435–1440.
    OpenUrlAbstract/FREE Full Text
  49. 49.↵
    Weidner N, Semple JP, Welch WR, Folkman J. Tumor angiogenesis and metastasis: correlation in invasive breast carcinoma. N Engl J Med. 1991;324:1–8.
    OpenUrlCrossRefPubMed
  50. 50.↵
    Gatenby RA, Gawlinski ET, Gmitro AF, Kaylor B, Gillies RJ. Acid-mediated tumor invasion: a multidisciplinary study. Cancer Res. 2006;66:5216–5223.
    OpenUrlAbstract/FREE Full Text
  51. 51.↵
    Gambhir SS, Czernin J, Schwimmer J, Silverman DH, Coleman RE, Phelps ME. A tabulated summary of the FDG PET literature. J Nucl Med. 2001;42(5, suppl):1S–93S.
    OpenUrlFREE Full Text
  52. 52.↵
    Kelloff GJ, Hoffman JM, Johnson B, et al. Progress and promise of FDG-PET imaging for cancer patient management and oncologic drug development. Clin Cancer Res. 2005;11:2785–2808.
    OpenUrlAbstract/FREE Full Text
  53. 53.↵
    Kubota K. From tumor biology to clinical Pet: a review of positron emission tomography (PET) in oncology. Ann Nucl Med. 2001;15:471–486.
    OpenUrlCrossRefPubMed
  54. 54.↵
    Krebs HA. The Pasteur effect and the relations between respiration and fermentation. Essays Biochem. 1972;8:1–34.
    OpenUrlPubMed
  55. 55.↵
    Racker E, Wu R. Limiting factors in glycolysis of ascites tumour cells and the pasteur effect. Regulation of Cell Metabolism. 1958;205–229.
  56. 56.↵
    Wu R, Racker E. Regulatory mechanisms in carbohydrate metabolism. IV. Pasteur effect and crabtree effect in ascites tumor cells. J Biol Chem. 1959;234:1036–1041.
    OpenUrlFREE Full Text
  57. 57.↵
    Rajendran JG, Krohn KA. Imaging hypoxia and angiogenesis in tumors. Radiol Clin North Am. 2005;43:169–187.
    OpenUrlCrossRefPubMed
  58. 58.↵
    Cher LM, Murone C, Lawrentschuk N, et al. Correlation of hypoxic cell fraction and angiogenesis with glucose metabolic rate in gliomas using 18F-fluoromisonidazole, 18F-FDG PET, and immunohistochemical studies. J Nucl Med. 2006;47:410–418.
    OpenUrlAbstract/FREE Full Text
  59. 59.↵
    Warburg O. Über den Stoffwechsel der Tumoren. London, U.K.: Constable; 1930.
  60. 60.↵
    Hanahan D, Weinberg RA. The hallmarks of cancer. Cell. 2000;100:57–70.
    OpenUrlCrossRefPubMed
  61. 61.↵
    Kelloff GJ, Hoffman JM, Johnson B, et al. Progress and promise of FDG-PET imaging for cancer patient management and oncologic drug development. Clin Cancer Res. 2005;11:2785–2808.
    OpenUrlAbstract/FREE Full Text
  62. 62.↵
    Brizel DM, Schroeder T, Scher RL, et al. Elevated tumor lactate concentrations predict for an increased risk of metastases in head-and-neck cancer. Int J Radiat Oncol Biol Phys. 2001;51:349–353.
    OpenUrlPubMed
  63. 63.↵
    Walenta S, Wetterling M, Lehrke M, et al. High lactate levels predict likelihood of metastases, tumor recurrence, and restricted patient survival in human cervical cancers. Cancer Res. 2000;60:916–921.
    OpenUrlAbstract/FREE Full Text
  64. 64.↵
    Mikuriya K, Kuramitsu Y, Ryozawa S, et al. Expression of glycolytic enzymes is increased in pancreatic cancerous tissues as evidenced by proteomic profiling by two-dimensional electrophoresis and liquid chromatography-mass spectrometry/mass spectrometry. Int J Oncol. 2007;30:849–855.
    OpenUrlPubMed
  65. 65.↵
    Altenberg B, Greulich KO, Altenberg B, Greulich KO. Genes of glycolysis are ubiquitously overexpressed in 24 cancer classes. Genomics. 2004;84:1014–1020.
    OpenUrlCrossRefPubMed
  66. 66.↵
    Pauwels EK, Sturm EJ, Bombardieri E, Cleton FJ, Stokkel MP. Positron-emission tomography with [18F]fluorodeoxyglucose. Part I. Biochemical uptake mechanism and its implication for clinical studies. J Cancer Res Clin Oncol. 2000;126:549–559.
    OpenUrlCrossRefPubMed
  67. 67.↵
    Bos R, van Der Hoeven JJ, van der Wall E, et al. Biologic correlates of 18fluorodeoxyglucose uptake in human breast cancer measured by positron emission tomography. J Clin Oncol. 2002;20:379–387.
    OpenUrlAbstract/FREE Full Text
  68. 68.
    Zhao S, Kuge Y, Mochizuki T, et al. Biologic correlates of intratumoral heterogeneity in 18F-FDG distribution with regional expression of glucose transporters and hexokinase-II in experimental tumor. J Nucl Med. 2005;46:675–682.
    OpenUrlAbstract/FREE Full Text
  69. 69.↵
    Pedersen MW, Holm S, Lund EL, Hojgaard L, Kristjansen PE. Coregulation of glucose uptake and vascular endothelial growth factor (VEGF) in two small-cell lung cancer (SCLC) sublines in vivo and in vitro. Neoplasia. 2001;3:80–87.
    OpenUrlCrossRefPubMed
  70. 70.↵
    Rivenzon-Segal D, Boldin-Adamsky S, Seger D, Seger R, Degani H. Glycolysis and glucose transporter 1 as markers of response to hormonal therapy in breast cancer. Int J Cancer. 2003;107:177–182.
    OpenUrlCrossRefPubMed
  71. 71.↵
    Medina RA, Owen GI. Glucose transporters: expression, regulation and cancer. Biol Res. 2002;35:9–26.
    OpenUrlPubMed
  72. 72.↵
    Zhao S, Kuge Y, Mochizuki T, et al. Biologic correlates of intratumoral heterogeneity in 18F-FDG distribution with regional expression of glucose transporters and hexokinase-II in experimental tumor. J Nucl Med. 2005;46:675–682.
    OpenUrlAbstract/FREE Full Text
  73. 73.↵
    Hwang DY, Ismail-Beigi F. Control of Glut1 promoter activity under basal conditions and in response to hyperosmolarity: role of Sp1. Am J Physiol Cell Physiol. 2006;290:C337–C344.
    OpenUrlAbstract/FREE Full Text
  74. 74.↵
    Meneses AM, Medina RA, Kato S, et al. Regulation of GLUT3 and glucose uptake by the cAMP signalling pathway in the breast cancer cell line ZR-75. J Cell Physiol. 2008;214:110–116.
    OpenUrlCrossRefPubMed
  75. 75.↵
    Sebastian S, Kenkare UW. Insulin-like growth factor I induces tumor hexokinase RNA expression in cancer cells. Biochem Biophys Res Commun. 1997;235:389–393.
    OpenUrlCrossRefPubMed
  76. 76.↵
    Rempel A, Mathupala SP, Perdersen PL. Glucose catabolism in cancer cells: regulation of the Type II hexokinase promoter by glucose and cyclic AMP. FEBS Lett. 1996;385:233–237.
    OpenUrlCrossRefPubMed
  77. 77.↵
    Rho M, Kim J, Jee CD, et al. Expression of type 2 hexokinase and mitochondria-related genes in gastric carcinoma tissues and cell lines. Anticancer Res. 2007;27 (1A):251–258.
    OpenUrlAbstract/FREE Full Text
  78. 78.
    Mathupala SP, Rempel A, Pedersen PL. Glucose catabolism in cancer cells: identification and characterization of a marked activation response of the type II hexokinase gene to hypoxic conditions. J Biol Chem. 2001;276:43407–43412.
    OpenUrlAbstract/FREE Full Text
  79. 79.↵
    Katabi MM, Chan HL, Karp SE, Batist G. Hexokinase type II: a novel tumor-specific promoter for gene-targeted therapy differentially expressed and regulated in human cancer cells. Hum Gene Ther. 1999;10:155–164.
    OpenUrlCrossRefPubMed
  80. 80.↵
    Shinohara Y. Identification and characterization of hexokinase isozyme predominantly expressed in malignant tumor cells. Yakugaku Zasshi. 2000;120:657–666.
    OpenUrlPubMed
  81. 81.↵
    Penso J, Beitner R. Clotrimazole and bifonazole detach hexokinase from mitochondria of melanoma cells. Eur J Pharmacol. 1998;342:113–117.
    OpenUrlCrossRefPubMed
  82. 82.↵
    Le Mellay V, Troppmair J, Benz R, Rapp UR. Negative regulation of mitochondrial VDAC channels by C-Raf kinase. BMC Cell Biol. 2002;3:14.
    OpenUrlCrossRefPubMed
  83. 83.↵
    Kroemer G. Mitochondria in cancer. Oncogene. 2006;25:4630–4632.
    OpenUrlCrossRefPubMed
  84. 84.↵
    Warburg O. On the origin of cancer cells. Science. 1956;123:309–314.
    OpenUrlFREE Full Text
  85. 85.↵
    Lopez-Rios F, Sanchez-Arago M, Garcia-Garcia E, et al. Loss of the mitochondrial bioenergetic capacity underlies the glucose avidity of carcinomas. Cancer Res. 2007;67:9013–9017.
    OpenUrlAbstract/FREE Full Text
  86. 86.↵
    Hervouet E, Godinot C. Mitochondrial disorders in renal tumors. Mitochondrion. 2006;6:105–117.
    OpenUrlCrossRefPubMed
  87. 87.↵
    Bi X, Lin Q, Foo TW, et al. Proteomic analysis of colorectal cancer reveals alterations in metabolic pathways: mechanism of tumorigenesis. Mol Cell Proteomics. 2006;5:1119–1130.
    OpenUrlAbstract/FREE Full Text
  88. 88.
    Mazzanti R, Solazzo M, Fantappie O, et al. Differential expression proteomics of human colon cancer. Am J Physiol Gastrointest Liver Physiol. 2006;290:G1329–G1338.
    OpenUrlAbstract/FREE Full Text
  89. 89.↵
    Lu B, Xu J, Lai M, Zhang H, Chen J. A transcriptome anatomy of human colorectal cancers. BMC Cancer. 2006;6:40.
    OpenUrlCrossRefPubMed
  90. 90.↵
    Isidoro A, Casado E, Redondo A, et al. Breast carcinomas fulfill the Warburg hypothesis and provide metabolic markers of cancer prognosis. Carcinogenesis. 2005;26:2095–2104.
    OpenUrlAbstract/FREE Full Text
  91. 91.↵
    Amuthan G, Biswas G, Ananadatheerthavarada HK, Vijayasarathy C, Shephard HM, Avadhani NG. Mitochondrial stress-induced calcium signaling, phenotypic changes and invasive behavior in human lung carcinoma A549 cells. Oncogene. 2002;21:7839–7849.
    OpenUrlCrossRefPubMed
  92. 92.↵
    Zhou S, Kachhap S, Sun W, et al. Frequency and phenotypic implications of mitochondrial DNA mutations in human squamous cell cancers of the head and neck. Proc Natl Acad Sci USA. 2007;104:7540–7545.
    OpenUrlAbstract/FREE Full Text
  93. 92a.↵
    Christofk HR, Vander Heiden MG, Wu N, et al. Pyruvate kinase M2 is a phosphotyrosine-binding protein. Nature. 2008;452:181–188.
    OpenUrlCrossRefPubMed
  94. 92b.↵
    Christofk HR, Vander Heiden MG, Harris MH, et al. The m2 splice isoform of pyruvate kinase is important for cancer metabolism and tumour growth. Nature. 2008;452:230–234.
    OpenUrlCrossRefPubMed
  95. 93.↵
    Bonnet S, Archer SL, Lalunis-Turner J, et al. A mitochondria-K+ channel axis is suppressed in cancer and its normalization promotes apoptosis and inhibits cancer growth. Cancer Cell. 2007;11:37–51.
    OpenUrlCrossRefPubMed
  96. 94.↵
    Kim JW, Tchernyshyov I, Semenza GL, Dang CV. HIF-1-mediated expression of pyruvate dehydrogenase kinase: a metabolic switch required for cellular adaptation to hypoxia. Cell Metab. 2006;3:177–185.
    OpenUrlCrossRefPubMed
  97. 95.↵
    Lu H, Forbes RA, Verma A. Hypoxia-inducible factor 1 activation by aerobic glycolysis implicates the Warburg effect in carcinogenesis. J Biol Chem. 2002;277:23111–23115.
    OpenUrlAbstract/FREE Full Text
  98. 96.↵
    Wu M, Neilson A, Swift AL, et al. Multiparameter metabolic analysis reveals a close link between attenuated mitochondrial bioenergetic function and enhanced glycolysis dependency in human tumor cells. Am J Physiol Cell Physiol. 2007;292:C125–C136.
    OpenUrlAbstract/FREE Full Text
  99. 97.↵
    Arad M, Seidman CE, Seidman JG. AMP-activated protein kinase in the heart: role during health and disease. Circ Res. 2007;100:474–488.
    OpenUrlAbstract/FREE Full Text
  100. 98.↵
    Carling D. AMP-activated protein kinase: balancing the scales. Biochimie. 2005;87:87–91.
    OpenUrlPubMed
  101. 99.↵
    Zhang H, Gao P, Fukuda R, et al. HIF-1 inhibits mitochondrial biogenesis and cellular respiration in VHL-deficient renal cell carcinoma by repression of C-MYC activity. Cancer Cell. 2007;11:407–420.
    OpenUrlCrossRefPubMed
  102. 100.↵
    Deng Y, Wu X. Peg3/Pw1 promotes p53-mediated apoptosis by inducing Bax translocation from cytosol to mitochondria. Proc Natl Acad Sci USA. 2000;97:12050–12055.
    OpenUrlAbstract/FREE Full Text
  103. 101.↵
    Kroemer G. Mitochondria in cancer. Oncogene. 2006;25:4630–4632.
    OpenUrlCrossRefPubMed
  104. 102.↵
    Wang GL, Semenza GL. Molecular basis of hypoxia-induced erythropoietin expression. Curr Opin Hematol. 1996;3:156–162.
    OpenUrlCrossRefPubMed
  105. 103.↵
    Maxwell PH, Wiesener MS, Chang GW, et al. The tumour suppressor protein VHL targets hypoxia-inducible factors for oxygen-dependent proteolysis. Nature. 1999;399:271–275.
    OpenUrlCrossRefPubMed
  106. 104.↵
    Lee K, Roth RA, Lapres JJ. Hypoxia, drug therapy and toxicity. Pharmacol Ther. 2007;113:229–246.
    OpenUrlCrossRefPubMed
  107. 105.
    Brahimi-Horn MC, Pouyssegur J. The hypoxia-inducible factor and tumor progression along the angiogenic pathway. Int Rev Cytol. 2005;242:157–213.
    OpenUrlPubMed
  108. 106.
    Brahimi-Horn MC, Pouyssegur J. Harnessing the hypoxia-inducible factor in cancer and ischemic disease. Biochem Pharmacol. 2007;73:450–457.
    OpenUrlCrossRefPubMed
  109. 107.
    Lopez-Lazaro M. HIF-1: hypoxia-inducible factor or dysoxia-inducible factor? FASEB J. 2006;20:828–832.
    OpenUrlAbstract/FREE Full Text
  110. 108.
    Bardos JI, Ashcroft M. Negative and positive regulation of HIF-1: a complex network. Biochim Biophys Acta. 2005;1755:107–120.
    OpenUrlPubMed
  111. 109.
    Wang F, Li SS, Segersvard R, et al. Hypoxia inducible factor-1 mediates effects of insulin on pancreatic cancer cells and disturbs host energy homeostasis. Am J Pathol. 2007;170:469–477.
    OpenUrlCrossRefPubMed
  112. 110.
    Zhang D, Tai LK, Wong LL, Chiu LL, Sethi SK, Koay ES. Proteomic study reveals that proteins involved in metabolic and detoxification pathways are highly expressed in HER-2/neu-positive breast cancer. Mol Cell Proteomics. 2005;4:1686–1696.
    OpenUrlAbstract/FREE Full Text
  113. 111.
    Kasuno K, Takabuchi S, Fukuda K, et al. Nitric oxide induces hypoxia-inducible factor 1 activation that is dependent on MAPK and phosphatidylinositol 3-kinase signaling. J Biol Chem. 2004;279:2550–2558.
    OpenUrlAbstract/FREE Full Text
  114. 112.
    Semenza G. Signal transduction to hypoxia-inducible factor 1. Biochem Pharmacol. 2002;64:993–998.
    OpenUrlCrossRefPubMed
  115. 113.↵
    Semenza G. Targeting HIF-1 for cancer therapy. Nat Rev Cancer. 2003;3:1–13.
    OpenUrlPubMed
  116. 114.↵
    Olbryt M, Jarzab M, Jazowiecka-Rakus J, Simek K, Szala S, Sochanik A. Gene expression profile of B 16(F10) murine melanoma cells exposed to hypoxic conditions in vitro. Gene Expr. 2006;13:191–203.
    OpenUrlCrossRefPubMed
  117. 115.↵
    Swietach P, Vaughan-Jones RD, Harris AL. Regulation of tumor pH and the role of carbonic anhydrase 9. Cancer Metastasis Rev. 2007;26:299–310.
    OpenUrlCrossRefPubMed
  118. 116.↵
    Talks KL, Turley H, Gatter KC, et al. The expression and distribution of the hypoxia-inducible factors HIF-1alpha and HIF-2alpha in normal human tissues, cancers, and tumor-associated macrophages. Am J Pathol. 2000;157:411–421.
    OpenUrlCrossRefPubMed
  119. 117.↵
    Bos R, van der Groep P, Greijer AE, et al. Levels of hypoxia-inducible factor-1alpha independently predict prognosis in patients with lymph node negative breast carcinoma. Cancer. 2003;97:1573–1581.
    OpenUrlCrossRefPubMed
  120. 118.↵
    Seagroves T, Ryan HE, Lu H, et al. Transcription factor HIF-1 is a necessary mediator of the Pasteur effect in mammalian cells. Mol Cell Biol. 2001;21:3436–3444.
    OpenUrlAbstract/FREE Full Text
  121. 119.↵
    Robey IF, Lien AD, Welsh SJ, Baggett BK, Gillies RJ. Hypoxia-inducible factor-1alpha and the glycolytic phenotype in tumors. Neoplasia. 2005;7:324–330.
    OpenUrlCrossRefPubMed
  122. 120.↵
    Travali S, Koniecki J, Petralia S, Baserga R. Oncogenes in growth and development. FASEB J. 1990;4:3209–3214.
    OpenUrlAbstract/FREE Full Text
  123. 121.↵
    Dang CV, Semenza GL. Oncogenic alterations of metabolism. Trends Biochem Sci. 1999;24:68–72.
    OpenUrlCrossRefPubMed
  124. 122.↵
    Osthus RC, Shim H, Kim S, et al. Deregulation of glucose transporter 1 and glycolytic gene expression by c-Myc. J Biol Chem. 2000;275:21797–21800.
    OpenUrlAbstract/FREE Full Text
  125. 123.↵
    Shim H, Chun YS, Lewis BC, Dang CV. A unique glucose-dependent apoptotic pathway induced by c-Myc. Proc Natl Acad Sci USA. 1998;95:1511–1516.
    OpenUrlAbstract/FREE Full Text
  126. 124.↵
    Shim H, Dolde C, Lewis BC, et al. c-Myc transactivation of LDH-A: implications for tumor metabolism and growth. Proc Natl Acad Sci USA. 1997;94:6658–6663.
    OpenUrlAbstract/FREE Full Text
  127. 125.↵
    Papas KK, Sun L, Roos ES, Gounarides JS, Shapiro M, Nalin CM. Change in lactate production in Myc-transformed cells precedes apoptosis and can be inhibited by Bcl-2 overexpression. FEBS Lett. 1999;446:338–342.
    OpenUrlCrossRefPubMed
  128. 126.↵
    Koshiji M, Kageyama Y, Pete EA, Horikawa I, Barrett JC, Huang LE. HIF-1alpha induces cell cycle arrest by functionally counteracting Myc. EMBO J. 2004;23:1949–1956.
    OpenUrlAbstract/FREE Full Text
  129. 127.↵
    Zhang H, Gao P, Fukuda R, et al. HIF-1 inhibits mitochondrial biogenesis and cellular respiration in VHL-deficient renal cell carcinoma by repression of C-MYC activity. Cancer Cell. 2007;11:407–420.
    OpenUrlCrossRefPubMed
  130. 128.↵
    Kim JW, Gao P, Liu YC, Semenza GL, Dang CV. Hypoxia-inducible factor 1 and dysregulated c-Myc cooperatively induce vascular endothelial growth factor and metabolic switches hexokinase 2 and pyruvate dehydrogenase kinase 1. Mol Cell Biol. 2007;27:7381–7393.
    OpenUrlAbstract/FREE Full Text
  131. 129.↵
    Datta SR, Brunet A, Greenberg ME. Cellular survival: a play in three Akts. Genes Dev. 1999;13:2905–2927.
    OpenUrlFREE Full Text
  132. 130.↵
    Vivanco I, Sawyers CL. The phosphatidylinositol 3-kinase AKT pathway in human cancer. Nat Rev Cancer. 2002;2:489–501.
    OpenUrlCrossRefPubMed
  133. 131.↵
    Gao N, Zhang Z, Jiang BH, Shi X. Role of PI3K/AKT/mTOR signaling in the cell cycle progression of human prostate cancer. Biochem Biophys Res Commun. 2003;310:1124–1132.
    OpenUrlCrossRefPubMed
  134. 132.↵
    Osaki M, Oshimura M, Ito H. PI3K-Akt pathway: its functions and alterations in human cancer. Apoptosis. 2004;9:667–676.
    OpenUrlCrossRefPubMed
  135. 133.↵
    Osaki M, Oshimura M, Ito H. PI3K-Akt pathway: its functions and alterations in human cancer. Apoptosis. 2004;9:667–676.
    OpenUrlCrossRefPubMed
  136. 134.↵
    Ihle NT, Williams R, Chow S, et al. Molecular pharmacology and antitumor activity of PX-866, a novel inhibitor of phosphoinositide-3-kinase signaling. Mol Cancer Ther. 2004;3:763–772.
    OpenUrlAbstract/FREE Full Text
  137. 135.↵
    Coffer PJ, Jin J, Woodgett JR. Protein kinase B (c-Akt): a multifunctional mediator of phosphatidylinositol 3-kinase activation. Biochem J. 1998;335:1–13.
    OpenUrlAbstract/FREE Full Text
  138. 136.↵
    Bose S, Chandran S, Mirocha JM, Bose N. The Akt pathway in human breast cancer: a tissue-array-based analysis. Mod Pathol. 2006;19:238–245.
    OpenUrlCrossRefPubMed
  139. 137.↵
    Lin HJ, Hsieh FC, Song H, Lin J. Elevated phosphorylation and activation of PDK-1/AKT pathway in human breast cancer. Br J Cancer. 2005;93:1372–1381.
    OpenUrlCrossRefPubMed
  140. 138.↵
    Elstrom RL, Bauer DE, Buzzai M, et al. Akt stimulates aerobic glycolysis in cancer cells. Cancer Res. 2004;64:3892–3899.
    OpenUrlAbstract/FREE Full Text
  141. 139.↵
    She QB, Solit DB, Ye Q, O'Reilly KE, Lobo J, Rosen N. The BAD protein integrates survival signaling by EGFR/MAPK and PI3K/Akt kinase pathways in PTEN-deficient tumor cells. Cancer Cell. 2005;8:287–297.
    OpenUrlCrossRefPubMed
  142. 140.↵
    Thompson JE, Thompson CB. Putting the rap on Akt. J Clin Oncol. 2004;22:4217–4226.
    OpenUrlAbstract/FREE Full Text
  143. 141.↵
    Buzzai M, Bauer DE, Jones RG, et al. The glucose dependence of Akt-transformed cells can be reversed by pharmacologic activation of fatty acid beta-oxidation. Oncogene. 2005;24:4165–4173.
    OpenUrlCrossRefPubMed
  144. 142.↵
    Levine AJ, Momand J, Finlay CA. The p53 tumour suppressor gene. Nature. 1991;351:453–456.
    OpenUrlCrossRefPubMed
  145. 143.↵
    Zambetti GP, Levine AJ. A comparison of the biological activities of wild-type and mutant p53. FASEB J. 1993;7:855–865.
    OpenUrlAbstract
  146. 144.↵
    Ullrich SJ, Anderson CW, Mercer WE, Appella E. The p53 tumor suppressor protein, a modulator of cell proliferation. J Biol Chem. 1992;267:15259–15262.
    OpenUrlFREE Full Text
  147. 145.↵
    Vaziri H, Squire JA, Pandita TK, et al. Analysis of genomic integrity and p53-dependent G1 checkpoint in telomerase-induced extended-life-span human fibroblasts. Mol Cell Biol. 1999;19:2373–2379.
    OpenUrlAbstract/FREE Full Text
  148. 146.↵
    Bensaad K, Vousden KH. p53: new roles in metabolism. Trends Cell Biol. 2007;17:286–291.
    OpenUrlCrossRefPubMed
  149. 147.↵
    Gu S, Liu Z, Pan S, et al. Global investigation of p53-induced apoptosis through quantitative proteomic profiling using comparative amino acid-coded tagging. Mol Cell Proteomics. 2004;3:998–1008.
    OpenUrlAbstract/FREE Full Text
  150. 148.↵
    Schwartzenberg-Bar-Yoseph F, Armoni M, Karnieli E. The tumor suppressor p53 down-regulates glucose transporters GLUT1 and GLUT4 gene expression. Cancer Res. 2004;64:2627–2633.
    OpenUrlAbstract/FREE Full Text
  151. 149.↵
    Matoba S, Kang JG, Patino WD, et al. p53 regulates mitochondrial respiration. Science. 2006;312:1650–1653.
    OpenUrlAbstract/FREE Full Text
  152. 150.↵
    Bensaad K, Tsuruta A, Selak MA, et al. TIGAR, a p53-inducible regulator of glycolysis and apoptosis. Cell. 2006;126:107–120.
    OpenUrlCrossRefPubMed
  153. 151.↵
    Hamilton JA, Callaghan MJ, Sutherland RL, Watts CK. Identification of PRG1, a novel progestin-responsive gene with sequence homology to 6-phosphofructo-2-kinase/fructose-2,6-bisphosphatase. Mol Endocrinol. 1997;11:490–502.
    OpenUrlCrossRefPubMed
  154. 152.↵
    Chesney J. 6-phosphofructo-2-kinase/fructose-2,6-bisphosphatase and tumor cell glycolysis. Curr Opin Clin Nutr Metab Care. 2006;9:535–539.
    OpenUrlCrossRefPubMed
  155. 153.↵
    Fukasawa M, Tsuchiya T, Takayama E, et al. Identification and characterization of the hypoxia-responsive element of the human placental 6-phosphofructo-2-kinase/fructose-2,6-bisphosphatase gene. J Biochem (Tokyo). 2004;136:273–277.
    OpenUrlAbstract/FREE Full Text
  156. 154.↵
    Atsumi T, Chesney J, Metz C, et al. High expression of inducible 6-phosphofructo-2-kinase/fructose-2,6-bisphosphatase (iPFK-2; PFKFB3) in human cancers. Cancer Res. 2002;62:5881–5887.
    OpenUrlAbstract/FREE Full Text
  157. 155.↵
    Bando H, Atsumi T, Nishio T, et al. Phosphorylation of the 6-phosphofructo-2-kinase/fructose 2,6-bisphosphatase/PFKFB3 family of glycolytic regulators in human cancer. Clin Cancer Res. 2005;11:5784–5792.
    OpenUrlAbstract/FREE Full Text
  158. 156.↵
    Chesney J, Mitchell R, Benigni F, et al. An inducible gene product for 6-phosphofructo-2-kinase with an AU-rich instability element: role in tumor cell glycolysis and the Warburg effect. Proc Natl Acad Sci USA. 1999;96:3047–3052.
    OpenUrlAbstract/FREE Full Text
  159. 157.↵
    Lowy DR, Willumsen BM. Function and regulation of ras. Annu Rev Biochem. 1993;62:851–891.
    OpenUrlCrossRefPubMed
  160. 158.↵
    Bos JL. ras oncogenes in human cancer: a review. Cancer Res. 1989;49:4682–4689.
    OpenUrlAbstract/FREE Full Text
  161. 159.↵
    Downward J. Targeting RAS signalling pathways in cancer therapy. Nat Rev Cancer. 2003;3:11–22.
    OpenUrlCrossRefPubMed
  162. 160.↵
    Yordy JS, Muise-Helmericks RC. Signal transduction and the Ets family of transcription factors. Oncogene. 2000;19:6503–6513.
    OpenUrlCrossRefPubMed
  163. 161.↵
    Pacold ME, Suire S, Perisic O, et al. Crystal structure and functional analysis of Ras binding to its effector phosphoinositide 3-kinase gamma. Cell. 2000;103:931–943.
    OpenUrlCrossRefPubMed
  164. 162.↵
    Rodriguez-Viciana P, Warne PH, Dhand R, et al. Phosphatidylinositol-3-OH kinase as a direct target of Ras. Nature. 1994;370:527–532.
    OpenUrlCrossRefPubMed
  165. 163.↵
    Datta SR, Brunet A, Greenberg ME. Cellular survival: a play in three Akts. Genes Dev. 1999;13:2905–2927.
    OpenUrlFREE Full Text
  166. 164.↵
    Blum R, Nakdimon I, Goldberg L, et al. E2F1 identified by promoter and biochemical analysis as a central target of glioblastoma cell-cycle arrest in response to Ras inhibition. Int J Cancer. 2006;119:527–538.
    OpenUrlCrossRefPubMed
  167. 165.↵
    Mazurek S, Zwerschke W, Jansen-Durr P, Eigenbrodt E. Metabolic cooperation between different oncogenes during cell transformation: interaction between activated ras and HPV-16 E7. Oncogene. 2001;20:6891–6898.
    OpenUrlCrossRefPubMed
  168. 166.
    Ramanathan A, Wang C, Schreiber SL. Perturbational profiling of a cell-line model of tumorigenesis by using metabolic measurements. Proc Natl Acad Sci USA. 2005;102:5992–5997.
    OpenUrlAbstract/FREE Full Text
  169. 167.↵
    Vizan P, Boros LG, Figueras A, et al. K-ras codon-specific mutations produce distinctive metabolic phenotypes in NIH3T3 mice [corrected] fibroblasts. Cancer Res. 2005;65:5512–5515.
    OpenUrlAbstract/FREE Full Text
  170. 168.↵
    Lazo JS, Sebti SM. Bleomycin. Cancer Chemother Biol Response Modif. 1997;17:40–45.
    OpenUrlPubMed
  171. 169.↵
    Guha A, Feldkamp MM, Lau N, Boss G, Pawson A. Proliferation of human malignant astrocytomas is dependent on Ras activation. Oncogene. 1997;15:2755–2765.
    OpenUrlCrossRefPubMed
  172. 170.↵
    Blum R, Jacob-Hirsch J, Amariglio N, Rechavi G, Kloog Y. Ras inhibition in glioblastoma down-regulates hypoxia-inducible factor-1alpha, causing glycolysis shutdown and cell death. Cancer Res. 2005;65:999–1006.
    OpenUrlAbstract/FREE Full Text
  173. 171.↵
    Kole HK, Resnick RJ, Van Doren M, Racker E. Regulation of 6-phosphofructo-1-kinase activity in ras-transformed rat-1 fibroblasts. Arch Biochem Biophys. 1991;286:586–590.
    OpenUrlCrossRefPubMed
  174. 172.
    Racker E, Resnick RJ, Feldman R. Glycolysis and methylaminoisobutyrate uptake in rat-1 cells transfected with ras or myc oncogenes. Proc Natl Acad Sci USA. 1985;82:3535–3538.
    OpenUrlAbstract/FREE Full Text
  175. 173.↵
    Telang S, Yalcin A, Clem AL, et al. Ras transformation requires metabolic control by 6-phosphofructo-2-kinase. Oncogene. 2006;25:7225–7234.
    OpenUrlCrossRefPubMed
  176. 174.↵
    Eigenbrodt E, Reinacher M, Scheefers-Borchel U, Scheefers H, Friis R. Double role for pyruvate kinase type M2 in the expansion of phosphometabolite pools found in tumor cells. Crit Rev Oncog. 1992;3:91–115.
    OpenUrlPubMed
  177. 175.↵
    Mazurek S, Boschek CB, Eigenbrodt E. The role of phosphometabolites in cell proliferation, energy metabolism, and tumor therapy. J Bioenerg Biomembr. 1997;29:315–330.
    OpenUrlCrossRefPubMed
  178. 176.↵
    Mazurek S, Michel A, Eigenbrodt E. Effect of extracellular AMP on cell proliferation and metabolism of breast cancer cell lines with high and low glycolytic rates. J Biol Chem. 1997;272:4941–4952.
    OpenUrlAbstract/FREE Full Text
  179. 177.↵
    Khalique L, Ayhan A, Weale ME, Jacobs IJ, Ramus SJ, Gayther SA. Genetic intra-tumour heterogeneity in epithelial ovarian cancer and its implications for molecular diagnosis of tumours. J Pathol. 2007;211:286–295.
    OpenUrlCrossRefPubMed
  180. 178.
    Benetkiewicz M, Piotrowski A, Diaz De Ståhl T, et al. Chromosome 22 array-CGH profiling of breast cancer delimited minimal common regions of genomic imbalances and revealed frequent intra-tumoral genetic heterogeneity. Int J Oncol. 2006;29:935–945.
    OpenUrlPubMed
  181. 179.
    Pan H, Califano J, Ponte JF, et al. Loss of heterozygosity patterns provide fingerprints for genetic heterogeneity in multistep cancer progression of tobacco smoke-induced non-small cell lung cancer. Cancer Res. 2005;65:1664–1669.
    OpenUrlAbstract/FREE Full Text
  182. 180.↵
    Losi L, Baisse B, Bouzourene H, Benhattar J. Evolution of intratumoral genetic heterogeneity during colorectal cancer progression. Carcinogenesis. 2005;26:916–922.
    OpenUrlAbstract/FREE Full Text
  183. 181.↵
    Gatenby RA, Gillies RJ. Why do cancers have high aerobic glycolysis? Nat Rev Cancer. 2004;4:891–899.
    OpenUrlCrossRefPubMed
  184. 182.↵
    Gillies RJ, Gatenby RA. Adaptive landscapes and emergent phenotypes: why do cancers have high glycolysis? J Bioenerg Biomembr. 2007;39:251–257.
    OpenUrlCrossRefPubMed
  185. 183.
    Gatenby RA, Gillies RJ. Glycolysis in cancer: a potential target for therapy. Int J Biochem Cell Biol. 2007;39:1358–1366.
    OpenUrlCrossRefPubMed
  186. 184.↵
    Gillies RJ, Gatenby RA. Hypoxia and adaptive landscapes in the evolution of carcinogenesis. Cancer Metastasis Rev. 2007;26:311–317.
    OpenUrlCrossRefPubMed
  187. 185.↵
    Zu X, Guppy M. Cancer metabolism: facts, fantasy, and fiction. Biochem Biophys Res Commun. 2008;313:459–465.
    OpenUrl
  188. 186.↵
    Guppy M, Leedman P, Zu X, Russell V. Contribution by different fuels and metabolic pathways to the total ATP turnover of proliferating MCF-7 breast cancer cells. Biochem J. 2002;364:309–315.
    OpenUrlCrossRefPubMed
  189. 187.↵
    Moreno-Sanchez R, Rodriguez-Enriquez S, Marin-Hernandez A, Saavedra E. Energy metabolism in tumor cells. FEBS J. 2007;274:1393–1418.
    OpenUrlCrossRefPubMed
  190. 188.↵
    Griffiths JR, McIntyre DJ, Howe FA, Stubbs M. Why are cancers acidic? A carrier-mediated diffusion model for H+ transport in the interstitial fluid. Novartis Found Symp. 2001;240:46–62.
    OpenUrlPubMed
  191. 189.↵
    Helmlinger G, Sckell A, Dellian M, Forbes NS, Jain RK. Acid production in glycolysis-impaired tumors provides new insights into tumor metabolism. Clin Cancer Res. 2002;8:1284–1291.
    OpenUrlAbstract/FREE Full Text
  192. 190.
    Forbes NS, Meadows AL, Clark DS, Blanch HW. Estradiol stimulates the biosynthetic pathways of breast cancer cells: detection by metabolic flux analysis. Metab Eng. 2006;8:639–652.
    OpenUrlCrossRefPubMed
  193. 191.
    Selivanov VA, Meshalkina LE, Solovjeva ON, et al. Rapid simulation and analysis of isotopomer distributions using constraints based on enzyme mechanisms: an example from HT29 cancer cells. Bioinformatics. 2005;21:3558–3564.
    OpenUrlAbstract/FREE Full Text
  194. 192.
    Ramos-Montoya A, Lee WN, Bassilian S, et al. Pentose phosphate cycle oxidative and nonoxidative balance: a new vulnerable target for overcoming drug resistance in cancer. Int J Cancer. 2006;119:2733–2741.
    OpenUrlCrossRefPubMed
  195. 193.
    Kumar A, Pundir CS, Sharma S, Sharma A. Dehydrogenases of pentose phosphate pathway and cervical carcinogenesis. Indian J Exp Biol. 1993;31:569–570.
    OpenUrlPubMed
  196. 194.↵
    Chen EI, Hewel J, Krueger JS, et al. Adaptation of energy metabolism in breast cancer brain metastases. Cancer Res. 2007;67:1472–1486.
    OpenUrlAbstract/FREE Full Text
  197. 195.↵
    Boros LG, Lee PW, Brandes JL, et al. Nonoxidative pentose phosphate pathways and their direct role in ribose synthesis in tumors: is cancer a disease of cellular glucose metabolism? Med Hypotheses. 1998;50:55–59.
    OpenUrlCrossRefPubMed
  198. 196.↵
    Hochachka PW, Rupert JL, Goldenberg L, Gleave M, Kozlowski P. Going malignant: the hypoxia-cancer connection in the prostate. Bioessays. 2002;24:749–757.
    OpenUrlCrossRefPubMed
  199. 197.↵
    Ramos-Montoya A, Lee WN, Bassilian S, et al. Pentose phosphate cycle oxidative and nonoxidative balance: a new vulnerable target for overcoming drug resistance in cancer. Int J Cancer. 2006;119:2733–2741.
    OpenUrlCrossRefPubMed
  200. 198.↵
    Kuhajda FP, Jenner K, Wood FD, et al. Fatty acid synthesis: a potential selective target for antineoplastic therapy. Proc Natl Acad Sci USA. 1994;91:6379–6383.
    OpenUrlAbstract/FREE Full Text
  201. 199.↵
    Knowles LM, Smith JW. Genome-wide changes accompanying knockdown of fatty acid synthase in breast cancer. BMC Genomics. 2007;8:168.
    OpenUrlCrossRefPubMed
  202. 200.↵
    Hochachka PW, Rupert JL, Goldenberg L, Gleave M, Kozlowski P. Going malignant: the hypoxia-cancer connection in the prostate. Bioessays. 2002;24:749–757.
    OpenUrlCrossRefPubMed
  203. 201.↵
    Kumar A, Pundir CS, Sharma S, Sharma A. Dehydrogenases of pentose phosphate pathway and cervical carcinogenesis. Indian J Exp Biol. 1993;31:569–570.
    OpenUrlPubMed
  204. 202.↵
    Langbein S, Zerilli M, Zur HA, et al. Expression of transketolase TKTL1 predicts colon and urothelial cancer patient survival: Warburg effect reinterpreted. Br J Cancer. 2006;94:578–585.
    OpenUrlCrossRefPubMed
  205. 203.↵
    Swietach P, Vaughan-Jones RD, Harris AL. Regulation of tumor pH and the role of carbonic anhydrase 9. Cancer Metastasis Rev. 2007;26:299–310.
    OpenUrlCrossRefPubMed
  206. 204.
    Svastova E, Hulikova A, Rafajova M, et al. Hypoxia activates the capacity of tumor-associated carbonic anhydrase IX to acidify extracellular pH. FEBS Lett. 2004;577:439–445.
    OpenUrlCrossRefPubMed
  207. 205.↵
    Trastour C, Benizri E, Ettore F, et al. HIF-1alpha and CA IX staining in invasive breast carcinomas: prognosis and treatment outcome. Int J Cancer. 2007;120:1451–1458.
    OpenUrlCrossRefPubMed
  208. 206.↵
    Garcia-Martin ML, Herigault G, Remy C, et al. Mapping extracellular pH in rat brain gliomas in vivo by 1H magnetic resonance spectroscopic imaging: comparison with maps of metabolites. Cancer Res. 2001;61:6524–6531.
    OpenUrlAbstract/FREE Full Text
  209. 207.↵
    Ullah MS, Davies AJ, Halestrap AP. The plasma membrane lactate transporter MCT4, but not MCT1, is up-regulated by hypoxia through a HIF-1alpha-dependent mechanism. J Biol Chem. 2006;281:9030–9037.
    OpenUrlAbstract/FREE Full Text
  210. 208.↵
    Pouyssegur J, Franchi A, Pages G. pHi, aerobic glycolysis and vascular endothelial growth factor in tumour growth. Novartis Found Symp. 2001;240:186–196.
    OpenUrlCrossRefPubMed
  211. 209.↵
    Raghunand N, Martinez-Zaguilan R, Wright SH, Gillies RJ. pH and drug resistance. II. Turnover of acidic vesicles and resistance to weakly basic chemotherapeutic drugs. Biochem Pharmacol. 1999;57:1047–1058.
    OpenUrlCrossRefPubMed
  212. 210.↵
    Martinez-Zaguilan R, Lynch RM, Martinez GM, Gillies RJ. Vacuolar type proton ATPases are functionally expressed in the plasma membranes of human tumor cells. Am J Physiol. 1993;265:c1015–c1029.
    OpenUrlPubMed
  213. 211.↵
    Wike-Hooley JL, Haveman J, Reinhold HS. The relevance of tumour pH to the treatment of malignant disease. Radiother Oncol. 1984;2:343–366.
    OpenUrlCrossRefPubMed
  214. 212.
    Tannock IF, Rotin D. Acid pH in tumors and its potential for therapeutic exploitation. Cancer Res. 1989;49:4373–4384.
    OpenUrlAbstract/FREE Full Text
  215. 213.
    Gillies RJ, Raghunand N, Karczmar GS, Bhujwalla ZM. MRI of the tumor microenvironment. J Magn Reson Imaging. 2002;16:430–450.
    OpenUrlCrossRefPubMed
  216. 214.↵
    Helmlinger G, Yuan F, Jain MD, Jain R. Interstitial pH and pO2 gradients in solid tumors in vivo: high-resolution measurements reveal a lack of correlation. Nature. 1997;3:177–182.
    OpenUrlCrossRef
  217. 215.↵
    Newell K, Franchi A, Pouyssegur J, Tannock I. Studies with glycolysis-deficient cells suggest that production of lactic acid is not the only cause of tumor acidity. Proc Natl Acad Sci USA. 1993;90:1127–1131.
    OpenUrlAbstract/FREE Full Text
  218. 216.
    Helmlinger G, Sckell A, Dellian M, Forbes NS, Jain RK. Acid production in glycolysis-impaired tumors provides new insights into tumor metabolism. Clin Cancer Res. 2002;8:1284–1291.
    OpenUrlAbstract/FREE Full Text
  219. 217.↵
    Ullrey DB, Franchi A, Pouyssegur J, Kalckar HM. Down-regulation of the hexose transport system: metabolic basis studied with a fibroblast mutant lacking phosphoglucose isomerase. Proc Natl Acad Sci USA. 1982;79:3777–3779.
    OpenUrlAbstract/FREE Full Text
  220. 218.↵
    Rofstad EK, Mathiesen B, Kindem K, Galappathi K. Acidic extracellular pH promotes experimental metastasis of human melanoma cells in athymic nude mice. Cancer Res. 2006;66:6699–6707.
    OpenUrlAbstract/FREE Full Text
  221. 219.↵
    Rochefort H, Garcia M, Glondu M, et al. Cathepsin D in breast cancer: mechanisms and clinical applications, a 1999 overview. Clin Chim Acta. 2000;291:157–170.
    OpenUrlCrossRefPubMed
  222. 220.↵
    Gillies RJ, Raghunand N, Garcia-Martin ML, Gatenby RA. pH imaging: a review of pH measurement methods and applications in cancers. IEEE Eng Med Biol Mag. 2004;23:57–64.
    OpenUrlPubMed
  223. 221.↵
    Waddell WJ, Bates RG. Intracellular pH. Physiol Rev. 1969;49:286–329.
    OpenUrl
  224. 222.↵
    Waddell WJ, Butler TC. Calculation of intracellular pH from the distribution of 5,5-dimethyl-2,4-oxazolidinedione (DMO): application to skeletal muscle of the dog. J Clin Invest. 1959;38:720–729.
    OpenUrlCrossRefPubMed
  225. 223.↵
    Griffiths JR, Stevens AN, Iles RA, Godron RE, Shaws D. 31P-NMR investigation of solid tumours in the living rat. Biosci Rep. 1981;1:319–325.
    OpenUrlFREE Full Text
  226. 224.↵
    Griffiths JR. Are cancer cells acidic? Br J Cancer. 1991;64:425–427.
    OpenUrlCrossRefPubMed
  227. 225.↵
    Gillies RJ, Liu Z, Bhujwalla Z. 31P-MRS measurements of extracellular pH of tumors using 3-aminopropylphosphonate. Am J Physiol. 1994;267:C195–C203.
    OpenUrlPubMed
  228. 226.↵
    Gillies RJ, Raghunand N, Karczmar GS, Bhujwalla ZM. MRI of the tumor microenvironment. J Magn Reson Imaging. 2002;16:430–450.
    OpenUrlCrossRefPubMed
  229. 227.↵
    Gil S, Zaderenzo P, Cruz F, Cerdan S, Ballesteros P. Imidazol-1-ylalkanoic acids as extrinsic 1H NMR probes for the determination of intracellular pH, extracellular pH and cell volume. Bioorg Med Chem Lett. 1994;2:305–314.
    OpenUrlCrossRef
  230. 228.↵
    Bhujwalla ZM, Artemov D, Ballesteros P, Cerdan S, Gillies RJ, Solaiyappan M. Combined vascular and extracellular pH imaging of solid tumors. NMR Biomed. 2002;15:114–119.
    OpenUrlCrossRefPubMed
  231. 229.
    Ojugo AS, McSheehy PM, McIntyre DJ, et al. Measurement of the extracellular pH of solid tumours in mice by magnetic resonance spectroscopy: a comparison of exogenous 19F and 31P probes. NMR Biomed. 1999;12:495–504.
    OpenUrlCrossRefPubMed
  232. 230.↵
    Mason RP. Transmembrane pH gradients in vivo: measurements using fluorinated vitamin B6 derivatives. Curr Med Chem. 1999;6:481–499.
    OpenUrlPubMed
  233. 231.↵
    van Sluis R, Bhujwalla ZM, Raghunand N, et al. In vivo imaging of extracellular pH using 1H MRSI. Magn Reson Med. 1999;41:743–750.
    OpenUrlCrossRefPubMed
  234. 232.↵
    Garcia-Martin ML, Martinez GV, Raghunand N, Sherry AD, Zhang S, Gillies RJ. High resolution pH(e) imaging of rat glioma using pH-dependent relaxivity. Magn Reson Med. 2006;55:309–315.
    OpenUrlCrossRefPubMed
  235. 233.↵
    Zhang S, Wu K, Sherry AD. A novel pH-sensitive MRI contrast agent. Angewandte Chemie. 1999;38:3192–3194.
    OpenUrlCrossRefPubMed
  236. 234.↵
    Aime S, Delli CD, Terreno E. Novel pH-reporter MRI contrast agents. Angew Chem Int Ed Engl. 2002;41:4334–4336.
    OpenUrlCrossRef
  237. 235.↵
    Aime S, Fedeli F, Sanino A, Terreno EA. R2/R1 ratiometric procedure for a concentration-independent, pH-responsive, Gd(III)-based MRI agent. J Am Chem Soc. 2006;128:11326–11327.
    OpenUrlCrossRefPubMed
  238. 236.↵
    Garcia-Martin ML, Martinez GV, Raghunand N, Sherry AD, Zhang S, Gillies RJ. High resolution pH(e) imaging of rat glioma using pH-dependent relaxivity. Magn Reson Med. 2006;55:309–315.
    OpenUrlCrossRefPubMed
  239. 237.↵
    Raghunand N, Howison C, Sherry AD, Zhang S, Gillies RJ. Renal and systemic pH imaging by contrast-enhanced MRI. Magn Reson Med. 2003;49:249–257.
    OpenUrlCrossRefPubMed
  240. 238.↵
    Ward KM, Balaban RS. Determination of pH using water protons and chemical exchange dependent saturation transfer (CEST). Magn Reson Med. 2000;44:799–802.
    OpenUrlCrossRefPubMed
  241. 239.
    Ward KM, Aletras AH, Balaban RS. A new class of contrast agents for MRI based on proton chemical exchange dependent saturation transfer (CEST). J Magn Reson. 2000;143:79–87.
    OpenUrlCrossRefPubMed
  242. 240.↵
    Zhou J, Payen JF, Wilson DA, Traystman RJ, van Zijl PC. Using the amide proton signals of intracellular proteins and peptides to detect pH effects in MRI. Nat Med. 2003;9:1085–1090.
    OpenUrlCrossRefPubMed
  243. 241.↵
    Aime S, Barge A, Delli CD, et al. Paramagnetic lanthanide(III) complexes as pH-sensitive chemical exchange saturation transfer (CEST) contrast agents for MRI applications. Magn Reson Med. 2002;47:639–648.
    OpenUrlCrossRefPubMed
  244. 242.
    Woods M, Woessner DE, Sherry AD. Paramagnetic lanthanide complexes as PARACEST agents for medical imaging. Chem Soc Rev. 2006;35:500–511.
    OpenUrlCrossRefPubMed
  245. 243.↵
    Cai S, Seu C, Kovacs Z, Sherry AD, Chen Y. Sensitivity enhancement of multidimensional NMR experiments by paramagnetic relaxation effects. J Am Chem Soc. 2006;128:13474–13478.
    OpenUrlCrossRefPubMed
  246. 244.↵
    Serrai H, Senhadji L, Wang G, Akoka S, Stroman P. Lactate doublet quantification and lipid signal suppression using a new biexponential decay filter: application to simulated and 1H MRS brain tumor time-domain data. Magn Reson Med. 2003;50:623–626.
    OpenUrlCrossRefPubMed
  247. 245.↵
    Yokota H, Guo J, Matoba M, et al. Lactate, choline, and creatine levels measured by vitro 1H-MRS as prognostic parameters in patients with non-small-cell lung cancer. J Magn Reson Imaging. 2007;25:992–999.
    OpenUrlCrossRefPubMed
  248. 246.
    Yang Y, Li C, Nie X, et al. Metabonomic studies of human hepatocellular carcinoma using high-resolution magic-angle spinning 1H NMR spectroscopy in conjunction with multivariate data analysis. J Proteome Res. 2007;6:2605–2614.
    OpenUrlCrossRefPubMed
  249. 247.
    Sharma U, Mehta A, Seenu V, Jagannathan NR. Biochemical characterization of metastatic lymph nodes of breast cancer patients by in vitro 1H magnetic resonance spectroscopy: a pilot study. Magn Reson Imaging. 2004;22:697–706.
    OpenUrlCrossRefPubMed
  250. 248.↵
    Czernicki Z, Horsztyski D, Jankowski W, et al. Malignancy of brain tumors evaluated by proton magnetic resonance spectroscopy (1H-MRS) in vitro. Acta Neurochir Suppl. 2000;76:17–20.
    OpenUrlPubMed
  251. 249.↵
    Jenkinson MD, Smith TS, Joyce K, et al. MRS of oligodendroglial tumors: correlation with histopathology and genetic subtypes. Neurology. 2005;64:2085–2089.
    OpenUrlAbstract/FREE Full Text
  252. 250.↵
    Lu H, Forbes RA, Verma A. Hypoxia-inducible factor 1 activation by aerobic glycolysis implicates the Warburg effect in carcinogenesis. J Biol Chem. 2002;277:23111–23115.
    OpenUrlAbstract/FREE Full Text
  253. 251.↵
    Stern R, Shuster S, Neudecker BA, Formby B. Lactate stimulates fibroblast expression of hyaluronan and CD44: the Warburg effect revisited. Exp Cell Res. 2002;276:24–31.
    OpenUrlCrossRefPubMed
  254. 252.↵
    Abe K, Sasaki M, Kuwabara Y, et al. Comparison of 18FDG-PET with 99mTc-HMDP scintigraphy for the detection of bone metastases in patients with breast cancer. Ann Nucl Med. 2005;19:573–579.
    OpenUrlCrossRefPubMed
  255. 253.↵
    Adler LP, Faulhaber PF, Schnur KC, et al. Axillary lymph node metastases: screening with [F-18]2-deoxy-2-fluoro-D-glucose (FDG) PET. Radiology. 1997;203:323–327.
    OpenUrlPubMed
  256. 254.↵
    Avril N, Dose J, Janicke F, et al. Assessment of axillary lymph node involvement in breast cancer patients with positron emission tomography using radiolabeled 2-(fluorine-18)-fluoro-2-deoxy-D-glucose. J Natl Cancer Inst. 1996;88:1204–1209.
    OpenUrlAbstract/FREE Full Text
  257. 255.↵
    Amit A, Beck D, Lowenstein L, et al. The role of hybrid PET/CT in the evaluation of patients with cervical cancer. Gynecol Oncol. 2006;100:65–69.
    OpenUrlCrossRefPubMed
  258. 256.↵
    Arulampalam T, Costa D, Visvikis D, et al. The impact of FDG-PET on the management algorithm for recurrent colorectal cancer. Eur J Nucl Med. 2001;28:1758–1765.
    OpenUrlCrossRefPubMed
  259. 257.↵
    Arulampalam TH, Francis DL, Visvikis D, et al. FDG-PET for the pre-operative evaluation of colorectal liver metastases. Eur J Surg Oncol. 2004;30:286–291.
    OpenUrlCrossRefPubMed
  260. 258.↵
    Chen LB, Tong JL, Song HZ, Zhu H, Wang YC. 18F-DG PET/CT in detection of recurrence and metastasis of colorectal cancer. World J Gastroenterol. 2007;13:5025–5029.
    OpenUrlPubMed
  261. 259.↵
    Abdel-Nabi H, Doerr RJ, Lamonica DM, et al. Staging of primary colorectal carcinomas with fluorine-18 fluorodeoxyglucose whole-body PET: correlation with histopathologic and CT findings. Radiology. 1998;206:755–760.
    OpenUrlPubMed
  262. 260.↵
    Adams S, Baum RP, Stuckensen T, et al. Prospective comparison of 18F-FDG PET with conventional imaging modalities (CT, MRI, US) in lymph node staging of head and neck cancer. Eur J Nucl Med. 1998;25:1255–1260.
    OpenUrlCrossRefPubMed
  263. 261.↵
    Akcali C, Zincirkeser S, Erbagcy Z, et al. Detection of metastases in patients with cutaneous melanoma using FDG-PET/CT. J Int Med Res. 2007;35:547–553.
    OpenUrlAbstract/FREE Full Text
  264. 262.↵
    Chang JT, Chan SC, Yen TC, et al. Nasopharyngeal carcinoma staging by 18F-fluorodeoxyglucose positron emission tomography. Int J Radiat Oncol Biol Phys. 2005;62:501–507.
    OpenUrlCrossRefPubMed
  265. 263.↵
    Brink I, Schumacher T, Mix M, et al. Impact of [18F]FDG-PET on the primary staging of small-cell lung cancer. Eur J Nucl Med Mol Imaging. 2004;31:1614–1620.
    OpenUrlCrossRefPubMed
  266. 264.↵
    Brink I, Schumacher T, Mix M, et al. Impact of [18F]FDG-PET on the primary staging of small-cell lung cancer. Eur J Nucl Med Mol Imaging. 2004;31:1614–1620.
    OpenUrlCrossRefPubMed
  267. 265.↵
    Bury T, Barreto A, Daenen F, et al. Fluorine-18 deoxyglucose positron emission tomography for the detection of bone metastases in patients with non-small cell lung cancer. Eur J Nucl Med. 1998;25:1244–1247.
    OpenUrlCrossRefPubMed
  268. 266.↵
    Castellucci P, Perrone AM, Picchio M, et al. Diagnostic accuracy of 18F-FDG PET/CT in characterizing ovarian lesions and staging ovarian cancer: correlation with transvaginal ultrasonography, computed tomography, and histology. Nucl Med Commun. 2007;28:589–595.
    OpenUrlCrossRefPubMed
  269. 267.↵
    Chang CH, Wu HC, Tsai JJ, et al. Detecting metastatic pelvic lymph nodes by 18F-2-deoxyglucose positron emission tomography in patients with prostate-specific antigen relapse after treatment for localized prostate cancer. Urol Int. 2003;70:311–315.
    OpenUrlCrossRefPubMed
  270. 268.↵
    Cermik TF, Mavi A, Acikgoz G, et al. FDG PET in detecting primary and recurrent malignant salivary gland tumors. Clin Nucl Med. 2007;32:286–291.
    OpenUrlCrossRefPubMed
  271. 269.↵
    Aide N, Cappele O, Bottet P, et al. Efficiency of [18F]FDG PET in characterising renal cancer and detecting distant metastases: a comparison with CT. Eur J Nucl Med Mol Imaging. 2003;30:1236–1245.
    OpenUrlCrossRefPubMed
  272. 270.↵
    Chang CH, Shiau YC, Shen YY, et al. Differentiating solitary pulmonary metastases in patients with renal cell carcinomas by 18F-fluoro-2-deoxyglucose positron emission tomography: a preliminary report. Urol Int. 2003;71:306–309.
    OpenUrlCrossRefPubMed
  273. 271.↵
    Chen J, Cheong JH, Yun MJ, et al. Improvement in preoperative staging of gastric adenocarcinoma with positron emission tomography. Cancer. 2005;103:2383–2390.
    OpenUrlCrossRefPubMed
  274. 272.↵
    Choi JY, Lee KH, Shim YM, et al. Improved detection of individual nodal involvement in squamous cell carcinoma of the esophagus by FDG PET. J Nucl Med. 2000;41:808–815.
    OpenUrlAbstract/FREE Full Text
  • Received for publication January 30, 2008.
  • Accepted for publication March 19, 2008.
PreviousNext
Back to top

In this issue

Journal of Nuclear Medicine: 49 (Suppl 2)
Journal of Nuclear Medicine
Vol. 49, Issue Suppl 2
June 2008
  • Table of Contents
  • Table of Contents (PDF)
  • About the Cover
  • Index by author
Print
Download PDF
Article Alerts
Sign In to Email Alerts with your Email Address
Email Article

Thank you for your interest in spreading the word on Journal of Nuclear Medicine.

NOTE: We only request your email address so that the person you are recommending the page to knows that you wanted them to see it, and that it is not junk mail. We do not capture any email address.

Enter multiple addresses on separate lines or separate them with commas.
Causes and Consequences of Increased Glucose Metabolism of Cancers
(Your Name) has sent you a message from Journal of Nuclear Medicine
(Your Name) thought you would like to see the Journal of Nuclear Medicine web site.
Citation Tools
Causes and Consequences of Increased Glucose Metabolism of Cancers
Robert J. Gillies, Ian Robey, Robert A. Gatenby
Journal of Nuclear Medicine Jun 2008, 49 (Suppl 2) 24S-42S; DOI: 10.2967/jnumed.107.047258

Citation Manager Formats

  • BibTeX
  • Bookends
  • EasyBib
  • EndNote (tagged)
  • EndNote 8 (xml)
  • Medlars
  • Mendeley
  • Papers
  • RefWorks Tagged
  • Ref Manager
  • RIS
  • Zotero
Share
Causes and Consequences of Increased Glucose Metabolism of Cancers
Robert J. Gillies, Ian Robey, Robert A. Gatenby
Journal of Nuclear Medicine Jun 2008, 49 (Suppl 2) 24S-42S; DOI: 10.2967/jnumed.107.047258
Twitter logo Facebook logo LinkedIn logo Mendeley logo
  • Tweet Widget
  • Facebook Like
  • Google Plus One
Bookmark this article

Jump to section

  • Article
    • Abstract
    • CARCINOGENESIS AND MICROENVIRONMENT
    • 18F-FDG PET OF AEROBIC GLYCOLYSIS IN METASTASES
    • MOLECULAR MECHANISMS REGULATING GLUCOSE UPTAKE
    • CONSEQUENCES OF INCREASED GLUCOSE UPTAKE
    • CONCLUSION
    • Footnotes
    • References
  • Figures & Data
  • Info & Metrics
  • PDF

Related Articles

  • No related articles found.
  • PubMed
  • Google Scholar

Cited By...

  • The harsh microenvironment in early breast cancer selects for a Warburg phenotype
  • Water as a reactant in the differential expression of proteins in cancer
  • The Harsh Microenvironment in Early Breast Cancer Selects for a Warburg Phenotype
  • Targeting tumor phenotypic plasticity and metabolic remodeling in adaptive cross-drug tolerance
  • Collagen Production and Niche Engineering: A Novel Strategy for Cancer Cells to Survive Acidosis and Evolve
  • The Utility of PET/CT in the Planning of External Radiation Therapy for Prostate Cancer
  • RhoC GTPase Is a Potent Regulator of Glutamine Metabolism and N-Acetylaspartate Production in Inflammatory Breast Cancer Cells
  • Expanding the Scope of Fluorine Tags for PET Imaging
  • High glucose and insulin differentially modulates proliferation in MCF-7 and MDA-MB-231 cells
  • Quantitative Proteomic Analysis in Metastatic Renal Cell Carcinoma Reveals a Unique Set of Proteins with Potential Prognostic Significance
  • Tumor Aggressiveness and Patient Outcome in Cancer of the Pancreas Assessed by Dynamic 18F-FDG PET/CT
  • Targeting Hypoxia, HIF-1, and Tumor Glucose Metabolism to Improve Radiotherapy Efficacy
  • Chronic Autophagy Is a Cellular Adaptation to Tumor Acidic pH Microenvironments
  • Relationship between 18F-Fluorodeoxyglucose Accumulation and KRAS/BRAF Mutations in Colorectal Cancer
  • Preparation and Characterization of L-[5-11C]-Glutamine for Metabolic Imaging of Tumors
  • PET Imaging of Glutaminolysis in Tumors by 18F-(2S,4R)4-Fluoroglutamine
  • Multimodal Imaging with 18F-FDG PET and Cerenkov Luminescence Imaging After MLN4924 Treatment in a Human Lymphoma Xenograft Model
  • Overcoming Trastuzumab Resistance in Breast Cancer by Targeting Dysregulated Glucose Metabolism
  • Google Scholar

More in this TOC Section

  • Noninvasive Imaging of Cell-Mediated Therapy for Treatment of Cancer
  • Introduction
Show more Molecular Imaging of Cancer: From Molecules to Humans

Similar Articles

SNMMI

© 2025 SNMMI

Powered by HighWire