


Abstract
242093
Introduction: Planning for Y90 transarterial radioembolization (TARE) procedures require 3D region drawing capabilities to demonstrate adequate planning of desired treatment volumes. Typically, only Medical Internal Radiation Dose (MIRD) or body surface area (BSA) methodologies are applied to estimate the dose to be infused during a Y90-Therasphere procedure. Both of these methods have significant limitations in that they assume activity distributions are uniform throughout the volume and BSA models can lead to undertreatment due to artificial limitations on injected doses to 3 GBq. Recently, software platforms have been developed for planning and dosimetry calculation, however, these targeted software tools only work for y90 radioembolization procedures which can limit their applicability to other modalities.
The Torch software platform is a new radionuclide therapy dosimetry program that enables full treatment assessment of patients undergoing internal radionuclide therapy procedures. This tool has recently seen the addition of new region drawing tools that potentially enable this software to be additionally used as a Y90 TARE planning and dosimetry platform. This study assesses a patient workflow using the Torch platform for complete planning and dosimetry of Y90 radioembolization studies.
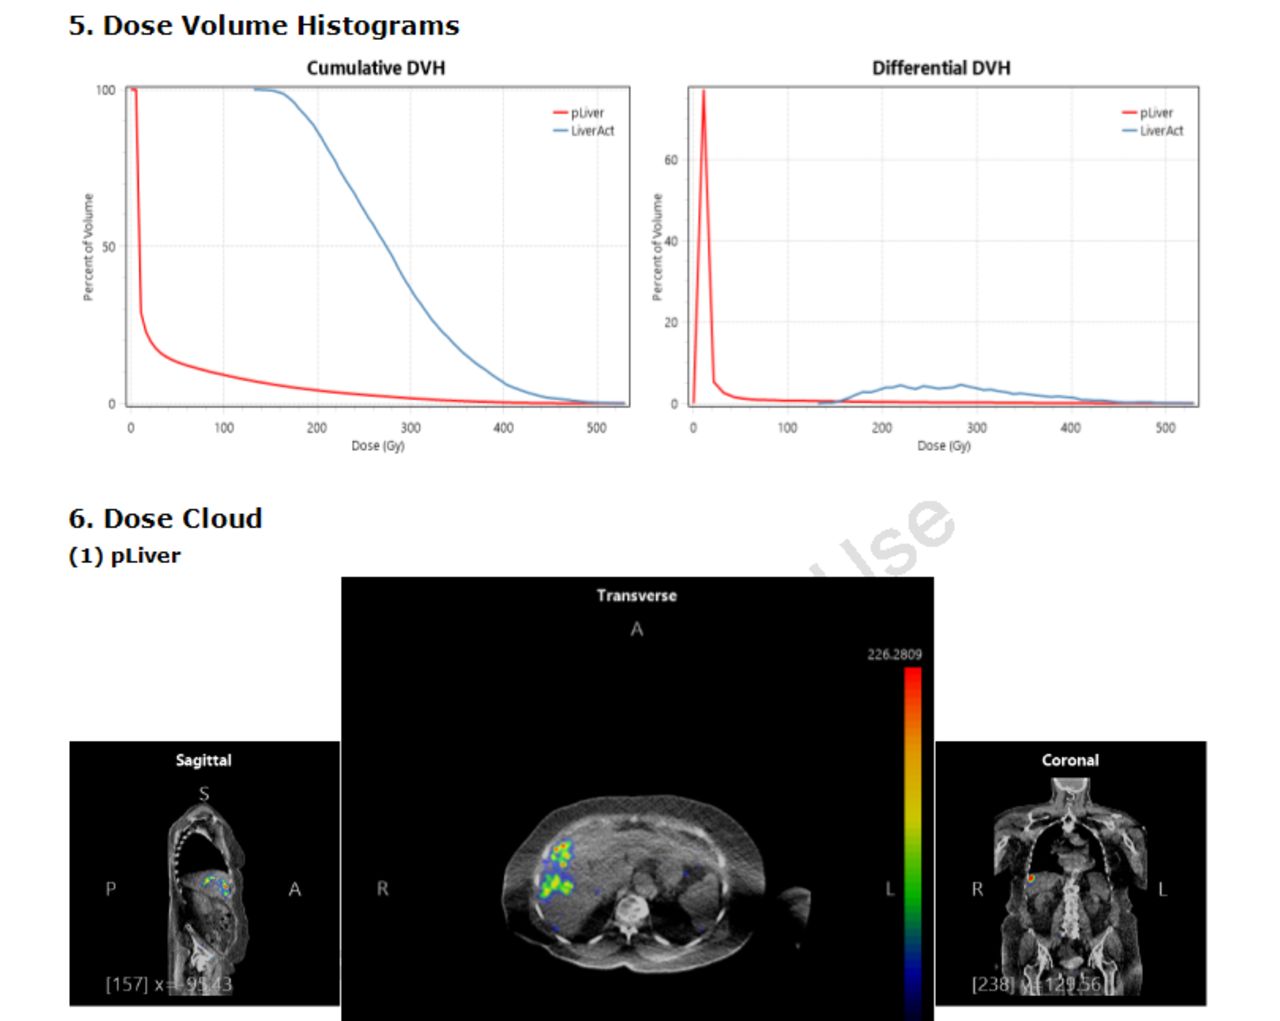
Methods: A new patient was created in the Torch database and a new assessment created for Y90 pre-TARE mapping angiogram. Cone beam CT images were imported and a volumetric region of interest defined for the perfused volume (Fig. 1A). DICOM structures (RTSTRUCT) were exported from the torch software for future use in 3D dosimetry (Fig. 1B). Once TARE Y90 therapy had been completed, PET/CT imaging was performed and a new assessment created in Torch for that patient to perform full 3D dosimetry calculations. The mapping cone-beam CT and PET/CT data were registered and the RTSTRUCT file from the mapping study imported for use in dose calculations in the perfused volume and entire liver. The standard Torch workflow was followed from that point forward with ROIs used to generate time integrated activity and for monte carlo simulation of absorbed dose (Fig. 1C & D). A final dose report and dose volumes were created using the patient injected dose to provide complete dose volume histograms and 3D dose cloud data (Fig. 2).
Results: The complete planning and 3D dosimetry workflows were performed completely within the Torch software environment. Cone beam CT images were compatible with the Torch software and manual registration was easily able to align anatomical volumes. Region drawing tools were as effective as our currently used software in delineating regions for treatment volumes and the provided 3D rendering and volumetric information provides sufficient information for use in our treatment plans that are sent to staff for ordering of patient doses.
Post-therapy PET/CT is easily loaded into the software and requires little manipulation to register volumes and ROIs for subsequent time activity curve (TAC) analysis. Analytical models used physical decay of the implanted microspheres to calculated cumulated activity and final activity reported matches anticipated doses to the area of interest as calculated by MIRD methods. Addiitonal information was obtained compared to our standard methods as dose volume histograms enable assessment of volumetric dose distribution within identified regions.
Conclusions: The Torch platform is a viable solution for complete TAREY90 planning and 3D dosimetry. Use of 3D dosimetry software in clinical practice can provide additional information about the inhomogeneous distribution of absorbed dose for a given patient. This enhanced analysis can provide clinicians with additional information about the potential effectiveness of the therapy performed and whether microsphere distribution will be sufficient to achieve the desired therapeutic effect.


In this issue


Jump to section
Related Articles
Cited By...
- No citing articles found.