


Visual Abstract

Abstract
The results of the GA in Newly Diagnosed Diffuse Large B-Cell Lymphoma (GAINED) study demonstrated the success of an 18F-FDG PET–driven approach to allow early identification—for intensification therapy—of diffuse large B-cell lymphoma patients with a high risk of relapse. Besides, some works have reported the prognostic value of baseline PET radiomics features (RFs). This work investigated the added value of such biomarkers on survival of patients involved in the GAINED protocol. Methods: Conventional PET features and RFs were computed from 18F-FDG PET at baseline and extracted using different volume definitions (patient level, largest lesion, and hottest lesion). Clinical features and the consolidation treatment information were also considered in the model. Two machine-learning pipelines were trained with 80% of patients and tested on the remaining 20%. The training was repeated 100 times to highlight the test set variability. For the 2-y progression-free survival (PFS) outcome, the pipeline included a data augmentation and an elastic net logistic regression model. Results for different feature groups were compared using the mean area under the curve (AUC). For the survival outcome, the pipeline included a Cox univariate model to select the features. Then, the model included a split between high- and low-risk patients using the median of a regression score based on the coefficients of a penalized Cox multivariate approach. The log-rank test P values over the 100 loops were compared with a Wilcoxon signed-ranked test. Results: In total, 545 patients were included for the 2-y PFS classification and 561 for survival analysis. Clinical features alone, consolidation features alone, conventional PET features, and RFs extracted at patient level achieved an AUC of, respectively, 0.65 ± 0.07, 0.64 ± 0.06, 0.60 ± 0.07, and 0.62 ± 0.07 (0.62 ± 0.07 for the largest lesion and 0.54 ± 0.07 for the hottest). Combining clinical features with the consolidation features led to the best AUC (0.72 ± 0.06). Adding conventional PET features or RFs did not improve the results. For survival, the log-rank P values of the model involving clinical and consolidation features together were significantly smaller than all combined-feature groups (P < 0.007). Conclusion: The results showed that a concatenation of multimodal features coupled with a simple machine-learning model does not seem to improve the results in terms of 2-y PFS classification and PFS prediction for patient treated according to the GAINED protocol.
The use of PET with 18F-FDG is now considered the standard imaging procedure not only for staging but also for therapeutic response assessment of patients with diffuse large B-cell lymphoma (DLBCL) (1). Yet, the number of patients who do not respond after standard front-line therapy—that is, a combination of anti-CD20 monoclonal antibody with cyclophosphamide, doxorubicin, vincristine, and prednisone chemotherapy—is still significant (30%–40%) (2) and advocates for the use of new biomarkers to determine patients with a high risk of relapse. In that respect, approaches based on interim PET to identify these patients and to adapt consolidation strategies accordingly have been explored for over 10 y (3). Several studies also evaluated the potential benefit of using imaging biomarkers extracted from PET volumes (4) in combination (or not) with other clinical or demographic features at baseline. Most of the studies focused primarily on assessment of the SUV extracted from the most intense lesion (SUVmax), the total metabolic tumor volume (TMTV), and dissemination. Although the role of SUVmax at baseline to predict 2-y progression-free survival (PFS) or overall survival was shown to be limited (4), TMTV (5) and dissemination (6) appeared to be promising at baseline (7).
Another area related to the high-throughput extraction of quantitative data from medical images has gained importance by considering the measurement of the spatial heterogeneity within a tumor (hereafter called radiomics) (8). Evaluation of the predictive values of these other potential image-based biomarkers in DLBCL patients has recently been considered (9–17). However, the usefulness of complex radiomics in this context remains controversial, as some studies reported a potential added value (9–11,14–17) whereas others concluded that there is a lack of, or only a moderate, predictive value for 2-y PFS when these biomarkers are considered alone or combined (12,13). These contradictory results may be explained partly by the prospective or retrospective nature of each study, the population size and type, the presence (or not) of a test dataset, the monocentric or multicentric characteristic of the study, the heterogeneity in immunochemotherapy regimen and patient management, and the features considered in the model.
The GA in Newly Diagnosed Diffuse Large B-Cell Lymphoma (GAINED) randomized phase III trial was the first study demonstrating the success of a PET-driven strategy. Interim PET interpretation criteria were simple and based on SUVmax reduction (ΔSUVmax) (18). The purpose of our work was to explore the prognostic added value on 2-y PFS and survival (using PFS as the endpoint) of a combination of clinical, PET-based, and radiomics features (RFs) extracted at baseline in DLBCL patients included in this latter prospective multicenter cohort in which patient management is driven by PET follow-up. A secondary objective was to identify whether baseline PET characteristics could predict patients’ response after 4 cycles of chemotherapy and consequently the treatment arm to which they would be assigned. Finally, a third was to assess whether a specific volume of interest (VOI) was more relevant for radiomics computation when the 2-y PFS classification and treatment prediction are considered.
MATERIALS AND METHODS
Patients and PET/CT Imaging
The GAINED phase 3 trial (NCT 01659099) was conducted in 99 centers and enrolled newly diagnosed untreated DLBCL patients between 18 and 60 y old. The main exclusion and inclusion criteria have already been reported (18). The patients received cyclophosphamide, doxorubicin, vincristine, and prednisone or ACVBP (doxorubicin, cyclophosphamide, vindesine, bleomycin, and prednisone) on a 14-d schedule plus obinutuzumab (GA-101) or rituximab. Interim PET was performed at diagnosis and after 2 and 4 cycles of chemotherapy (respectively, PET2 and PET4) and analyzed according to ΔSUVmax. Patients with an early good response (defined as negative PET2 and PET4) continued the planned immunochemotherapy; slow responders (positive PET2 and negative PET4) received intensification therapy with 2 courses of high-dose methotrexate followed by autologous stem cell transplantation. Patients with positive PET after 4 induction cycles received salvage therapy. No difference in terms of 2-y PFS was reported between the 2 induction arms (GA-101 vs. rituximab). Early good responders and slow responders had similar 2-y PFS and overall survival. 18F-FDG PET scans were performed according to the local procedure of each center. All images were reconstructed in SUV normalized for body weight.
Segmentation, Features Processing, and Selection
A gross VOI was manually delineated for each tumor, removing nontumor adjacent regions when needed. The final segmentation for each tumor was extracted using a fixed SUV threshold of 4.0 (19). Several PET-based imaging biomarkers were extracted from each reconstructed volume using PyRadiomics version 3.0 (20). Four conventional PET features were extracted: TMTV, whole-body total lesion glycolysis, SUVmax, and dissemination (maximum distance between 2 lesions normalized by body surface area). Among the RFs available for computation, a subset of 39 features was preselected (Supplemental Fig. 1; supplemental materials are available at http://jnm.snmjournals.org), choosing those that presented the best properties of repeatability (21–23). Before RF computation, PET images were resampled to the same voxel size (2 × 2 × 2 mm) using a bicubic spline interpolation. Data were subsequently normalized using 2 approaches: a linear equalization using 64 bins and a fixed bin width of SUV 0.3. A subsequent preprocessing step was used to enhance imaging characteristics: a wavelet transform using coiflet-1 filters to decompose the original image into 8 decomposition frequencies and an edge-enhancement Laplacian of gaussian filter (with 2- and 6-mm σ). This led a total of 647 RFs, which were computed from 3 different VOIs: the VOI with the most intense SUVmax (named hottest), the VOI that corresponded to the largest volume (named largest), and TMTV.
The RF selection step was divided into 3 parts. First, the reliability of textural RFs (excluding first-order and shape features) was derived following the methodology proposed by Pfaehler et al. (24). Briefly, for each patient and each RF, the signal within the ROI was randomly shuffled 50 times and RF subsequently computed. The RF was considered unreliable if its original value lay within the 95% CI computed using the random shuffling. Finally, the RF was kept if its original value was outside the proposed CI for 90% of the patients. Second, all RFs that correlated strongly (Spearman correlation higher than 0.9) with 1 of the 4 conventional PET features were removed. Lastly, a hierarchic agglomerative clustering was applied to manage multicollinearity between features (supplemental methods).
All features were then standardized, setting the mean to zero and the SD to 1 to make the feature space homogeneous.
Machine-Learning Models
The population was split into training and testing datasets with a ratio of 80% to 20%, stratified according to the 2-y PFS outcome for the 2-y PFS classification objective and according to the censorship and number of events per quartile for the survival analysis. Data augmentation was used on the training dataset to increase the minority class cardinal to the cardinal of the majority class. Both the synthetic minority oversampling technique (25) and the adaptive synthetic sampling approach for imbalanced learning (26) were considered one of the hyperparameters of the model.
For the 2-y PFS classification objective and the PET4 prediction, a logistic regression (LR) including elastic net regularization was considered. A 4-fold cross validation for the grid search was used on the training dataset (parameters detailed in Supplemental Table 1), with an objective of maximizing the area under the receiver operator characteristic (ROC) curve (AUC). The whole process was repeated 100 times to assess the variance of the model linked to the choice of the test dataset (Supplemental Fig. 2).
For the survival analysis, the model building was done in 2 main steps. A univariate analysis for each considered feature was conducted by fitting the Cox proportional-hazards model on the training dataset to select only those features significantly associated with the patient outcome using the training dataset. A penalized multivariate Cox analysis was then conducted using a 4-fold cross validation on the training dataset to select the best hyperparameters among the penalization strengths (Supplemental Table 2). A regression score (RS) was then derived for each patient by summing each term of the Cox proportional-hazards model (weight multiplied by the corresponding feature) (15). The population was then split according to the median of the RS to derive 2 survival groups. This RS cutoff was subsequently applied to the testing dataset. This process was repeated 100 times as for the previous 2-y PFS classification objective (Supplemental Fig. 3).
The 2 models (one for classification and one for survival) were implemented for 9 groups of different feature subsets, summarized in Table 1. Model 3, termed clinical, includes the same features as model 1, termed age-adjusted international prognostic index, with the difference being that the features are considered continuous in model 3 whereas a categorical score is used in model 1.
Description of Different Models
Since the consolidation arm was included in the features groups, none of the patients who died before the consolidation phase were considered in the study. Moreover, patients censored before 24 mo were not included for the 2-y PFS classification task.
Patient Follow-up and Statistical Analysis
The 2-y PFS was defined as the time from randomization to disease progression, relapse, or death of any cause. A mean ROC curve for 2-y PFS and PET4 classification was generated taking into account the 100 loops. Accuracy, balanced accuracy, sensitivity, specificity, and AUC were computed. AUC among the 100 loops was compared using a 1-sided Wilcoxon signed-rank test among the 9 models embedding different feature subsets. A similar approach was used to derive the most valuable ROI (among the 3 studied) to compute RFs. We reported the results of the 9 models using only the ROI leading to the best performance when radiomics is involved in the considered models. Feature importance was subsequently derived from the LR weights to highlight which features were the most informative. To this end, the best parameters of LR were chosen by 4-fold cross-validation on the training dataset, and then LR was retrained 100 times (Supplemental Fig. 2). Finally, box plots and sorted bar charts of absolute values were derived from LR weights.
Patient survival was estimated by Kaplan–Meier analysis, and survival curves were compared using the log-rank test. Box plots of P values related to each model (over the 100 loops) were plotted and then were compared using a 1-sided Wilcoxon signed-rank test. The probability of selecting a feature after the univariate Cox analysis was also computed to highlight feature importance. All statistical analyses were done using Python version 3.7.9. A P value of less than 0.05 was considered statistically significant.
RESULTS
Patient Characteristics
Among the 670 patients enrolled in the GAINED study, 561 were considered for this analysis. For the 2-y PFS classification approach, the study included 545 patients, of whom 86 underwent an event before 24 mo. For the survival approach, the study included 561 patients, of whom 107 underwent an event before the last follow-up. These patients have demographic and clinical characteristics similar to those of the entire GAINED population. Patient characteristics are summarized in Table 2. Among the 561 patients in our cohort, there were 386 early responders, 84 slow responders, and 91 who did not respond.
Patient Characteristics
2-Year PFS Classification
Comparisons of the predictive values of radiomics extracted from different VOIs are presented in Supplemental Figure 4. The mean AUC was 0.62 ± 0.07 for radiomics extracted from both the largest lesion and the TMTV but was 0.54 ± 0.07 for radiomics extracted from the hottest lesion. Since the Wilcoxon test reported a significant difference (P < 0.0001) between results extracted from either the largest lesion or TMTV and the hottest lesion, only radiomics computed from the largest lesion were considered.
ROC curves for models involving 1 group of features (from models 1 to 5) are shown in Figure 1A. The model with the highest predictive value was that including clinical features (model 3), with a mean AUC of 0.65 ± 0.07. Models involving consolidation features (model 2) and conventional PET (model 4) achieved a mean AUC of 0.64 ± 0.06 and 0.60 ± 0.07, respectively, which are better than for model 1 (age-adjusted international prognostic index), which achieved a mean AUC of 0.56 ± 0.06. Only model 1 was significantly different from all others (P < 0.001). Models combining several groups of features (from models 6 to 9) reached a mean AUC from 0.72 ± 0.06 to 0.69 ± 0.06 without significant differences in between.

Mean ROC curves for models 1–5 (A) and 6–9 (B) for 2-y PFS classification.
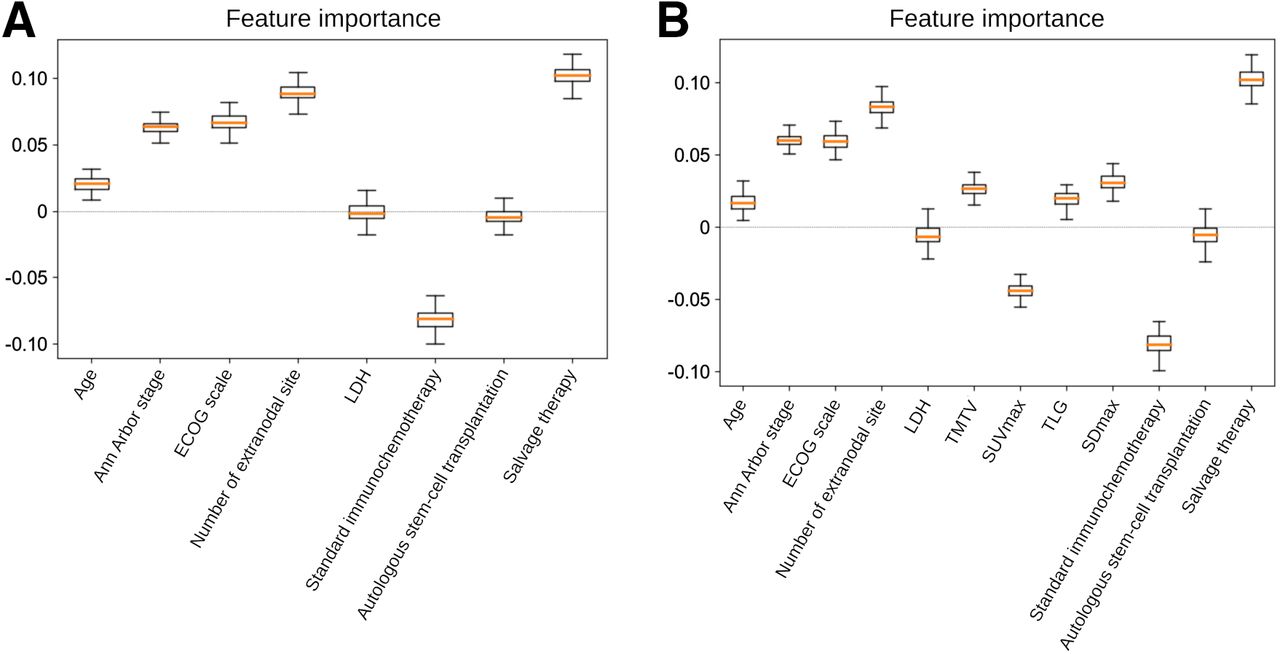
The importance of each feature was derived from the weights resulting from the LR attached to each feature. A positive weight sign tends to classify patients in the positive class (progression occurred) when the feature value increases. Inversely, a negative weight sign tends to classify patients in the negative class when the feature value increases. The feature importance for models 6 and 7 is plotted in Figure 2. The number of extranodal sites, Eastern Cooperative Oncology Group scale, and Ann Arbor stage were among the most important features when considering clinical features. The consolidation treatment regimen received was also highly predictive of 2-y PFS. Adding conventional PET features (Fig. 2B) or radiomics did not notably change the ordering of the most important features (Supplemental Fig. 5).

Feature importance according to relative weight attached to each feature in LR model for models 6 (A) and 7 (B) for 2-y PFS classification. ECOG = Eastern Cooperative Oncology Group; LDH = lactate dehydrogenase; SDmax = maximum distance between 2 lesions normalized by body surface area; TLG = total lesion glycolysis.
Survival Analysis for PFS
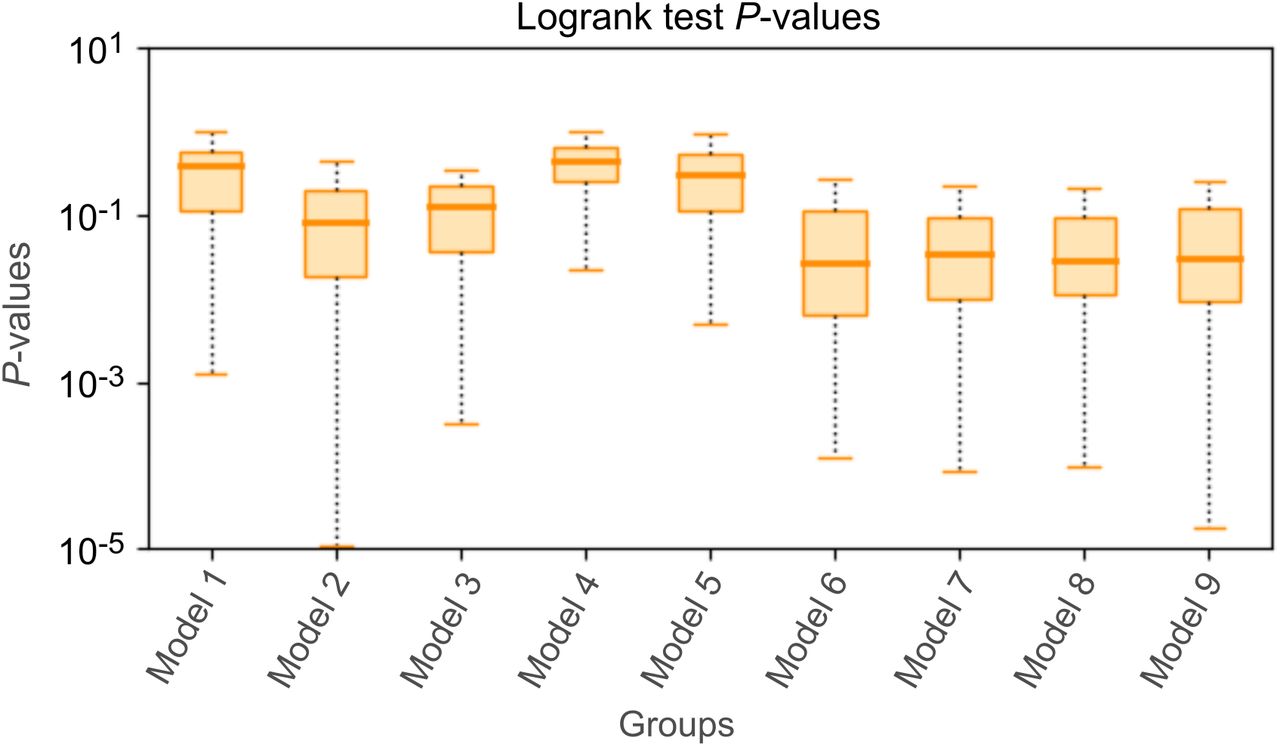
The probability of selecting each feature for its superior significance compared with others (computed over the 100 loops) using the models combining several groups of features (from models 6 to 9) is presented in Supplemental Figure 6. The most important features selected in the previous classification task were also always selected for this current survival analysis study. An example relative to 1 loop of an RS histogram and associated Kaplan–Meier curves built using the median cutoff RS is shown in Figure 3 for model 6. The corresponding log-rank P values for the test dataset are presented in Figure 4. The median P value for models involving 1 group of features (from models 1 to 5) was lowest for the model involving only the consolidation treatment (model 2) and was significantly different from models involving age-adjusted international prognostic index (model 1, P < 0.0001), clinical parameters (model 3, P < 0.05) conventional PET features (model 4, P < 0.0001), or RFs (model 5, P < 0.0001). Among models that combined the consolidation treatment plus one or more feature groups (from models 6 to 9), the median P value was the lowest for model 6 but without being significantly lower than for all other models (from models 7 to 9).

Example of RS for training set (A) and corresponding test set (C), along with associated Kaplan–Meier plots for PFS for training set (B) and test set (D). Low- and high-risk groups were dichotomized using median RS determined on training set and applied on test set.

Log-rank P values over 100 loops for 9 models considered for survival analysis study.
PET4 Prediction
Comparisons of predictive values of radiomics extracted from different VOIs are presented in Supplemental Figure 7. No significant difference was highlighted between the different VOIs. Then, for consistency reasons with the 2-y PFS classification, the largest one was retained.
ROC curves for models involving 1 group of features (models 1, 3, 4, and 5) are shown in Figure 5A. The model involving radiomics (model 5) was significantly better than all others (P < 0.0001), with a mean AUC of 0.61 ± 0.07. When combined, only the models involving radiomics exhibited the best performance (Fig. 5B), with a mean AUC of 0.62 ± 0.07 (P < 0.0001).

Mean ROC curves for models 1, 3, 4, and 5 (A) and for models that combined several features (B) for PET4 prediction. Model 7b = combination of clinical and conventional PET features; model 8b = combination of clinical and radiomics; model 9b = combination of clinical and conventional PET features and radiomics.
DISCUSSION
The last 2 decades witnessed multiple trials exploring a PET-driven strategy to identify poorly responding DLBCL patients requiring more intensive salvage therapy. These works have yielded heterogeneous results, as many relied on qualitative visual evaluation (3). Assessing ΔSUVmax after 2 and 4 cycles of induction regimens showed improved reproducibility and significantly reduced false-positive rates. This semiquantitative criterion was applied in 2 large multicentric prospective PET-guided trials (PETAL and GAINED). The first one, although disappointingly reporting no efficacy in escalation of PET2-positive patients to an intensified Burkitt chemotherapy, clearly defined ΔSUVmax as a valid measure to differentiate patients with chemotherapy-sensitive tumors from those with chemotherapy-resistant tumors. In the GAINED study, as opposed to PETAL, positive interim PET’s unfavorable prognostic value could be overcome with escalation of therapy and autologous stem cell transplantation. These data represented an important cornerstone in the management of DLBCL patients, suggesting that quantitative ΔSUVmax criteria can be applied in routine practice to evaluate metabolic response and drive the therapeutic strategy. The question now arises as to what additional data would refine the prediction of early response to therapy. In a multiparametric approach, some teams are exploring circulating tumor DNA analysis, whereas some are investigating the value of PET biomarkers at baseline. Although the role of SUVmax at baseline to predict the 2-y PFS or overall survival was shown to be limited (4), evaluation of predictive value in DLBCL patients using TMTV (5), dissemination (6), and RFs (9–17) has recently been considered.
In this study, our findings supported the fact that conventional PET metrics, dissemination, or RFs are predictive of outcome. Nevertheless, we extend these results by showing that these features seem to have no additional predictive capabilities compared with treatment arm or clinical features in the frame of the GAINED protocol. Interim PET assessment through the use of ΔSUVmax allowed an accurate stratification of DLBCL patients into 3 risk groups, of which PET4-positive patients are those with the worst outcome, despite salvage therapy. The impact of the GAINED strategy in modifying conventional immunochemotherapy on the basis of these findings significantly and sufficiently improved patient outcome to override the value of the other PET parameters. The results were also suggested by the HOVON-84 trial, in which baseline TMTV did not add prognostic value to ΔSUVmax (27).
This work also allowed exploration of the influence of VOI choice on the prognostic performance of radiomics. We were able to confirm the results of Eertink et al. (13) on interest in computing RFs from the TMTV or the largest lesion rather than the hottest lesion. Although this observation may seem surprising, it provides a better understanding of intrapatient interlesional tumor heterogeneity. This is an important factor that is actually also explored by the ΔSUVmax method. It compares the lesion with the highest SUVmax, at baseline and at interim PET, which is not necessarily the same hottest lesion as before the start of treatment, to measure the metabolic activity of the most active or aggressive tumor contingent.
Baseline PET characteristics showed limited performance in predicting results at PET4 and subsequently each patient’s risk group and treatment arm. Nevertheless, unlike the 2-y PFS classification, radiomics seems to be of importance in that context since it outperformed the models that involved only the clinical information or the PET conventional features. This paves the way to the development of more advanced machine-learning models taking into account (or not) hand-crafted radiomics. Moreover, early identification of patients at highest risk could be of relevance in a context where innovative treatments, such as cell-based therapies, require a significant preparation and set-up phase.
CONCLUSION
This study suggests that metrics extracted from 18F-FDG PET at baseline for this cohort of DLBCL patients and treated according to the PET-driven design of the GAINED protocol do not improve the 2-y PFS classification and PFS prediction. The model including the consolidation strategy, which was in turn directed by ΔSUVmax, combined with clinical features achieved the best performances.
DISCLOSURE
This work has been supported in part by ISITE NExT (No. ANR-16-IDEX-0007), the French National Research Agency Labex IRON (No. ANR-11-LABX-0018-01), the INCa-DGOS-Inserm-12558 (SIRIC ILIAD), and the European Regional Development Fund, Pays-de-la-Loire (Connect Talent MILCOM), Nantes Métropole (Convention 2017-10470). Steven Le Gouill reports grants, personal fees, or nonfinancial support from Roche Genentech during the conduct of the study; personal fees from Celgene; and grants and personal fees from Janssen-Cilag, GILEAD/kite, and Servier outside the submitted work. René-Olivier Casasnovas reports grants, personal fees, and nonfinancial support from Roche Genentech during the conduct of the study; personal fees from MSD, BMS, Abbvie, Amgen, Celgene, Janssen, and Astra Zeneca; and grants and personal fees from Takeda and GILEAD/kite outside the submitted work. No other potential conflict of interest relevant to this article was reported.
KEY POINTS
QUESTION: Do baseline 18F-FDG PET biomarkers add prognostic value to the PET-driven strategy of the GAINED study in DLBCL patients?
PERTINENT FINDINGS: Regardless of the VOI or features selection, conventional or radiomics 18F-FDG PET biomarkers extracted at baseline do not seem to improve the results in terms of 2-y PFS and survival prediction for patients treated according to the GAINED protocol.
IMPLICATIONS FOR PATIENT CARE: Interim PET assessment using ΔSUVmax variation allows for accurate and simple monitoring and should be considered for use in routine practice in patients with advanced DLBCL.
ACKNOWLEDGMENT
We warmly thank Enzo Lepoivre for his invaluable support in finalizing the manuscript.
Footnotes
Published online Nov. 9, 2023.
- © 2024 by the Society of Nuclear Medicine and Molecular Imaging.
REFERENCES
- Received for publication April 14, 2023.
- Revision received October 17, 2023.
In this issue


Jump to section
Related Articles
Cited By...
- No citing articles found.