


Abstract
P1128
Introduction: Bone marrow (BM) is considered the main organ at risk for 177Lu-PSMA radiopharmaceutical therapy. Its radiosensitivity is associated with red marrow (RM) cells which are one of the components of the spongiosa structure, with the other two being yellow marrow (YM) and trabecular bone (TB). BM dose can be estimated either using indirect blood-based or direct image-based methods using pre-calculated self- and cross-dose S values from a standard phantom with fixed proportion of red marrow in the spongiosa. However, the specific red marrow distribution in the spongiosa is not necessarily known. The impact of activity distribution within the spongiosa and its corresponding dose distribution needs to be understood. In this study, we investigate the impact of red marrow distribution in the spongiosa on BM dose based on Monte-Carlo (MC) simulations.
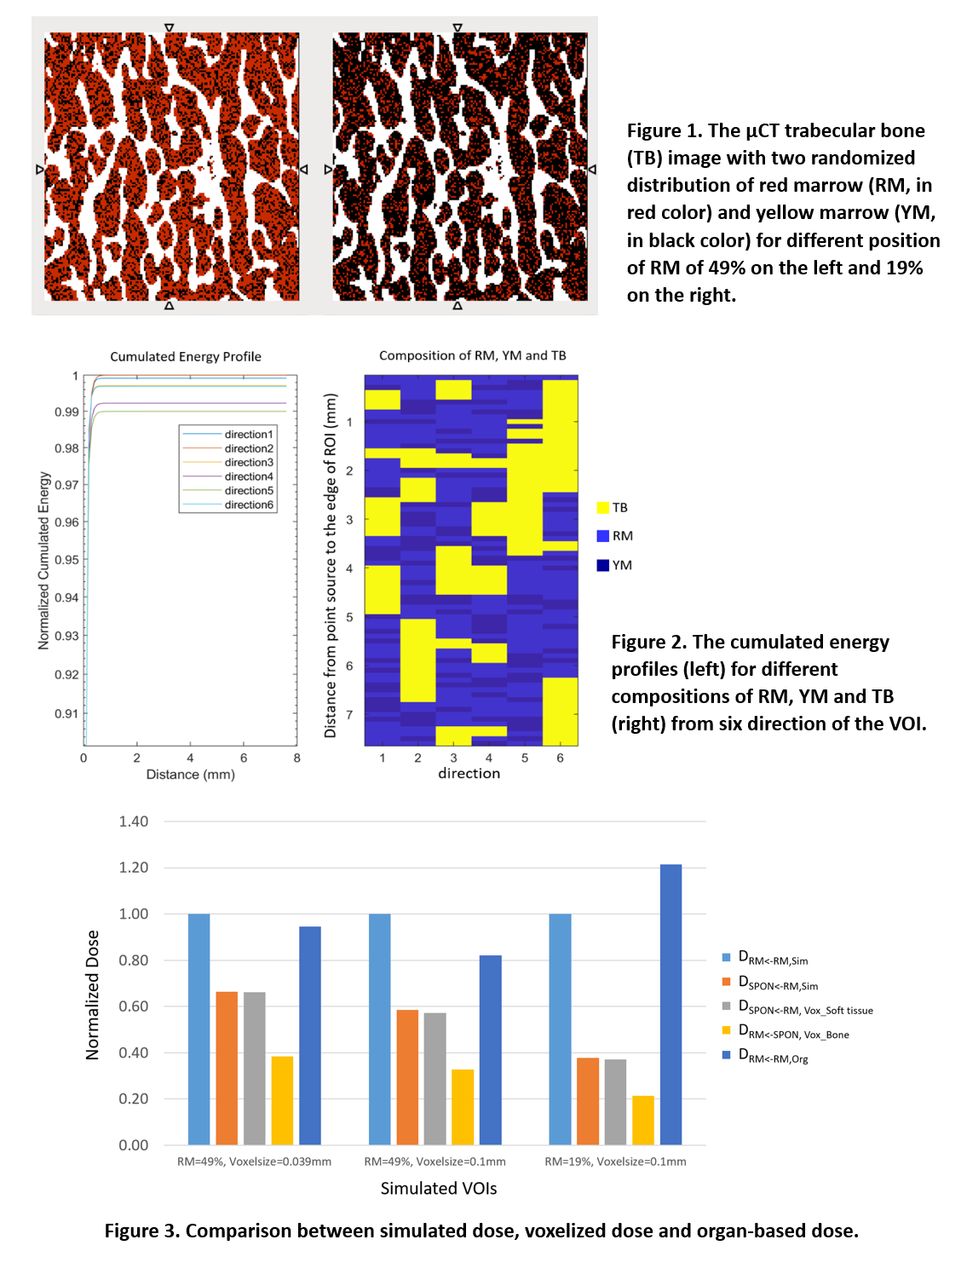
Methods: A 3D µCT image (151x151x151 matrix; voxel size 0.039x0.039x0.039 mm3) of porcine trabecular bone specimen was used as input to MC simulations performed in GATE v.9.2. The image was resampled into 0.1mm3 voxel sizes to account for different sizes of marrow clusters. First, a point source of 177Lu (109 primaries for each simulation) located in the image center was simulated. Deposited energy along multiple directions from image center, accounting for different path combinations of YM, RM and TB, were explored. Subsequently, RM cells were randomly placed within the marrow clusters in the µCT, assuming two different volume fractions of RM, YM and TB of 49%:25%:26% and 19%:55%:26%, with similar percentage of RM in lumbar spongiosa and humerus spongiosa, respectively. To simulate the situation of radiopharmaceuticals binding to RM cells, 177Lu was only added to the RM voxels. BM doses to both the whole spongiosa (DSPON<-RM,Sim) and pure RM (DRM<-RM,Sim) (only energy deposited in RM was considered) were extracted.
Additionally, 177Lu dose kernel convolution (separately for soft tissue and bone) was performed with the image resampled to a pixel size of 3mm. The absorbed dose to this whole pixel was compared to the known RM dose from the smaller voxel sizes.
Results: For the point source simulations, cumulated energy deposited along the distance from the source to the edge of the image in different directions (i.e. different combinations of RM, YM and TB) were within 90% of agreement. Similar results were also found when the voxel size was 0.1 mm3. For randomized RM activity distribution in the µCT, the simulated mean dose for spongiosa DSPON<-RM,Sim was the same as voxelized dose DSPON<-RM,Vox, with differences <2.5% for all cases of voxel sizes and RM distributions, using the dose kernel for soft tissue. But, the difference increased to up to 45% when using bone kernel. The ratio of DRM<-RM,Sim/DSPON<-RM,Sim depended on the RM composition in the image, which were 1.5 (voxel size=0.039mm) and 1.7 (voxel size=0.1mm) with 49% of RM in the volume; while it was >2.5 for 19% RM. Various dose differences between organ-based method DRM<-RM,Org and simulations were found for the VOI voxel size and RM distribution, ranging from -18% to 22%.
Conclusions: BM dose estimates are challenging to perform as BM is not an organ that is usually imaged and the true distribution within the spongiosa is not fully known. Because of this, ‘organ-level’ S-values may not reflect accurate BM doses. When voxelized dosimetry is performed (typically with image voxel sizes >1mm), this only reflects the dose to the entire spongiosa; not necessarily the RM within that voxel. According to our findings, different BM distributions and compositions would result in differences between spongiosa dose and RM dose, thus the relationships and distributions of RM and spongiosa needs to be carefully addressed by considering various cases of RM, YM and TB combinations which can reflect different parts of human bones. This study is a first step towards fully understanding the relationships between BM dose and BM distribution.

In this issue


Jump to section
Related Articles
Cited By...
- No citing articles found.