


Abstract
3263
Introduction: We investigated the quantitative accuracy of PET images using a deep learning-based image restoration (DLR) algorithm [1][2] and compare with OSEM with Gaussian filter.
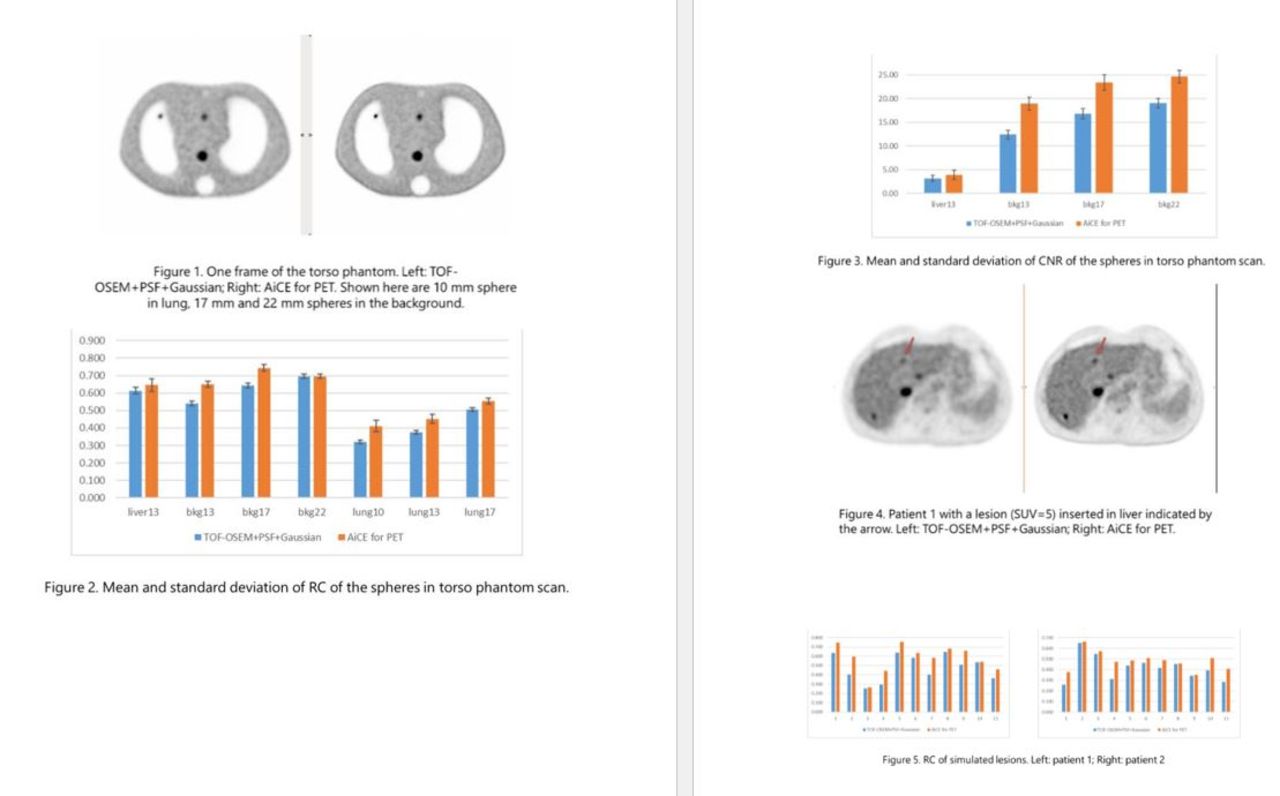
Methods: A torso phantom was injected with FDG and scanned on a Cartesion Prime PET/CT scanner (Canon Medical). The phantom had seven spherical inserts to simulate lesions with a tumor:liver:background ratio of 4:2:1. One sphere (d=13 mm) was in the liver, three spheres (d=10/13/17 mm) were in the lungs and three spheres (d=13/17/22 mm) were in the body background. Background concentration was 5.5 kBq/cc at the beginning of the scan. We acquired data for 90 minutes. The listmode file was divided into 36 frames, with the frame duration adjusted for decay. The first frame was 2 minutes.
We also did Monte Carlo simulations based on two clinical FDG wholebody scan data (patient 1: BMI=19.4, 300 MBq, uptake time 51 min, 2 min/bed, 5 beds, patient 2: BMI= 39.2, 266 MBq, uptake time 53 minutes, 2 min/bed, 6 beds). Eleven lesions were inserted digitally (spheres with d=6 mm) in mediastinum, lungs, liver, and bones of each patient (SUV range 1.5-10). Simulations were done using GATE with inserted lesions and patient geometry. Finally, the simulated data were added to the listmode file of the clinical scan.
All the data were reconstructed using a clinical protocol (TOF-OSEM with PSF, 4 iterations, 12 subsets, 6 mm Gaussian filter) and AiCE for PET, a DLR algorithm on Cartesion Prime.
From all the images, we calculated the recovery coefficient (RC), which was defined as the ratio between the measured activity concentration to the true value. For the torso phantom images, we drew a spherical ROI with exact size on the co-registered CT image. For the patient simulation data, spherical ROIs (d=6 mm) were defined using the known location of the inserted lesions. The voxel values in each ROI were averaged to calculate the RC. Two 3 cm diameter spherical ROIs were drawn, one in the background and the other in the liver, to measure the background and noise around the lesions. Contrast to noise ratio (CNR) was calculated for the spherical inserts in the liver and background of the torso phantom, which was defined as (Mean(lesion)-Mean(lesion_background))/SD(lesion_background). The lesion background is either the phantom background or the liver compartment, depending on the location of the lesion.
Results: For the torso phantom data, the RC averaged over 36 frames range from 0.322 to 0.696 in the TOF-OSEM+PSF+Gaussian images and 0.411 to 0.744 in AiCE for PET images. For all lesions AiCE showed higher average RC (paired t-test, p<0.001). The biggest relative increase of average RC was of the smallest (10 mm) sphere in the lung (28%). The CNR calculated for four lesions (one in liver and three in background) increased in AiCE images compared to TOF-OSEM+PSF+Gaussian images (paired t-test, p<0.001), the range of increase was 24% to 53%.
For the patient simulation data, AiCE for PET showed higher RC for all the lesions simulated. The relative increase of the RC ranges from 1.4% to 50% for patient 1 and 1.4% to 51.7% for patient 2 (mean: 23% for patient 1 and 19.8% for patient 2, median: 18.1% for patient 1 and 10.8% for patient 2).
Conclusions: Both phantom scan and simulation study using patient data and inserted lesions showed that AiCE for PET can improve the quantitative accuracy of PET images compared to TOF-OSEM+PSF+Gaussian, especially for small lesions, as demonstrated by the increase in RC. Image quality was also improved, as indicated by the higher CNR in AiCE for PET images.
References:
[1] C. Chan, et al, An Investigation Study of Deep Learning Convolutional Neural Network for Whole-Body PET Denoising, in RSNA, 2018.
[2] B. Bai and M. Iatrou, Advanced intelligent Clear-IQ Engine (AiCE) Deep Learning Reconstruction for PET Imaging with Cartesion Prime Digital PET/CT, White paper, 2021.

In this issue


Jump to section
Related Articles
Cited By...
- No citing articles found.