


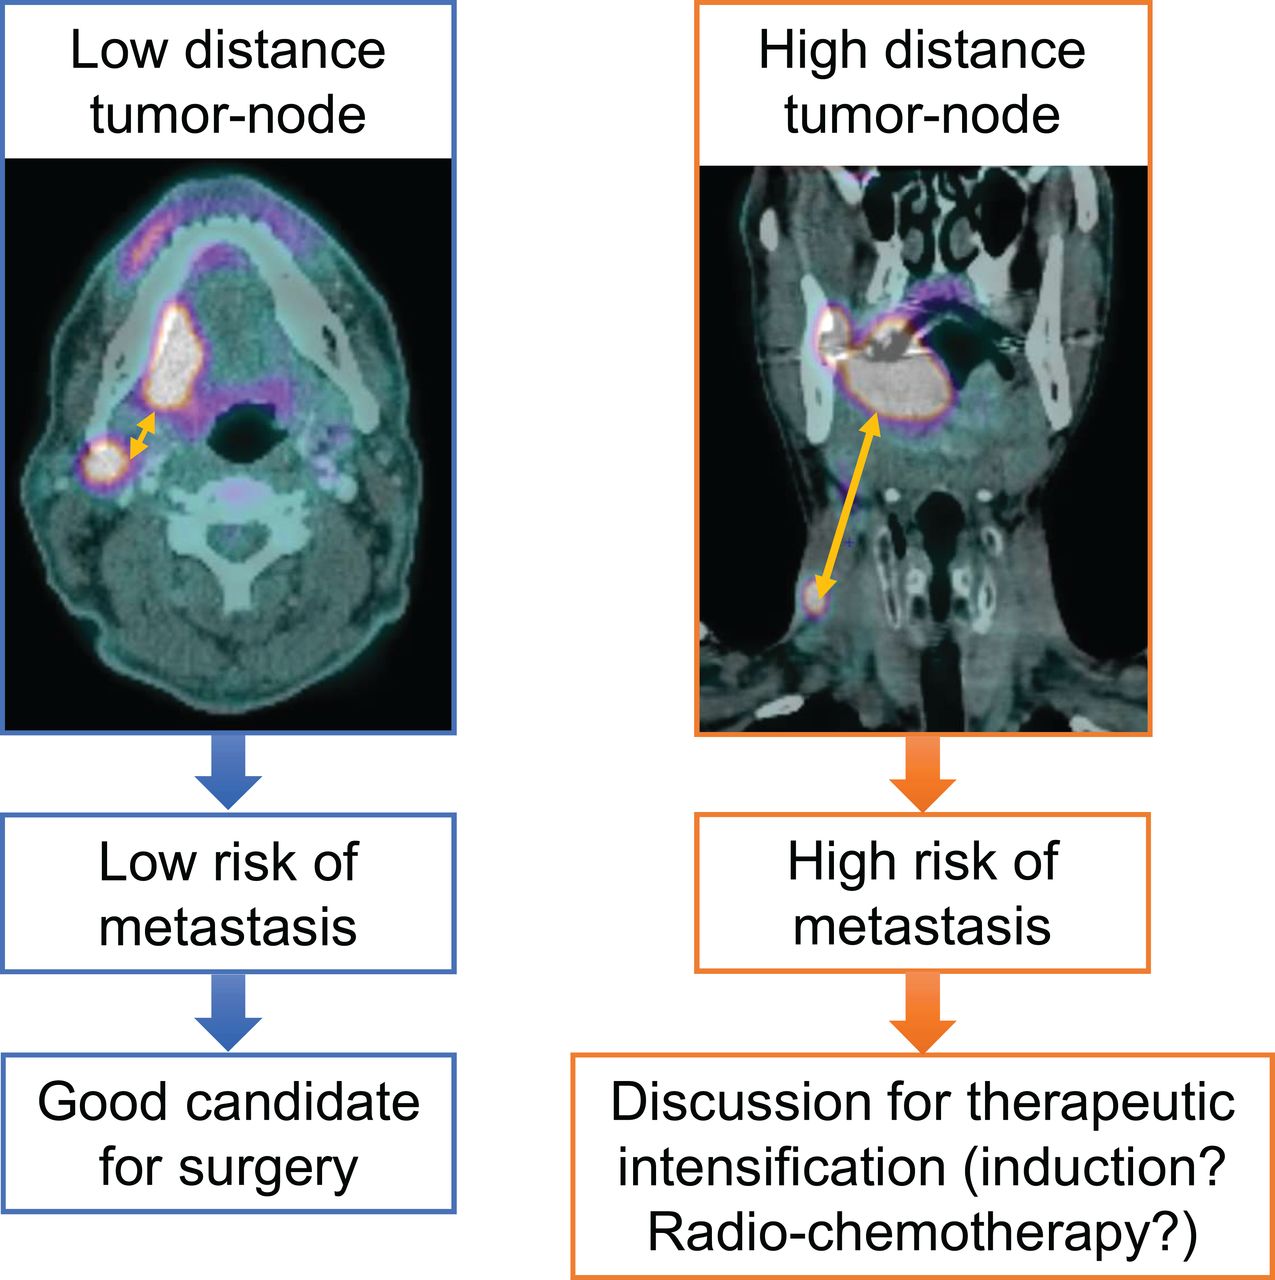
Visual Abstract
Abstract
The aims of this multicenter study were to identify clinical and preoperative PET/CT parameters predicting overall survival (OS) and distant metastasis–free survival (DMFS) in a cohort of head and neck squamous cell carcinoma patients treated with surgery, to generate a prognostic model of OS and DMFS, and to validate this prognostic model with an independent cohort. Methods: A total of 382 consecutive patients with head and neck squamous cell carcinoma, divided into training (n = 318) and validation (n = 64) cohorts, were retrospectively included. The following PET/CT parameters were analyzed: clinical parameters, SUVmax, SUVmean, metabolic tumor volume (MTV), total lesion glycolysis, and distance parameters for the primary tumor and lymph nodes defined by 2 segmentation methods (relative SUVmax threshold and absolute SUV threshold). Cox analyses were performed for OS and DMFS in the training cohort. The concordance index (c-index) was used to identify highly prognostic parameters. These prognostic parameters were externally tested in the validation cohort. Results: In multivariable analysis, the significant parameters for OS were T stage and nodal MTV, with a c-index of 0.64 (P < 0.001). For DMFS, the significant parameters were T stage, nodal MTV, and maximal tumor–node distance, with a c-index of 0.76 (P < 0.001). These combinations of parameters were externally validated, with c-indices of 0.63 (P < 0.001) and 0.71 (P < 0.001) for OS and DMFS, respectively. Conclusion: The nodal MTV associated with the maximal tumor–node distance was significantly correlated with the risk of DMFS. Moreover, this parameter, in addition to clinical parameters, was associated with a higher risk of death. These prognostic factors may be used to tailor individualized treatment.
The therapeutic management of head and neck squamous cell carcinoma (HNSCC) is based on surgery, radiotherapy, and medical treatments, alone or in combination, according to the prognosis estimated by the American Joint Committee on Cancer (AJCC) staging system (1).
Despite therapeutic progress and the updating of the AJCC staging system, the prognosis of HNSCC patients remains poor because of a high recurrence rate (30%–40%) (2).
18F-FDG PET/CT reveals the metabolic activity of a tumor (glycolysis) in addition to strict anatomic extent. This examination is now commonly used to assess the extent of HNSCC (3) and for posttreatment follow-up (4). The effectiveness of 18F-FDG PET/CT parameters as prognostic biomarkers appears to be a promising research path for multiple tumor locations (5–7), without additional cost, time, or radiation dose (8). However, fewer data are available for HNSCC patients treated with surgery, although more than half of patients are treated with primary resection. These patients are mostly included in small numbers in the same group of analyses as patients treated with radiochemotherapy, who have different clinical and histologic profiles.
Moreover, whereas visual analysis is sufficient for diagnosis, staging, and the detection of recurrence, quantification appears necessary for the prediction of patient outcome (5). The SUVmax is the most widely used parameter in clinical practice, but it corresponds only to the maximal pixel value in the tumor. More recently, volumetric 18F-FDG PET/CT parameters—that is, metabolic tumor volume (MTV) and total lesion glycolysis (TLG), which consider overall tumor uptake—were developed. Moreover, studies on lung cancers introduced the concept of disease solidity (9,10), which consists of measuring disease spread by computing the relationship between the volume of the main tumor and all secondary nodes with respect to the volume of their convex hull (11,12). This concept has never been analyzed for HNSCC, and volumetric metabolic parameters have never been incorporated into this concept. Nonetheless, computing these parameters requires delineating the tumor. One of the most commonly chosen segmentation methods consists of using a threshold set at 41% of the SUVmax (13). Although there are no consistent data for using this specific threshold to compute MTV (14), few studies have compared different thresholds for MTV or TLG.
Eventually, the lack of 18F-FDG PET/CT acquisition parameter standardization between institutions (15) could affect the generalization of the existing data, as most of the studies published so far have been monocentric.
In this context, the aims of the present study were to identify clinical and preoperative PET/CT parameters predicting overall survival (OS) and distant metastasis–free survival (DMFS) in an initial cohort of HNSCC patients treated with surgery, to generate a prognostic model of OS and DMFS, and to validate this prognostic scoring system with a second independent cohort of patients.
MATERIALS AND METHODS
Inclusion Criteria
All consecutive patients treated with primary surgery for HNSCC between January 1, 2010, and March 31, 2018, at 3 French hospital centers were retrospectively reviewed.
The inclusion criteria were as follows: 18 y of age or older, no history of cancer, histologically proven HNSCC, preoperative PET/CT, and a minimal follow-up of 3 mo.
Patients with carcinoma of unknown primary syndrome, nasopharyngeal, cutaneous, and salivary gland squamous cell carcinoma, discovery of distant metastases at the initial extension assessment, SUVmax for the primary tumor of less than 3, and tumor volume of less than 4 mL were systematically excluded from the study.
Access to the oncologic network databases was approved by the institutional ethics committees and by the French National Commission for Data Protection and Liberties (CNIL no. 2211146) and was in accordance with the 1964 Helsinki Declaration and its later amendments or comparable ethics standards. Confidentiality was assured for all participants regarding any personal responses and information provided, as all data collected were anonymized.
Patient Characteristics and Treatment Results
Of the 3,877 patients reviewed, 557 were eligible for the study and 382 were finally included (Fig. 1).

Flowchart. CUP = carcinoma of unknown primary.
All patients underwent tumor resection that could be associated with neck dissection according to the clinical and radiologic preoperative stages. Postoperative radiotherapy was performed with or without chemotherapy in patients with a high risk of locoregional recurrence.
Physical examination and laryngoscopy were performed every 3 mo for the first 2 y, every 6 mo for the next 3 y, and then annually. The database was locked on August 31, 2019.
The entire cohort was divided into a training cohort from Rennes and Brest, including 318 patients, and a validation cohort from Nantes, including 64 patients.
PET/CT Acquisition
All patients underwent 18F-FDG PET/CT for staging before surgical treatment. The PET/CT acquisition parameter data are summarized in Supplemental Table 1 (supplemental materials are available at http://jnm.snmjournals.org).
PET/CT Analysis
For each patient, the gross tumor volume (GTV) of the primary tumor (GTV) and the GTV of the lymph nodes (GTV) were manually segmented on each PET/CT scan by the same experienced investigator (radiation oncologist), who referred to the nuclear radiologist report. This delineation step was performed on axial, coronal, and sagittal sections using MIM Software SVVRTMIMS1 (version 6.7; MIM Software Inc.), with a CT window set from −160 to 240 Hounsfield units and a PET window set from 0 to 5 SUV. A region of interest (ROI) was then computed by adding a 3-dimensional margin of 5 mm to the GTV of the primary tumor (ROI-T) and the GTV of the lymph nodes (ROI-N). All lymph nodes were included in the same unique ROI.
A set of quantitative parameters based on SUV histograms were extracted from ROI-T and ROI-N on PET images using the QuantImage web service (16). SUVmax was first computed from ROI-T as the SUVmax in the delineated volume. Various metabolic volumes were subsequently defined on the basis of 2 segmentation methods: an absolute threshold of the SUV (ranging from 0 to 20, with steps of 0.5) or a relative threshold of the SUVmax (ranging from 0% to 100%, with steps of 1%). Metabolic intensity parameters were computed using the 2 segmentation methods at each threshold for both ROI-T and ROI-N. Relative thresholds for ROI-N were computed on the basis of the SUVmax of the primary tumor. The MTV was computed as the metabolic volume of the segmented region in milliliters. If there were several nodes, then the MTV for nodes corresponded to the sum of the MTVs of each node. The TLG was computed as SUVmean × MTV of the corresponding delineated region.
Tumor spread, also called disease solidity (9), was analyzed by computing various distance measures between the barycenter of the main tumor (ROI-T) and the barycenter of each nodal metastasis (ROI-N) or of all nodal metastases (16).
Statistical Analysis
OS was calculated from the day of surgery to the date of death from any cause. Patients alive at the time of analysis were censored at the date of last follow-up.
DMFS was calculated from the day of surgery to the date of first distant progression or to the date of death.
Follow-up was calculated using reverse Kaplan–Meier estimation. Both DMFS and OS estimations were computed using the Kaplan–Meier method, and a 2-sided log-rank test was used to compare the groups.
The analyses were performed as suggested in the TRIPOD statement (17).
In the first step, the analysis was performed only on the training cohort. The association of the pretreatment parameters with OS and DMFS was first assessed using univariable Cox analyses. We used the inverse probability of censoring weighting version of the concordance index (c-index). Significant parameters were identified (P < 0.05), and Harrel’s c-index was calculated (18). The c-index was used to determine the optimal SUV threshold giving the most predictive value for each PET parameter with a P value of <0.1.
Factors with a P value of <0.1 and with the highest c-index after univariable analyses were assessed with the multivariable Cox regression model using backward elimination. Variables were removed from the model if the P value was >0.1. Multivariable Cox analyses were performed to identify the significant parameters and the standardized coefficients of the prognostic model.
In the second step, the Cox prognostic models were used to compute the prognostic index for the patients in the validation cohort, and the corresponding c-index of each model was computed.
On the basis of this model, a nomogram was built to estimate the individual OS and DMFS probabilities at 24 mo.
Two types of validation of the prognostic model were performed. In the first step, an internal validation for the patients in the training cohort was performed by the bootstrap method (1,000 datasets constructed by random resampling with replacement from the original). This method was used to estimate the adjusted c-index and the 95% CI of each parameter. In the second step, the β-coefficients from the training model were applied to the external validation cohort, and the corresponding c-index was computed.
All analyses were performed using R software 3.4.0 (R Foundation for Statistical Computing).
RESULTS
Patient Outcomes
The median OSs for the training and validation cohorts were 63 mo (95% CI, 51 to not reached) and 91 mo (95% CI, 34 to not reached), respectively (P = 0.79). For the entire cohort, the 2-y OS rate was 75% (95% CI, 70%–80%). For the entire cohort, 35.34% died and 12.83% developed metastases. Among the patients who died, 36.30% had metastases. The patient, tumor, treatment, and follow-up characteristics of the training and validation cohorts are shown in Supplemental Table 2.
Identification of Cox Model for Predicting OS in Training Cohort
The results of the univariable analysis are shown in Table 1.
Univariable Cox Analyses for OS in Training Cohort*
The retained significant parameters from the multivariable analysis were T stage and MTV for nodes with a threshold of 3 (Fig. 2). The c-index of the model was 0.64 (P < 0.001). The hazard ratios (HRs) of the corresponding Cox model are presented in Figure 2, allowing the calculation of a prognostic index (OS probability) for each patient. On the basis of the Cox model, a nomogram was computed (Fig. 3).

Parameters significantly affecting OS in training cohort in multivariable analysis (number of deaths = 116; c-index = 0.64).

Nomogram for predicting OS at 24 mo. For each PET parameter, corresponding points were obtained by drawing line upward from corresponding values to “Points” line. Total points for each patient were obtained by summing points for each individual factor in nomogram and were plotted on “Total points” line. Line was drawn downward to read corresponding predictions of 24-mo OS.
Identification of Cox Model for Predicting DMFS in Training Cohort
The results of the univariable analysis are shown in Table 2.
Univariable Cox Analyses for DMFS in Training Cohort*
The retained significant parameters from the multivariable analysis were T stage, MTV for nodes with a threshold of 3, and maximal tumor–node distance (Fig. 4). The c-index of the model was 0.76 (P < 0.001). The HRs of the corresponding Cox model are presented in Figure 4, allowing the calculation of a prognostic index (DMFS probability) for each patient. On the basis of the Cox model, a nomogram was computed (Fig. 5).

Parameters significantly affecting DMFS in training cohort in multivariable analysis (number of patients with distant metastasis = 51; c-index = 0.76).

Nomogram for predicting DMFS at 24 mo.
Internal and External Validations of Prognostic Model
After internal bootstrap validation, the adjusted c-indices were estimated to be 0.63 (P = 0.0002) and 0.74 (P < 0.001) for OS and DMFS, respectively. The 95% CIs for the coefficients of the parameters of the model are shown in Supplemental Table 3 (OS) and Supplemental Table 4 (DMFS). Internal calibration showed a good adjustment between the predicted and observed OS and DMFS at 24 mo (Supplemental Fig. 1). The β-coefficients from the training model were applied to the external validation cohort, achieving c-indices of 0.63 (P < 0.001) and 0.71 (P < 0.001) for OS and DMFS, respectively.
DISCUSSION
To our knowledge, this is the first study presenting an 18F-FDG PET/CT–based prognostic model including the concept of tumor dispersion to stratify the risks of distant metastases and death in patients with HNSCC treated with surgery. In this multicentric study of 382 patients, we demonstrated that the integration of pretreatment PET quantitative imaging features and conventional clinical prognostic factors enables the identification of patients with a high risk of distant relapse or death.
Patients with the same stage and type of tumor could respond differently to the same treatment and eventually have different outcomes (19). As we observed in the present study, stage cN was not correlated with OS, and the AJCC stage had a lower c-index than PET/CT volumetric and distance parameters (Tables 1 and 2). This result is consistent with reports in the literature for patients with HNSCC treated with radiochemotherapy (20). Indeed, among 470 patients with p16-negative oropharyngeal cancer treated with radiochemotherapy, the c-index of the PET prognostic model based on SUV entropy and asphericity was significantly higher than that of clinical parameters (Eastern Cooperative Oncology Group score, O’Sullivan stage, and AJCC stage), achieving c-indices of 0.75 versus 0.57 (P < 0.001) for the Eastern Cooperative Oncology Group score, 0.58 (P < 0.001) for the O’Sullivan classification, and 0.57 (P < 0.001) for the AJCC stage (21).
These new prognostic factors should allow better identification of patients with HNSCC at high risk of recurrence after surgery, with the aim of improving the therapeutic strategy through “personalized medicine” (22), based on characteristics inherent to each patient and not on population-based risk assessments such as staging (23).
The first PET parameter to be analyzed was the SUVmax (24). Although easy to use in routine clinical practice, this 18F-FDG PET/CT parameter is now increasingly being seen as unreliable as a prognostic factor (5,14). Indeed, in the present study, the SUVmax was not correlated with OS or DMFS in the multivariable analysis. In a cohort of 162 patients with oral cavity carcinoma treated with surgery, pretreatment MTV and TLG were both independent predictive factors for OS (HR, 2.64 [95% CI, 1.35–5.21] [P = 0.005]; and HR, 3.30 [95% CI, 1.50–7.24] [P = 0.003]), whereas SUVmax was not (HR, 1.92 [95% CI, 0.92–3.96] [P = 0.080]) (25). In a systematic review of the prognostic value of PET parameters for patients with surgically treated HNSCC, MTV or TLG was found to have a higher prognostic value than SUVmax (14).
Nevertheless, to be used, these volumetric parameters need a specific delineation (5). Four techniques can be used: a threshold of the SUV (absolute [all voxels with an SUV greater than x], relative [greater than x% of SUVmax], or adaptive) or gradient-based, clustering, or statistical methods. No consensus has currently been found (26). However, it has been demonstrated that the results vary greatly depending on the segmentation technique used, much greater than the interoperator variability during contouring (27). We chose to use the intensity threshold thanks to its availability in nuclear medicine services and because our objective was to edit a prognostic model for patients with surgically treated HNSCC usable in routine clinical practice. However, we decided to explore a wide range of continuous thresholds from 0% to 100% of the SUVmax and from 0 to 20 of the SUV and not be restricted to the usual threshold of 41% of the SUVmax. Indeed, the limits of this threshold have already been displayed in patients with HNSCC treated with radiochemotherapy (20,28). To our knowledge, no study has analyzed different threshold values with such precise segmentation in patients treated with surgery. We demonstrated that the MTV of the primary tumor computed with a relative threshold of 23% was significantly associated with OS, with a c-index of 0.64 (P < 0.001). This relative threshold is lower than the threshold of 41% currently used. These data are consistent with the threshold that has been demonstrated in patients with locally advanced HNSCC treated with radiotherapy (35% of the SUVmax) (29,30). Conversely, in cancers of the cervix, among 89 patients treated with radiochemotherapy, a threshold of 50% of the SUVmax was most significantly correlated with recurrence-free survival (c-index, 0.752; HR, 1.065; P < 0.001) (31). Therefore, it appears that the threshold value used for the delineation of the tumor must be adapted to the tumor location and to the prognostic data sought. Indeed, in the present study, to predict DMFS and OS, lower thresholds (15%–25% of the SUVmax) seem to be more relevant. Despite the fact that we performed an external validation, because of the difference from the threshold of 41% used routinely, an additional validation of these thresholds by other groups would be interesting.
In addition to the volume parameters, the tumor dispersion parameters also seemed to be promising, especially for the DMFS (Fig. 4). This notion suggests that the quantitative imaging feature that examines spatial dispersion of the disease may also be relevant for prognosis (9,32). Indeed, the parameter of maximum distance between the tumor and the lymph node remained correlated with DMFS in multivariable analysis (HR, 1.12 [95% CI, 1.03–1.21]). For non–small cell lung cancers, the addition of distance parameters to the conventional model with prognostic factors alone yielded a significant improvement in the likelihood ratio test (P = 0.007) (9).
The present study had some limitations. First, the fact that the analysis was retrospective may have had an impact regarding the diagnosis of distant metastases. We only included patients with a minimal follow-up of 3 mo, to exclude deaths due to surgical complications (not related to oncologic evolution). Second, the impact of the heterogeneity of the work flows of acquiring 18F-FDG PET/CT images on the data resulting from the quantification is the subject of debate (15,26,33). However, we developed a multicenter study with different acquisition parameters and performed an external validation of the prognostic model in an independent population of HNSCC patients. Although the prognostic value of p16 status in oropharyngeal cancer has already been demonstrated (34), it was excluded due to a lack of data. Besides, quantitative analyses from 18F-FDG PET/CT revealed carbohydrate metabolic hyperactivity in tumor cells, named the Warburg effect (35). However, some of the cN3 stages and voluminous tumors have a necrotic central part, which is therefore not considered during the extraction of 18F-FDG PET/CT parameters, which underestimates the tumor volume. Other radiotracers, such as 18F-fluoromisonidazole and 18F-fluoroazomycinarabinoside, could then be used; these have already demonstrated their potential prognostic interest in terms of OS (36) but are not yet used in clinical practice. Conversely, in case of contact between the primary tumor and an involved lymph node, an overestimation of the tumor volume may be calculated because of the inclusion of the lymph node tumor volume in the metabolic volume of the primary tumor. An SUVmax of less than 3 and a tumor volume of less than 4 mL were excluded to avoid high variability in a very small volume. Finally, we exclusively investigated PET/CT imaging; however, PET/MRI analyses also seem to be interesting in prognostic terms, although they are very rarely performed in HNSCC oncology (37).
CONCLUSION
The volumetric and distance parameters appeared to be independent prognostic factors in terms of OS and DMFS, with higher c-indices than the clinical parameters currently used.
By integrating them into a prognostic model, we could be able to identify HNSCC patients at higher risk of distance relapse (metastasis/DMFS) and death. These patients could then receive early therapeutic intensification to improve their prognosis.
DISCLOSURE
The LTSI, INSERM, U1099 (Rennes, France) and the Cancer Institute (Rennes, France) supported the study. No other potential conflict of interest relevant to this article was reported.
KEY POINTS
QUESTION: The aim of this study was to identify clinical and preoperative PET/CT parameters predicting OS and DMFS in a cohort of HNSCC patients treated with surgery.
PERTINENT FINDINGS: In this retrospective multicentric study of 382 patients, the nodal MTV associated with the maximal distance between the primary tumor and the lymph node or with clinical parameters was significantly correlated with a higher risk of distant metastasis or death, respectively.
IMPLICATIONS FOR PATIENT CARE: These parameters may be used to tailor individualized treatment.
Footnotes
Published online Dec. 9, 2021.
- © 2022 by the Society of Nuclear Medicine and Molecular Imaging.
REFERENCES
- Received for publication July 11, 2021.
- Revision received November 16, 2021.
In this issue


Jump to section
Related Articles
Cited By...
- No citing articles found.