


Visual Abstract

Abstract
A few 18F-FDG PET/CT studies have revealed the presence of brain hypermetabolism in the brain stem and cervical spinal cord of patients within the amyotrophic lateral sclerosis/frontotemporal dementia (ALS/FTD) continuum. We aimed to investigate this finding through a hybrid PET/MRI system, allowing a more precise depiction of the spatial pattern of metabolic changes in the brain stem and cervical spinal cord. Methods: Twenty-eight patients with a diagnosis of ALS or a diagnosis of the behavioral variant of FTD plus motoneuron disease, as well as 13 control subjects, underwent 18F-FDG PET/MRI. Mean normalized 18F-FDG uptake in the midbrain/pons, medulla oblongata, and cervical spinal cord as defined on the individual’s MRI scans were compared between groups. Furthermore, the associations between regional 18F-FDG uptake and clinical and demographic characteristics—including gene mutation, type of onset (bulbar, spinal, dementia), and clinical characteristics—were investigated. Results: A significant (P < 0.005) increment in glucose metabolism in the midbrain/pons and medulla oblongata was found in ALS/FTD patients (spinal-ALS and FTD–motor neuron disease subgroups) in comparison to controls. No relevant associations between clinical and metabolic features were reported, although medulla oblongata hypermetabolism was associated with shortened survival (P < 0.001). Conclusion: Increased glucose metabolism in the brain stem might be due to neuroinflammation, one of the key steps in the pathogenic cascade that leads to neurodegeneration in ALS/FTD. 18F-FDG PET/MRI could be a valuable tool to assess glial changes in the ALS/FTD spectrum and could serve as a prognostic biomarker. Large prospective initiatives would likely shed more light on the promising application of PET/MRI in this setting.
The clinical overlap between amyotrophic lateral sclerosis (ALS) and frontotemporal dementia (FTD) has been widely recognized, with behavioral/cognitive symptoms occurring in a certain number of patients with ALS, and signs of motoneuron disease in several patients with FTD (1). This, along with the discovery of shared genetics and pathophysiologic mechanisms, has informed the recharacterization of the 2 diseases as the extremes of a common neurodegenerative spectrum (ALS/FTD).
From a pathophysiologic perspective, these diseases present proteinaceous cytoplasmic aggregates that eventually lead to neuronal degeneration and loss. Glial cells are also actively involved in the ALS/FTD pathology. Among these are astrocytes, which cause excitotoxicity when their role in synaptic glutamate reuptake is impaired, and microglia, which the phenotype evolves from neuroprotective to neurotoxic through the course of the disease (2). Neuropathologic studies in ALS patients have found depletion of motor neurons and diffuse glial infiltration in the gray and white matter of the spinal cord and the motor cortex (3). As predicted, both activated microglia and astrocyte markers have been observed in imaging studies of ALS (4,5) and FTD patients (6,7).
Several neuroimaging techniques have been applied to ALS and FTD cohorts to explore their use as potential disease biomarkers. Cortical MRI hallmarks of ALS are bilateral atrophy of the primary motor cortex (precentral gyrus) and degeneration of the corticospinal tract and corpus callosum (8). An MRI study including diffusion tensor imaging (9) showed reduced fractional anisotropy in corticospinal tracts, frontal and temporal lobes, and the regions that connect the motor and premotor cortex. Moreover, at a functional level, changes in the connectivity of neural networks within motor and extramotor domains have been demonstrated through electroencephalography (10) and functional MRI (11) studies. These insights, in line with findings that show how patients with different degrees of cognitive impairment have significantly different patterns of frontal lobe metabolic impairment when assessed using 18F-FDG PET (12), could partially explain the heterogeneous clinical manifestations and spreading of the disease.
In line with this possibility, several PET/CT studies on ALS/FTD patients, including proven C9orf72 carriers, focused on cortical structures, showing frontal and temporal hypometabolism (13,14). Conversely, the few that explored other central nervous system regions found increased 18F-FDG uptake in the cerebellum, brain stem (15,16), and spinal cord (17–19) of patients with ALS when compared with controls. The reason for the increase in regional glucose uptake is still a matter of debate.
In light of these findings, we chose to assess glucose metabolic patterns, analyzing separately the midbrain/pons, medulla oblongata, and cervical spinal cord of ALS/FTD patients, as compared with control subjects, by means of coacquired PET and MR images. As PET/CT images can lead to difficulties in delineating volumes of interest (VOIs), this was the first study (to our knowledge) in this setting to exploit the potential of the hybrid PET/MRI technique, which, relating 18F-FDG values to precise anatomic substrates, can improve result accuracy. Furthermore, we aimed to estimate the association between the degree of 18F-FDG uptake and clinical characteristics such as type of clinical presentation, including site of onset, presence of the C9orf72 mutation, disease progression, and survival.
MATERIALS AND METHODS
Participants
In total, 28 patients diagnosed with ALS (n = 16) or FTD who developed motor neuron disease (MND) in the course of the disease (n = 12) and underwent 18F-FDG PET/MRI (Biograph mMR; Siemens) at the Nuclear Medicine Unit of the University of Padova were retrospectively recruited between July and December 2019. Probable or definite ALS was diagnosed according to the El Escorial revised criteria (20), and the diagnosis was confirmed in all patients during their clinical follow-up. Patients with FTD were diagnosed with a behavioral variant of FTD according to the Rascovsky criteria (21) and developed signs of MND. The median time between diagnosis and 18F-FDG PET/MRI was 1 mo.
Thirteen participants who were referred to the nuclear medicine unit with a diagnosis other than neurologic disease, and were not showing any signs of brain disease under the same scanning procedure, served as control subjects.
The 28 patients were further classified according to the clinical presentation at the time of diagnosis as having bulbar ALS (n = 5), spinal ALS (n = 11), or FTD-MND (n = 12). Six patients (2 with spinal ALS and 4 with FTD-MND) carried a GGGGCC hexanucleotide repeat expansion in the first intron of the C9orf72 gene, and one (spinal ALS) carried a mutation of the VCP gene (9p13.3) coding for the valosin-containing protein.
The exclusion criteria included having a history of other neurologic disorders, cerebrovascular disease, diabetes mellitus, or systemic inflammatory disease. Moreover, other exclusion criteria were diagnostic uncertainty according to the El Escorial revised criteria and PET/MRI scans nonevaluable because of significant movement artifacts. The local ethical committee approved the retrospective study (protocol AOP1673-4831/AO/20). All patients and controls gave written informed consent before undergoing 18F-FDG PET/MRI, in accordance with the principles outlined in the Declaration of Helsinki.
Clinical Data
Demographic variables, as well as the time from onset or diagnosis to the 18F-FDG PET/MRI scan, were obtained for each patient. Moreover, the ALS-Functional Rating Scale, revised (ALS-FRS-r), was calculated (for ALS patients only, being a retrospective study) both at the time of diagnosis and at the latest available neurologic visit. Furthermore, a progression rate, also known as Δ-ALS-FRS-r (22), was calculated as (48 − ALS-FRS-r at time of diagnosis)/duration from onset to diagnosis (mo) for 15/18 ALS patients (for 3 patients, ALS-FRS-r was not available at the time of diagnosis). Muscle strength was assessed through the Medical Research Council scale.
Image Acquisition and Analysis
PET/MRI was performed between July 2015 and November 2019. Following the European Association of Nuclear Medicine guidelines (23), patients had to fast for 6 h before the injection of the radiopharmaceutical, and blood glucose had to be less than 200 mg/dL. A single 3 MBq/kg intravenous bolus of 18F-FDG was injected under resting conditions (in a dimly light room with the patient’s eyes closed) before the scan. PET and MRI scans were simultaneously acquired using a Siemens Healthcare Biograph mMR, which included several sequences (T1-weighted, T2-weighted, susceptibility-weighted, and diffusion-weighted) and a PET brain scan (acquisition time, 1,500 s; reconstructed using a 344 × 344 mm matrix and a 3-dimensional iterative reconstruction algorithm).
Postprocessing was performed using the Image Fusion tool within PMOD software (PMOD Technologies LLC): briefly, each 18F-FDG PET scan was finely realigned to the pertinent 3-dimensional, isotropic (1 mm) T1-weighted MRI scan on the basis of a rigid transformation (smoothing: gaussian filter width of 6.0 mm; dissimilarity function: normalized mutual information; interpolation method: trilinear; sample rate: 5.2/4.0 mm start/final; minimization method: Powell; function tolerance: 1.0–4).
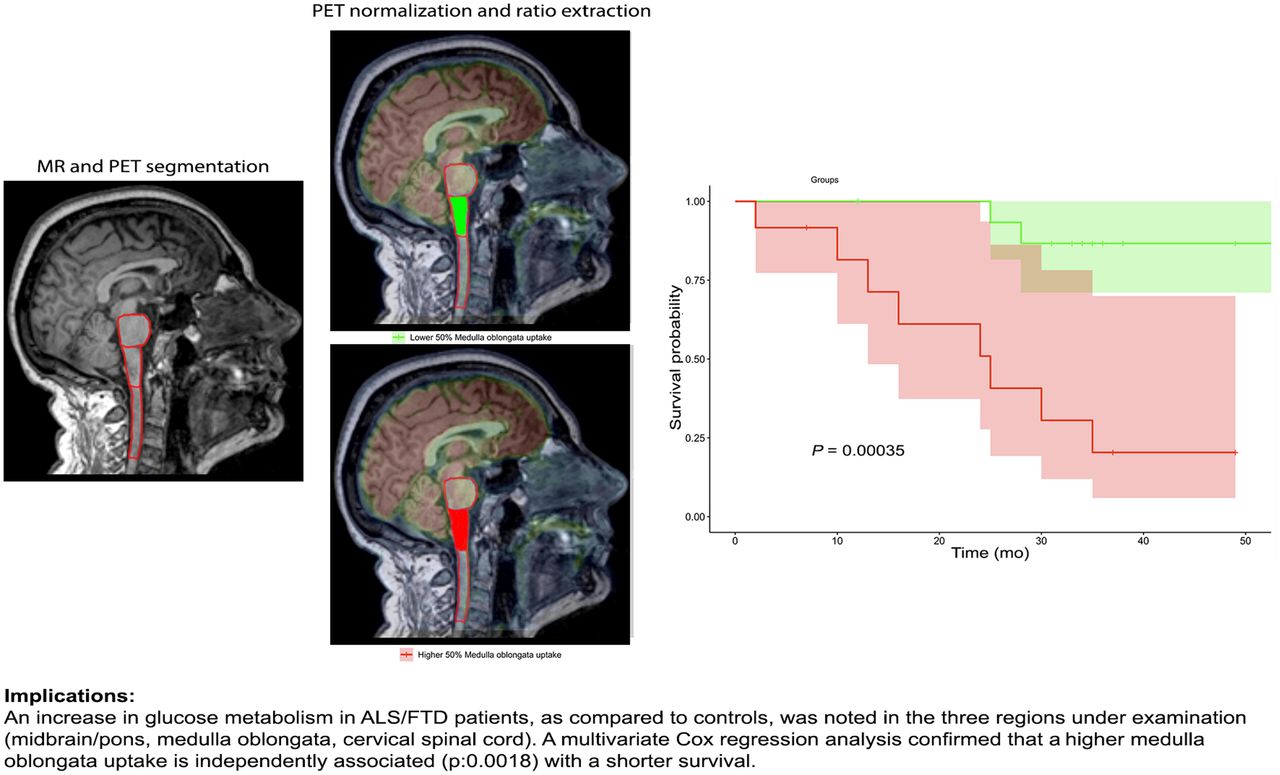
PMOD was then used to create VOIs (Fig. 1) both for patients and for control subjects. Creation of VOIs started with manual positioning—on 3-dimensional T1-weighted images—of visually adjusted cubical VOIs on the midbrain/pons, medulla oblongata, and cervical spinal cord (the region between the skull base and the plane adjacent to the caudal face of the C4 vertebral body). Isocontouring took place next (inside the defined cubical VOIs), with a threshold higher than 40% of the overall maximum uptake; several 3-dimensional VOIs were outlined (midbrain/pons, medulla oblongata, and cervical spinal cord). Finally, visually adjusted spheric VOIs were manually positioned in the parietooccipital white matter (as background VOIs) on the T1-weighted MR images.
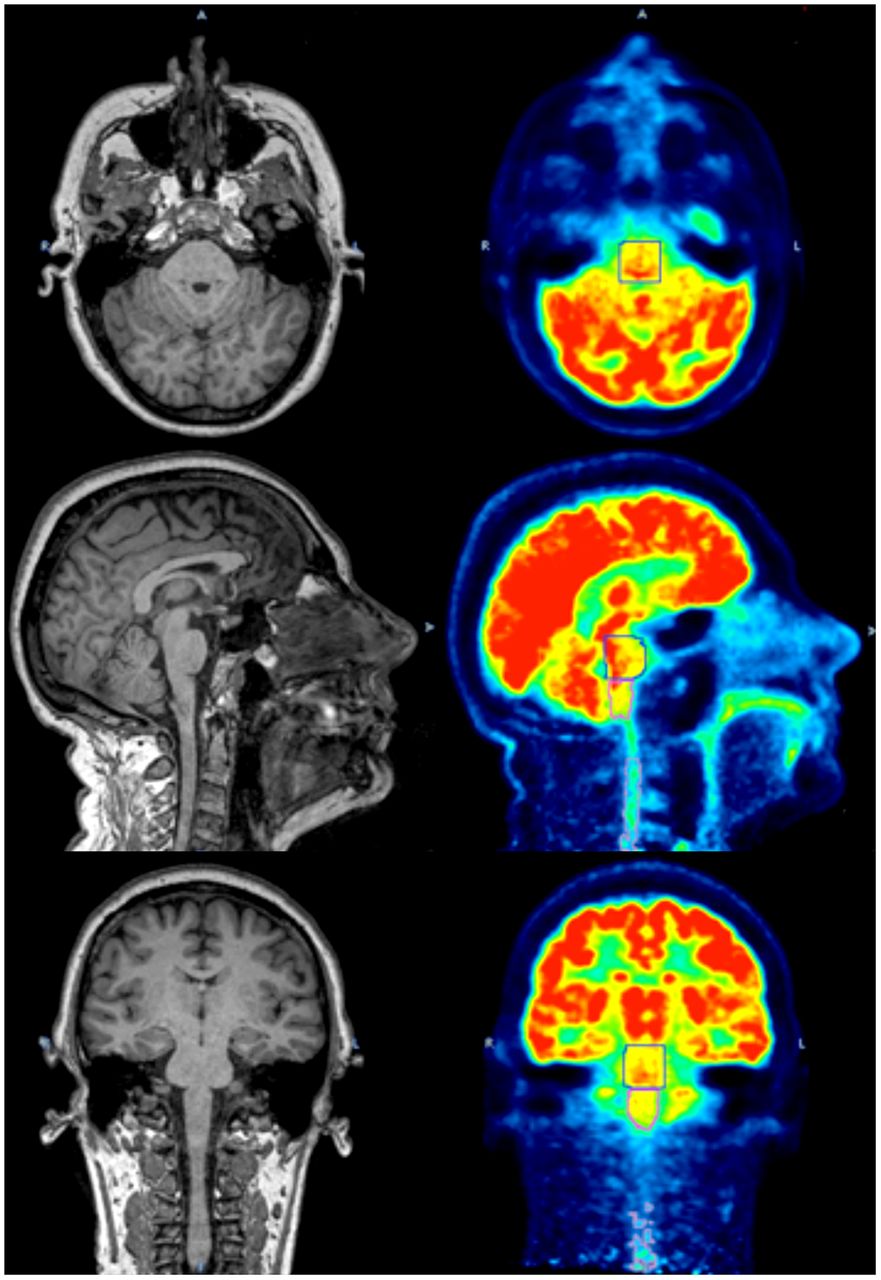
18F-FDG PET images (right) showing VOIs created using corresponding T1-weighted MR images (left). Axial (top), sagittal (middle), and coronal (bottom) views are shown.
For each subject, the mean uptake within each VOI was normalized using the mean uptake of the occipital white matter background VOIs (24), because this area has been reported to experience fewer 18F-FDG metabolic alterations (14).
Statistical Analysis
All data are reported as mean ± SD. After evaluating the gaussian distribution of data, unpaired t tests were performed to relate uptake value to categoric variables, whereas continuous variables were analyzed through correlation and linear regression testing. Since the age distribution significantly differed between patients and controls, a residual analysis for regression was applied when comparing the 2 groups (25). Log-rank testing was applied for survival analysis. A P value of less than 0.05 was considered significant. Univariate and multivariate survival analyses (considering genetics, site of onset, age at PET, and time from onset to PET) were performed.
RESULTS
The main clinical findings in ALS/FTD patients and control subjects are shown in Tables 1 and 2. No significant differences were found between the sex, weight, and height of the 2 groups, whereas the age distribution between patients (62.6 ± 8.2 y) and controls (52.8 ± 13.6 y) differed significantly.
Clinical and Demographic Characteristics of Study Subjects
Clinical Characteristics at Single-Subject Level
Examining MRI T2-weighted fluid-attenuated inversion recovery sequences, we found mild to moderate corticospinal tract hyperintensities in 8% of FTD-MND patients and 40% of ALS subjects. Susceptibility-weighted imaging (available for only ALS patients) revealed a variable degree of the motor band sign (cortical ferromagnetic deposition in primary motor cortex) in 64% of subjects.
We examined the relationship between metabolic patterns within the VOIs under examination with other clinical measures and the genetic background (C9orf72 mutation), although none of them showed a significant association.
After the PET/MRI study, follow-up lasted between 2 and 55 mo (median, 33 mo), during which patients showed a steep drop in their average ALS-FRS-r score (from 37.2 ± 6.5 to 29.4 ± 10.6). The calculated progression rate (Table 2) mildly correlated with medulla oblongata hypermetabolism (correlation coefficient, 0.45) but not with pontine (correlation coefficient, −0.02) or cervical spinal cord (correlation coefficient, 0.3) hypermetabolism. The variation in ALS-FRS-r score (last ALS-FRS-r as compared with the first one) did not, however, demonstrate a significant correlation with 18F-FDG hypermetabolism considering pontine (correlation coefficient, −0.13), medulla oblongata (correlation coefficient, 0.31), or cervical spinal cord (correlation coefficient, 0.31) regions.
During the study follow-up, 10 patients died (7 ALS and 3 FTD-MND); however, univariate Cox regression analysis did not prove significant for C9orf72 mutation, sex, clinical phenotype, or cognitive impairment (FTD-MND patients).
An analysis of the metabolic patterns of the midbrain/pons, medulla oblongata, and cervical spinal cord revealed a strong correlation between metabolic patterns of the 3 VOIs (Fig. 2A). Moreover, as visible from the density plots (Fig. 2B), the distribution of the uptake values was unbalanced between controls and patients, with the former showing decreased 18F-FDG uptake in all regions under examination compared with the latter.
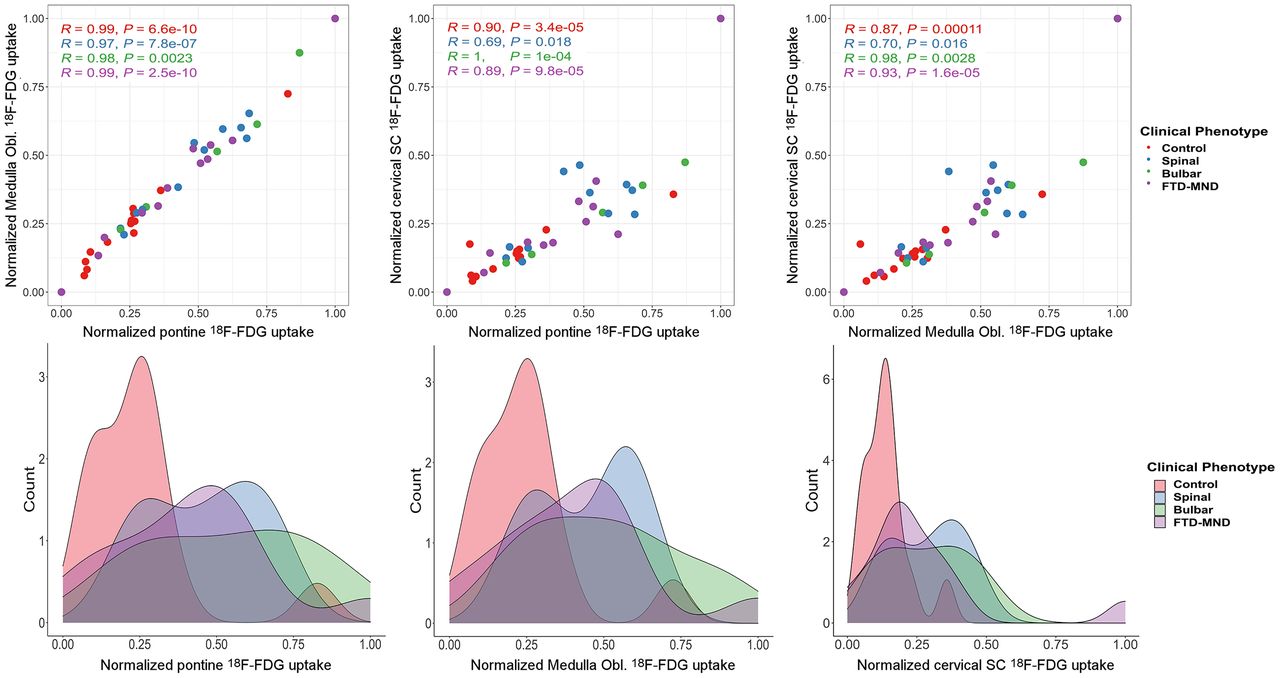
(Top) Paired plots showing strong correlation between uptake in 3 regions of each subgroup. (Bottom) Density plots displaying frequency of patients with low (e.g., controls) or high (e.g., ALS/FTD continuum) uptake of 18F-FDG for each subgroup. SC = spinal cord.
After normalization for the background VOIs and adjustment for age (25), an increase in glucose metabolism in ALS/FTD patients, when compared with controls, was detected in all 3 regions under examination. 18F-FDG uptake reached significantly higher values for patients than for controls in the midbrain/pons and medulla oblongata (Fig. 3) but not in the cervical spinal cord.
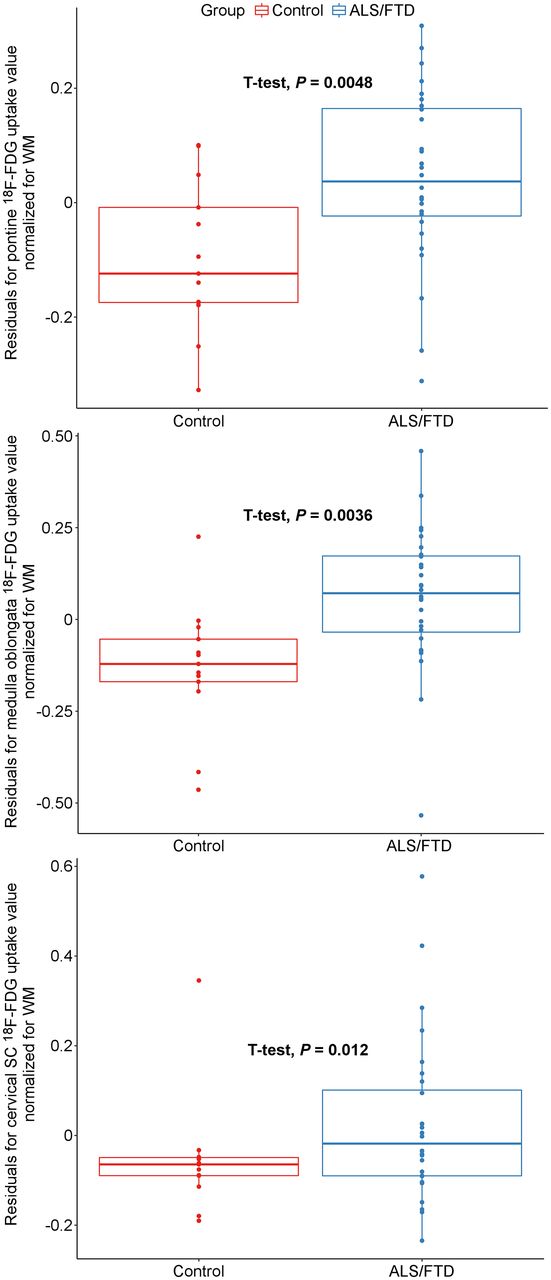
Results of residual analysis for regression between control and patient (ALS/FTD) normalized uptake values in midbrain/pons (top), medulla oblongata (middle), and cervical spinal cord (bottom). SC = spinal cord.
Analysis of spinal, bulbar, and FTD-MND subgroups showed a statistically significant relative hypermetabolism in the midbrain/pons and medulla oblongata when normalized to the white matter in patients with spinal and behavioral onset with respect to controls (Fig. 4). Uptake in patients with bulbar onset was not significantly different from controls, most likely because of their small number (n = 5). On the other hand, analysis among the 3 subgroups (bulbar, spinal, and FTD-MND) did not show any significant difference in 18F-FDG uptake in any of the explored regions, apart from the cervical spinal cord between spinal and bulbar-onset patients.
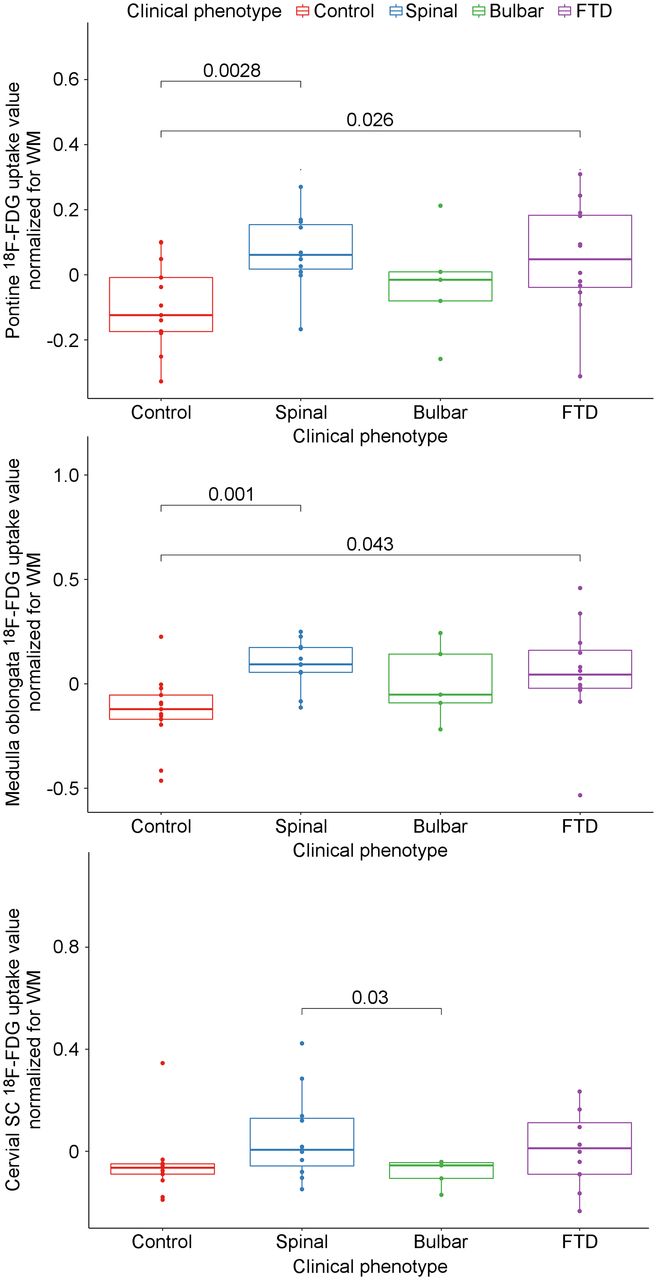
Subgroup analysis for 18F-FDG uptake. SC = spinal cord.
The Kaplan–Meier analysis and univariate Cox regression analysis (Table 3) at 50 mo after PET/MRI showed that the patients with normalized medulla oblongata uptake above the fifth decile (9/16 ALS and 5/12 FTD-MND presented normalized medulla oblongata uptake > 50%) had a significantly higher mortality rate than those below the fifth decile (log-rank test, P < 0.001) (Fig. 5), whereas the analysis results were not significant for the other regions under examination. A multivariate Cox regression analysis confirmed that a higher medulla oblongata uptake and a longer time from symptom onset to PET are independently associated with a shorter survival (Table 3). Clinical bulbar signs (such as dysarthria and dysphagia) at the time of PET examination (in 9/16 ALS and 2/12 FTD-MND subjects) did not statistically correlate (correlation coefficient, 0.18) with normalized hypermetabolism in the medulla oblongata.
Univariate and Multivariate Survival Analysis

Kaplan–Meier curve. After normalization of uptake for occipital white matter, patients were split into 2 subgroups: the 14 individuals with medulla oblongata uptake over 50th percentile showed significantly shorter survival than patients with medulla oblongata uptake below 50th percentile. Survival is expressed in months after PET/MRI scan. P value was calculated through log-rank test.
DISCUSSION
This study, to our current knowledge, was the first to exploit integrated 18F-FDG PET/MRI to study the metabolic patterns of patients with ALS and FTD. In our population, MRI could be useful when differentiating ALS subjects from FTD-MND because corticospinal tract hyperintensities seem to be more frequent in the former group (40% vs. 8%). Furthermore, we have noticed the motor band sign (susceptibility-weighted sequence) in the majority (64%) of ALS subjects. This qualitative finding could complement, at a single-subject level, the diagnostic accuracy of PET regional glucose hyper- and hypometabolism.
We detected midbrain/pons and medulla oblongata increased uptake in patients as compared with controls, confirming previous PET/CT findings (15,16). Furthermore, we determined how medulla oblongata metabolism relates to patient survival, suggesting a possible prognostic value for PET/MRI.
The results of our study indicated that the uptake of all 3 brain regions investigated (midbrain/pons, medulla oblongata, and cervical spinal cord) correlates significantly, as shown by the paired correlation (Fig. 2A). An explanation for the correlation of metabolic patterns in the 3 regions is the involvement of the corticospinal and corticobulbar tracts containing the projections of upper motor neurons from the motor cortex. A bimodal distribution could be seen in the density plot distribution of controls as compared with the ALS/FTD continuum in Figure 2B. The second lower peak of the bimodal distribution was, however, due to a single, slightly outlier, control subject.
Theoretically, the expected effect of a neurodegenerative disease is a reduction in tissue metabolic rate caused by neuronal loss; indeed, frontal hypometabolism is one of the cortical signatures of the diseases along the ALS/FTD spectrum (12–14). Nevertheless, strong evidence has been brought in favor of neuroinflammation as one of the key steps in the pathogenic cascade that leads to ALS/FTD. Initially described in pathology studies, glial infiltration has later been confirmed in vivo both in models and in humans (4,5).
A possible explanation, which links neuroinflammation with neurodegeneration, involves these 2 types of glial cells, namely activated microglia and astrocytes. Activated microglia, which have been found in the motor cortex, pons, and thalamus of patients with ALS, contribute to the pathogenesis propagating and sustaining the tissue damage through the release of free radicals and other neurotoxic substances such as glutamate. Moreover, a shift from a neuroprotective to a disrupting phenotype is apparent starting in the early stages of the disease (2). Astrocytes physiologically account for a consistent share of central nervous system glucose consumption. Thereafter, they start glycolysis to provide lactate to neurons; in hindsight, astrocytes play a key role in coupling glucose metabolism with synaptic activity. In the case of neurodegeneration, glutamate excess leads to an increased glucose accumulation in astrocytes, even though neurons degenerate (26). Moreover, during the course of the disease, astrocytes replace dead neurons and axons following the corticospinal and corticobulbar tracts, further increasing the metabolic uptake of the degenerating brain region. Neuroimaging evidence for the involvement of these glial cells in the pathogenesis of ALS/FTD has been brought by studies that exploited neuroinflammation-specific ligands such as 11C-l-deprenyl-D2 (4), mapping of astrocyte activation, the activated microglia marker 11C(R)-PK11195 (5,6), and translocator protein ligand 18F-DPA-714 (27), showing increased tracer uptake along the corticospinal tract.
From a metabolic perspective, these phenomena result in an increased relative 18F-FDG uptake in regions of neuronal degeneration in affected individuals compared with controls. However, when evaluating the relative weight of the 2 cell types, one must consider that the microglia seem to relate more to hypometabolic areas, as shown in frontotemporal areas of FTD patients (5,6), whereas astrocytosis drives glucose consumption and is, therefore, more likely associated with the hypermetabolic burden (26), in line with previous findings (4). We acknowledge that this evidence cannot prove the exclusive role of 1 of these 2 glial cells—a role that is based on a continuous interplay involving other cell types also—and that longitudinal studies will be needed to better characterize the interplay between neurodegeneration and hypermetabolism and differences in their behavior between upper and lower motor neurons.
An alternative reason for the finding of glucose hypermetabolism in ALS/FTD patients can be a methodologic issue involving the normalization process of 18F-FDG data. We normalized the uptake values of the regions of interest for the values of the occipital white matter to exclude interindividual differences. Normalizing for other regions would require an a priori assumption, namely that none of the background VOIs will be affected by hypo- or hypermetabolism. In the present study, occipital white matter was chosen as the reference because it seems spared from the ALS/FTD neurodegenerative process (14,24), and none of the PET/CT studies on subjects affected with the disease showed significant metabolic variations in that region.
Another issue we faced was the difference in age distribution between the 2 groups. To ignore this effect on the uptake values, we adjusted for age through a linear regression model (25) and we then used the residual values for the group analysis (Fig. 3). However, we usually expect a higher metabolism in younger patients with respect to controls. On the contrary, in this setting, although the controls were younger than the patients, they had a lower metabolism; this fact reassures us about the choice of groups selected and about the obtained results.
Although considering a small cohort, the subgroup analysis included patients with differences in ALS onset, namely spinal (n = 11), bulbar (n = 5), and behavioral/cognitive (n = 12). Although the groups with spinal or behavioral onset showed higher 18F-FDG uptake than did controls, bulbar onset did not prove significant because of the small number of individuals in that group. Interestingly, the density plot of normalized 18F-FDG uptake in FTD-MND was similar to that of patients with ALS (Figs. 2 and 4). Therefore, we can state that hypermetabolism in the corticospinal tract could be a common feature for all the ALS subgroups, thereby suggesting, once again, common metabolic and pathophysiologic patterns within the disease spectrum. Prospective studies involving a larger number of individuals with different sites of onset, including FTD patients without clinical MND, as well as comparisons between cortical and subcortical regions with lower motor neurons (to elucidate the possible metabolic relations between upper and lower motor neurons), are expected to strengthen the current results.
Bulbar-onset ALS is a prognostic factor associated with short survival (28). Here, we instead showed that the metabolic uptake of the medulla oblongata was significantly associated with short survival (Fig. 5). This finding supports the hypothesis that neuroinflammation of midbrain structures is one of the main mechanisms involved in ALS progression, highlighting a potential role for neurometabolic studies as prognostic and outcome predictors. Moreover, a previous study (17) reported a significant relationship between the whole-spinal-cord–normalized uptake value and patient survival; thus, it will be necessary to compare the metabolic patterns of these 2 regions to draw consistent evidence.
CONCLUSION
This study analyzed the brain metabolism of ALS/FTD patients through PET/MRI and demonstrated that bulbar uptake could be a strong survival predictor. Notwithstanding the limited sample size and the retrospective design, we confirmed the presence of increased glucose metabolism in the midbrain/pons and medulla oblongata, supporting the importance of neuroinflammation in the pathogenesis of the disease spectrum. Considering the present need for reliable diagnostic and prognostic biomarkers in ALS and FTD, our results support PET neuroimaging as one of the most promising candidates for this role, although the cost and expertise required pose a barrier to the translation of this technology to clinical practice. A further step will be to design longitudinal studies involving large cohorts of age-matched patients—individuals with ALS-mimics and healthy controls—to assess the early predictive value of PET imaging, understand the neuroradiologic course of the disease, and evaluate the effect of therapies. These studies will need to thoroughly indagate central nervous system metabolism and to relate metabolic patterns within different brain regions to disease genotype and phenotype, with particular regard to the differences between upper- and lower-motor-neuron involvement.
DISCLOSURE
No potential conflict of interest relevant to this article was reported.
KEY POINTS
QUESTION: Is there a significant increment in glucose metabolism in the midbrain/pons and medulla oblongata of ALS/FTD patients as compared with controls, and is it related to mortality rates?
PERTINENT FINDINGS: An increase in glucose metabolism in ALS/FTD patients, as compared with controls, was noted in all 3 regions under examination (midbrain/pons, medulla oblongata, and cervical spinal cord). The Kaplan–Meier analysis at 50 mo after PET/MRI showed that the patients with normalized medulla oblongata uptake above the fifth decile had a significantly higher mortality rate than those below the fifth decile (log-rank test, P < 0.001).
IMPLICATIONS FOR PATIENT CARE: Considering the present need for reliable diagnostic and prognostic biomarkers in ALS and FTD, our results support PET neuroimaging of the medulla oblongata as one of the most promising candidates for this role.
Footnotes
Published online Sep. 9, 2021.
- © 2022 by the Society of Nuclear Medicine and Molecular Imaging.
REFERENCES
- Received for publication March 3, 2021.
- Revision received August 11, 2021.


