


Visual Abstract

Abstract
We assessed image quality using a practical and time-efficient protocol for intravenous glucose loading and insulin injection before administration of 18F-FDG for PET myocardial viability evaluation in patients with ischemic cardiomyopathy (ICM), with and without type 2 diabetes mellitus. Methods: The metabolic preparation period (MPP) or optimal cardiac 18F-FDG uptake was determined from the time of intravenous infusion of 12.5 or 25 g of 50% dextrose to the time of 18F-FDG injection. Cardiac 18F-FDG image quality was evaluated according to a 5-point scoring system (from 5, excellent, to 1, nondiagnostic) by 2 independent observers. In cases of disagreement, consensus was achieved in a joint reading. Fifteen patients with ICM who underwent oral glucose loading and intravenous insulin administration served as a reference for MPP comparisons. Results: Fifty-nine consecutive patients (age, 63 ± 10 y; 48 men and 11 women) underwent rest 99mTc-tetrofosmin SPECT/CT and 18F-FDG PET/CT for the evaluation of myocardial viability. 18F-FDG image quality was scored as excellent in 42%, very good in 36%, good in 17%, fair in 3%, and nondiagnostic in 2%. When diabetic and nondiabetic patients were compared, the quality scores were excellent in 29% versus 76%, very good in 41% versus 18%, good in 24% versus 6%, fair in 4% versus 0%, and nondiagnostic in 2% versus 0%. The mean (±SD) quality score was 4.12 ± 0.95, and overall it was better in nondiabetic than in diabetic patients (4.71 ± 0.59 vs. 3.88 ± 0.96; P < 0.0001). Notably, the average MPP was significantly less with intravenous glucose loading than with oral glucose loading (51 ± 15 min vs. 132 ± 29 min; P < 0.0001), paralleled by higher insulin doses (6.3 ± 2.2 U vs. 2.0 ± 1.69 U; P < 0.001). Conclusion: Using a practical and time-efficient protocol for intravenous glucose loading and insulin administration before 18F-FDG injection reduces the MPP by 61% as compared with an oral glucose challenge and affords good-to-excellent image quality in 95% of ICM patients.
Numerous clinical investigations (1) have documented that, in patients with ischemic cardiomyopathy (ICM), timely coronary revascularization to restore myocardial perfusion of ischemic, jeopardized viable myocardium improves heart failure symptoms and prognosis. 18F-FDG PET and 99mTc SPECT afford high diagnostic accuracy for the detection and characterization of a perfusion–metabolism mismatch (2,3). Myocardium exhibiting this pattern in conjunction with segmental severe hypokinesis or akinesis is commonly referred to as hibernating myocardium and has a high probability of regaining myocardial contractility with timely revascularization (1,3,4). Accurate assessment of the extent and severity of the perfusion–metabolism mismatch is critical to define those ICM patients in whom early restoration of coronary blood flow will improve left ventricular function and cardiovascular outcome (5,6).
Although 18F-FDG PET is the most sensitive imaging method for detecting viable, hibernating myocardium, the procedure commonly necessitates a tedious, time-consuming protocol of glucose loading and insulin administration to achieve the myocardial 18F-FDG uptake that optimizes diagnostic accuracy (7). Particularly in diabetic patients, frequent blood glucose monitoring and supplemental insulin administration may lead to a significant delay in PET image acquisition and, thus, logistical problems in a busy clinical PET facility (7). Several protocols of glucose loading with insulin administration have been proposed for 18F-FDG PET myocardial viability assessment in routine clinical practice (7). In this study, we evaluated a practical and time-efficient intravenous glucose loading and insulin administration protocol and assessed the quality of cardiac 18F-FDG PET images for viability assessment in diabetic and nondiabetic patients with ICM.
MATERIALS AND METHODS
Study Population
The study population consisted of 59 patients with ICM who underwent 99mTc-tetrofosmin SPECT/CT followed by intravenous glucose loading and insulin injection before 18F-FDG PET/CT (Table 1). The patients were referred for the evaluation of myocardial viability between September 2018 and July 2020. In addition, a group of 15 consecutive patients with ICM (56 ± 8 y old, 12 men and 3 women, 13 with diabetes and 2 without) underwent the same imaging protocol but with oral glucose loading and intravenous insulin administration (7), between March 2016 and September 2018. The Washington University institutional review board approved this retrospective study and waived the requirement for informed consent.
Patient and Study Characteristics
Cardiac SPECT/CT and PET/CT are described in detail in the supplemental materials (available at http://jnm.snmjournals.org).
Metabolic Preparation Protocol
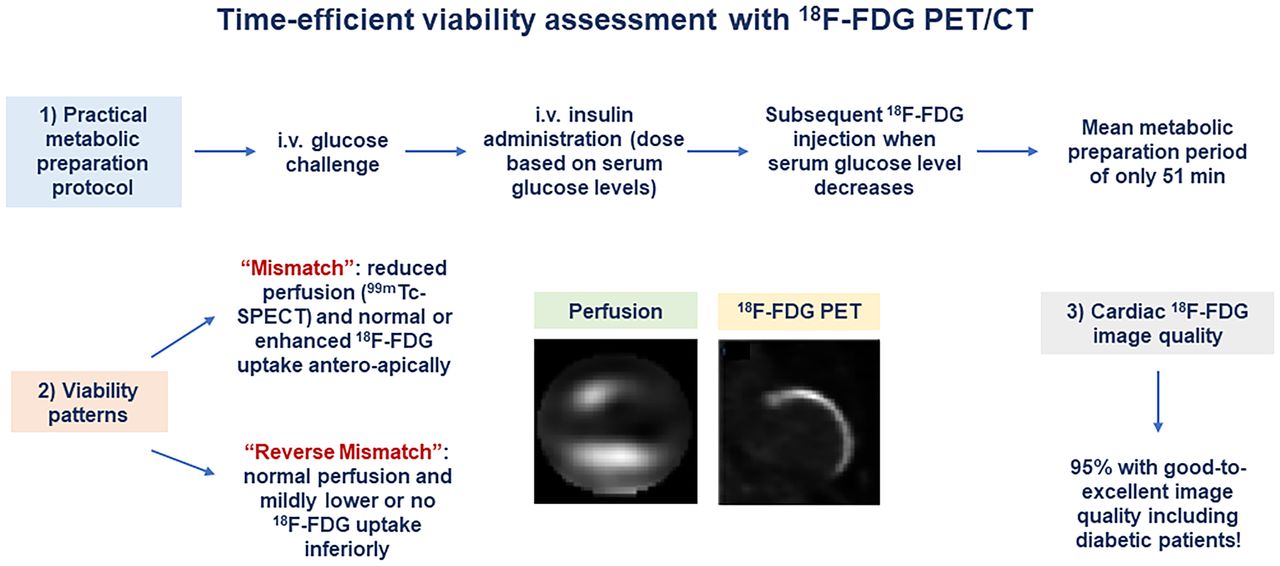
Patients on oral antidiabetic medication or an insulin regimen were classified as patients with known and treated diabetes mellitus (n = 39). Patients without antidiabetic medication but with elevated fasting blood glucose levels (≥125 mg/dL) at the time of the PET study were also assigned to the diabetic group (n = 3) (Table 1). The metabolic preparation period (MPP) was defined as the period between intravenous infusion of 12.5 or 25 g of 50% dextrose in 50 mL of water and 18F-FDG injection. All patients were studied after an overnight fast. The metabolic preparation protocol was performed by a highly skilled nurse in a dedicated preparation room, and patients were moved and positioned in the PET/CT scanner about 10 min before the scan was started. However, blood glucose levels were measured at baseline at the start of the MPP (Fig. 1). When baseline serum glucose levels were less than 125 mg/dL, 25 g of 50% dextrose in 50 mL of water were slowly infused intravenously, whereas when baseline serum glucose were 125–140 mg/dL, only 12.5 g of 50% dextrose in 50 mL of water were slowly infused intravenously. Postchallenge serum glucose levels were measured after a 20-min interval to capture the peak of the serum glucose increase for optimal dosing of insulin administration. If the serum glucose after the glucose challenge was between 140 and 180 mg/dL, insulin was administered intravenously according to the insulin protocol shown in Table 2, followed immediately by intravenous injection of approximately 370 MBq of 18F-FDG. In this lower range of postchallenge serum glucose levels, insulin sensitivity can be assumed sufficient to lead to a marked decrease in serum glucose levels on insulin administration and to effectively drive the 18F-FDG into the myocardium. In the rare case of a patient without an appropriate decline in serum glucose by at least 20 mg/dL, an additional 1–2 U of insulin were injected intravenously to stimulate an appropriate drop in serum glucose and, thus, cardiac 18F-FDG uptake (Fig. 1).

Schematic illustration of metabolic preparation protocol based on initial serum glucose levels. i.v. = intravenous.
Insulin Dose in Response to Glucose Challenge After Intravenous Infusion of 25 g or 12.5 g of 50% Dextrose in 50 mL of Water in Nondiabetic and Diabetic Patients, Respectively
If the serum glucose after the glucose challenge was at least 180 mg/dL (Fig. 1), insulin was administered intravenously according to the insulin protocol (Table 2) and serum glucose was remeasured 10 min later. The short 10-min interval was chosen because the aim was to verify that insulin had effectively initiated a reduction in postchallenge serum glucose levels and, thus, in effectiveness for driving the 18F-FDG into the myocardium. If the serum glucose declined by at least 20 mg/dL, approximately 370 MBq of 18F-FDG were injected immediately. If the decline in serum glucose was less than 20 mg/dL, another 2–3 U of insulin were administered and serum glucose was measured again after another 10 min. If serum glucose had then declined by at least 20 mg/dL, approximately 370 MBq of 18F-FDG were injected. In diabetic patients arriving with a baseline serum glucose of 150 mg/dL or higher (Fig. 1), no glucose challenge was performed and intravenous insulin was administered according to the insulin protocol (Table 2). If, after 10 min, the serum glucose had then declined by at least 20 mg/dL, approximately 370 MBq of 18F-FDG were injected. If the decline in serum glucose was less than 20 mg/dL, another 3 U of insulin were administered intravenously and serum glucose measured again after another 10 min. If serum glucose had then declined by at least 20 mg/dL, approximately 370 MBq of 18F-FDG were injected. After 18F-FDG injection, serum glucose was monitored every 15–20 min and before and after the 10-min PET/CT image acquisition. If a patient developed symptomatic or asymptomatic hypoglycemia (serum glucose <70 mg/dL) after receiving insulin, the protocol allowed for oral administration of 59–89 mL (2–3 oz) of orange juice to maintain normal blood glucose levels. However, if the orange juice was required within 30 min of the 18F-FDG cardiac uptake period, the study was discontinued since the 18F-FDG PET images were expected to be suboptimal. Patients on oral antidiabetic medication were instructed not to take it in the morning. Patients with insulin-dependent diabetes mellitus were asked to adhere to their regular diet and baseline insulin regimen the day before the study but to fast after midnight and to withhold insulin until the metabolic preparation of the 18F-FDG PET study was begun. If a diabetic patient developed symptomatic or asymptomatic hypoglycemia, because of the fasting state, appropriate food or juice intake at the discretion of the patient was allowed; however, this intake was followed by a 6-h fasting period before the start of the metabolic preparation or glucose challenge for the 18F-FDG PET examination.
Evaluation of SPECT and PET Images
On the reoriented short- and long-axis myocardial images and the corresponding polar maps, the relative distributions of 99mTc-tetrofosmin and 18F-FDG uptake were evaluated quantitatively using the standard American Heart Association–recommended 17-segment model and Corridor 4DM (Invia) software. As described previously, and consistent with the guidelines of the American Society of Nuclear Cardiology (7), myocardium with the highest 99mTc-tetrofosmin uptake on the rest perfusion images (5% of the sectors with the highest activity) was defined as 100% and served as a reference for normalization of regional 99mTc-tetrofosmin and 18F-FDG activity concentrations. Regional 99mTc-tetrofosmin activity concentrations in the rest images of the patients were compared with a reference database (Corridor 4DM). Corresponding 99mTc-tetrofosmin and 18F-FDG images were automatically scored quantitatively in all 17 segments by Corridor 4DM software. A 5-point scoring system was used to indicate segmental 99mTc-tetrofosmin and 18F-FDG uptake (0, normal; 1, mildly reduced; 2, moderately reduced; 3, severely reduced; and 4, absent). Myocardium was defined as normal (and therefore viable) when the 99mTc-tetrofosmin uptake on SPECT images yielded a score of 0, regardless of the 18F-FDG uptake on PET. A concordant reduction in 99mTc-tetrofosmin and 18F-FDG activity scores was classified as a perfusion–metabolism match, indicating nonviable myocardium. A reduction in 99mTc-tetrofosmin uptake more severe than the reduction in 18F-FDG uptake by at least 1 point was defined as a perfusion–metabolism mismatch, indicating viable myocardium. The total myocardial extent of match or mismatch patterns was determined as n/17, where n was the number of segments exhibiting match or mismatch (2).
Cardiac 18F-FDG PET Image Quality Analysis
The quality of 18F-FDG PET images was assessed visually by 2 independent experienced nuclear medicine physicians. Nine instances of minor disagreement were settled by a joint consensus reading. Cardiac 18F-FDG image quality was evaluated according to a 5-point scoring system (5, excellent; 4, very good; 3, good; 2, fair; and 1, nondiagnostic) (Fig. 2).

Myocardial 18F-FDG image quality was evaluated according to 5-point score system.
As resting ischemia may cause a disproportionate increase in 18F-FDG uptake in jeopardized but viable myocardium, likely related to an increase in glucose transporter receptor 4 and other yet unknown factors, the 18F-FDG uptake in the ischemic region may exceed that in the remote and normally perfused myocardium. In addition, this ischemic region with high 18F-FDG uptake then defines the 100% uptake that again leads to a relative downscaling of 18F-FDG signal in the remote nonischemic myocardium. Apart from the intensity of the homogeneous or heterogeneous myocardial 18F-FDG uptake, the residual 18F-FDG blood activity served as a second evaluation criterion. Accordingly, excellent image quality (score 5) was defined as homogeneous or heterogeneous 18F-FDG signal and no blood-pool activity; very good image quality (score 4), as homogeneous or heterogeneous 18F-FDG signal and mild blood-pool activity; good image quality (score 3), as homogeneous or heterogeneous 18F-FDG signal and moderate blood-pool activity; fair image quality (score 2), as homogeneous or heterogeneous 18F-FDG signal and high blood-pool activity; and nondiagnostic image quality (score 1), as low or no homogenous or heterogenous 18F-FDG signal and high blood-pool activity. In addition, the absolute counts of the left ventricular 18F-FDG uptake were automatically displayed for the left anterior descending, left circumflex, and right coronary artery distributions on the polar map analysis, and the averaged value of the left ventricle was calculated.
Statistical Analysis
Data are presented as mean ± SD for quantitative variables and as absolute frequencies for qualitative variables. The appropriate Wilcoxon rank test for independent or paired samples was used. The different groups were compared by 1-way ANOVA, followed by Scheffé multiple-comparison tests. Statistical significance was assumed if a null hypothesis could be rejected at a P value of less than 0.05. All statistical analyses were performed with SPSS 22.0 (IBM) for Microsoft Windows.
RESULTS
Clinical and Study Characteristics
The characteristics of the study population are given in Table 1. Coronary angiography revealed coronary lesions in all patients, defined as at least a 50% narrowing of an epicardial artery (1 vessel in 9 patients [15%], 2 in 15 [25%], and 3 in 43 [73%]). Serum glucose levels at baseline and the dose of insulin were significantly higher in diabetic than in nondiabetic patients, whereas serum glucose levels after the intravenous glucose challenge did not differ significantly between groups (Table 1). Interestingly, when compared with the group with oral glucose loading, both the groups and the subgroups of diabetic and nondiabetic patients with intravenous glucose loading showed no significant difference in baseline serum glucose levels (P = 0.06), whereas peak serum glucose levels after the glucose challenge were significantly less with oral than with intravenous glucose loading both in the groups and in the subgroups (P ≤ 0.05) (Table 1). Accordingly, the dose of intravenous insulin was also significantly less in the group with oral glucose loading than in the group with intravenous glucose loading (P < 0.0001) (Table 1). For the whole study group with intravenous glucose loading, the MPP averaged 51 ± 15 min and did not differ between diabetic and nondiabetic patients (51 ± 16 and 50 ± 14 min, respectively) (Table 1). However, in the group with oral glucose loading, the mean MMP was significantly longer than in the intravenous glucose loading group (132 ± 29 vs. 51 ± 15 min, P < 0.0001) and in the subgroups of diabetic and nondiabetic patients (141 ± 31 vs. 51 ± 16 min and 122 ± 28 vs. 50 ± 14 min, respectively; P < 0.0001).
With the intravenous glucose protocol, administration of a small amount of orange juice was necessary in 11 patients (19%) whose serum glucose levels decreased below 70 mg/dL (Table 3), whereas this was not necessary for the group receiving oral glucose loading. Nine of the patients in the intravenous glucose cohort developed hypoglycemia that did not become symptomatic, likely because of timely administration of orange juice to restore normal blood glucose levels. Two patients had hypoglycemia with minor symptoms—such as dizziness, headache, or sweating—that were resolved immediately by administration of orange juice (Table 3).
Hypoglycemia and Adverse Side Effects of Intravenous Insulin Administration in Response to Intravenous Glucose Challenge in Nondiabetic and Diabetic Patients, Respectively
Imaging Results and Quality Assessment
Combined 99mTc-SPECT and 18F-FDG PET demonstrated ischemic, compromised, but predominantly viable myocardium in most patients (75%; n = 44) with ICM (Figs. 3 and 4; Supplemental Figs. 1 and 2 with quantitative polar map display). Of the 59 patients who were studied, standard quantitative polar map analysis showed perfusion–metabolic mismatches (viable myocardium) in 44 (75%), and 15 (25%) had perfusion–metabolic matches (nonviable myocardium). Both mismatches and matches coexisted in 26 patients (44%). For the whole study population, the total mismatch score in viable myocardium was 17 ± 9. When evaluated in relation to arterial territory, the regional mismatch score was 8 ± 5 for the left anterior descending coronary artery distribution, 5 ± 4 for the left circumflex coronary artery distribution, and 4 ± 3 for the right coronary artery distribution. Regarding myocardial 18F-FDG image quality assessment, the mean quality score in the study population was 4.12 ± 0.95, and overall it was better in nondiabetic than in diabetic patients (4.71 ± 0.59 vs. 3.88 ± 0.96; P ≤ 0.0001). For the total study population, myocardial 18F-FDG PET images were scored as excellent in 42% (n = 25), very good in 36% (n = 21), good in 17% (n = 10), fair in 3% (n = 2), and nondiagnostic in 2% (n = 1) (Fig. 5). Comparing diabetic and nondiabetic patients, the quality scores were excellent in 29% (n = 12) versus 76% (n = 13), very good in 41% (n = 17) versus 18% (n = 3), good in 24% (n = 10) versus 6% (n = 1), fair in 4% (n = 2) versus 0% (n = 0), and nondiagnostic in 2% (n = 1) versus 0% (n = 0) (Fig. 4B). Thus, the most diagnostic 18F-FDG image quality in diabetic patients was very good, at 41%, and in nondiabetic patients it was predominantly excellent, at 76%. Notably, there was a significant and progressive decrease in the left ventricular absolute count statistics of 18F-FDG uptake on polar map analysis from excellent 18F-FDG uptake scores to very good, good, fair, and nondiagnostic (score 5, 21,671 ± 7,802; score 4, 13,652 ± 7,430; score 3, 7,281 ± 2,734; score 2, 3,847 ± 56; and score 1, 2,121 counts [P < 0.0001 by ANOVA]).

Distribution of myocardial 18F-FDG image quality scores in whole study population (left) and when subgrouped and compared between those with diabetes mellitus (DM) and those without (right).

Rest myocardial perfusion 99mTc-tetrofosmin SPECT/CT images demonstrating match with 18F-FDG PET/CT images in patient with ICM. 99mTc-SPECT/CT shows severe perfusion defect in inferior and inferolateral walls, with mild extension inferoseptally and laterally, and PET shows predominant absence of 18F-FDG uptake. Thus, findings match, with concordant absence of perfusion and viability to signify predominantly transmural necrosis in left circumflex and right coronary artery distribution.

Rest myocardial perfusion 99mTc-tetrofosmin SPECT/CT images demonstrating mismatch with 18F-FDG PET/CT images in patient with dilated ICM. SPECT/CT shows severe perfusion defect in predominantly akinetic anteroseptoapical, apical, and anterolateral walls, whereas PET shows normal or upregulated 18F-FDG uptake, consistent with hibernating myocardium. Given the disproportionately high 18F-FDG uptake in mismatch regions (reflecting 100% reference for signal normalization), some remaining myocardium demonstrates mildly lower or no 18F-FDG signal (e.g., inferoseptal and inferior wall segments, respectively) associated with normal rest perfusion (reverse mismatch), indicating viability in these segments.
DISCUSSION
The current study is unique in demonstrating a practical and time-efficient protocol for intravenous glucose loading and insulin injection before intravenous 18F-FDG injection that affords good-to-excellent image quality in 95% of patients with ICM. Notably, the 18F-FDG image quality with our protocol is in keeping with the findings of previous studies (2,5,6,8,9) and is maintained despite our shortened metabolic preparation protocol, even in diabetic patients, as compared with oral glucose loading.
Although myocardial 18F-FDG PET may be considered the reference standard among cardiac imaging modalities for the detection of viability in dysfunctional myocardium (3,4,10), the metabolic preparation protocol for this test needed to achieve optimal myocardial 18F-FDG uptake, and thus, image quality is commonly quite complex and time-consuming (7). It is well known that, in fasting nondiabetic subjects, 40%–60% of myocardial 18F-FDG PET scans may be uninterpretable because of low radiotracer uptake and significant regional heterogeneity, reflecting predominant reliance of the heart on free fatty acids as a source of energy (7,11). In this respect, oral or intravenous glucose loading has been used to stimulate endogenous insulin release to enhance the myocardial uptake of glucose and, thus, of 18F-FDG. Standard protocols have typically involved oral administration of 50–100 g of dextrose solution to fasting patients followed by intravenous injection of 18F-FDG intravenously 60–90 min later (7). However, oral glucose administration without insulin injection yielded poor cardiac image quality in 2%–33% of patients, including nondiabetic patients (12,13). With intravenous administration of insulin for elevated serum glucose levels after oral glucose loading, the rate of poor image quality could be substantially reduced to 8%–15% (14,15). One important limitation of oral glucose loading is the long MPP because of a large proportion of patients with undiagnosed impaired glucose tolerance or insulin resistance, as well as a variability in the rate of intestinal glucose absorption (7,15). The MPP of oral glucose loading with insulin administration may therefore be 120–160 min. The current approach with intravenous glucose loading and insulin administration had an average MPP of approximately only 51 min as compared with approximately 132 min when we used oral glucose loading with subsequent insulin administration. The substantially shorter MPP with intravenous glucose loading likely is related to a markedly higher serum glucose peak with subsequently higher insulin dose administration, as compared with oral glucose loading, which is commonly associated with delayed and variable intestinal glucose absorption and a substantially lower glucose peak necessitating lower insulin doses. Higher peak glucose levels with intravenous glucose loading not only necessitate a substantially higher dose of insulin but also stimulate greater endogenous release of insulin from pancreatic β-cells. Thus, the blood insulin levels can be assumed to be much higher than those achieved with oral glucose loading; this, in turn, will lead to greater myocardial 18F-FDG uptake, resulting in good-to-excellent image quality in most patients. Further, the metabolic preparation time did not differ between diabetic and nondiabetic patients with intravenous glucose loading, likely related to the significantly higher insulin doses applied in diabetic patients after a glucose challenge.
This practical and time-efficient MPP offers the advantage that the injection and myocardial uptake of 18F-FDG are occurring when the effect of insulin likely is maximal. Similar protocols have recommended delaying 18F-FDG injection until the serum glucose level decreases below 125–140 mg/dL after insulin injection (7). This, however, necessitates repeat assessments of serum glucose and carries the risk of missing the maximal insulin effect required to drive the 18F-FDG into the myocardium, resulting in suboptimal image quality. When compared with protocols using oral glucose loading, the advantage of the proposed protocol with an average MPP of 51 min is the ability to better plan the timing of the PET scan while maintaining diagnostic image quality even in diabetic patients. After 18F-FDG injection, we typically aimed for 60- and 90-min cardiac uptake periods in nondiabetic and diabetic patients, respectively. The average 18F-FDG uptake period in the whole study population was 82 min (86 min in diabetic patients and 74 min in nondiabetic patients). The difference from our planned goals reflects the scanner availability in routine clinical practice.
Our protocol allowed administering orange juice orally after an 18F-FDG uptake period of at least 30 min if serum glucose levels decreased below 70 mg/dL after insulin administration. This was necessary in 11 (19%) of our patients, and 2 of these had symptoms, which were mild and resolved immediately after ingestion of orange juice. The fact that none of the patients had severe side effects emphasizes the safety profile of the proposed protocol despite administration of higher insulin doses than with an oral glucose challenge.
CONCLUSION
A clinically practical and time-efficient protocol for intravenous glucose loading and insulin injection before 18F-FDG injection reduces the MPP by 61% as compared with an oral glucose challenge. The intravenous protocol is safe and affords good-to-excellent diagnostic image quality in 95% of patients with ICM. This protocol holds promise to improve the application and efficacy of 18F-FDG PET–determined myocardial viability in routine clinical practice.
DISCLOSURE
This work was supported by a departmental fund from Washington University. No other potential conflict of interest relevant to this article was reported.
KEY POINTS
QUESTION: Is it feasible to apply a practical and time-efficient protocol for intravenous glucose loading and insulin injection before 18F-FDG injection, while maintaining safety and the diagnostic quality of myocardial 18F-FDG PET images?
PERTINENT FINDINGS: The shortened metabolic preparation protocol with intravenous glucose loading, insulin injection, and 18F-FDG injection consistently yielded good-to-excellent diagnostic image quality even in diabetic patients with ICM.
IMPLICATIONS FOR PATIENT CARE: The suggested protocol is safe, practical, and should enhance the clinical application and cost-effectiveness of 18F-FDG PET for the detection and characterization of viable myocardium.
ACKNOWLEDGMENTS
We are indebted to Lisa Konrad, Martin Schmitt, and the technical staff of the Division of Nuclear Medicine for their technical assistance and support.
Footnotes
Published online September 09, 2021.
- © 2022 by the Society of Nuclear Medicine and Molecular Imaging.
REFERENCES
- Received for publication April 12, 2021.
- Revision received August 13, 2021.
In this issue


Jump to section
Related Articles
Cited By...
- No citing articles found.