
Main menu

  • Home
  • Content
    • Current
    • Ahead of print
    • Past Issues
    • JNM Supplement
    • SNMMI Annual Meeting Abstracts
    • Continuing Education
    • JNM Podcasts
  • Subscriptions
    • Subscribers
    • Institutional and Non-member
    • Rates
    • Journal Claims
    • Corporate & Special Sales
  • Authors
    • Submit to JNM
    • Information for Authors
    • Assignment of Copyright
    • AQARA requirements
  • Info
    • Reviewers
    • Permissions
    • Advertisers
  • About
    • About Us
    • Editorial Board
    • Contact Information
  • More
    • Alerts
    • Feedback
    • Help
    • SNMMI Journals
  • SNMMI
    • JNM
    • JNMT
    • SNMMI Journals
    • SNMMI

User menu

  • Subscribe
  • My alerts
  • Log in
  • Log out
  • My Cart

Search

  • Advanced search
Journal of Nuclear Medicine
  • SNMMI
    • JNM
    • JNMT
    • SNMMI Journals
    • SNMMI
  • Subscribe
  • My alerts
  • Log in
  • Log out
  • My Cart
Journal of Nuclear Medicine

Advanced Search

  • Home
  • Content
    • Current
    • Ahead of print
    • Past Issues
    • JNM Supplement
    • SNMMI Annual Meeting Abstracts
    • Continuing Education
    • JNM Podcasts
  • Subscriptions
    • Subscribers
    • Institutional and Non-member
    • Rates
    • Journal Claims
    • Corporate & Special Sales
  • Authors
    • Submit to JNM
    • Information for Authors
    • Assignment of Copyright
    • AQARA requirements
  • Info
    • Reviewers
    • Permissions
    • Advertisers
  • About
    • About Us
    • Editorial Board
    • Contact Information
  • More
    • Alerts
    • Feedback
    • Help
    • SNMMI Journals
  • View or Listen to JNM Podcast
  • Visit JNM on Facebook
  • Join JNM on LinkedIn
  • Follow JNM on Twitter
  • Subscribe to our RSS feeds
Research ArticleClinical (Cardiovascular)
Open Access

Sex Differences and Caffeine Impact in Adenosine-Induced Hyperemia

Martin Lyngby Lassen, Christina Byrne, Majid Sheykhzade, Mads Wissenberg, Preetee Kapisha Hurry, Anne Vibeke Schmedes, Andreas Kjaer and Philip Hasbak
Journal of Nuclear Medicine March 2022, 63 (3) 431-437; DOI: https://doi.org/10.2967/jnumed.121.261970
Martin Lyngby Lassen
1Department of Clinical Physiology, Nuclear Medicine and PET and Cluster for Molecular Imaging, Rigshospitalet and University of Copenhagen, Copenhagen, Denmark;
  • Find this author on Google Scholar
  • Find this author on PubMed
  • Search for this author on this site
Christina Byrne
1Department of Clinical Physiology, Nuclear Medicine and PET and Cluster for Molecular Imaging, Rigshospitalet and University of Copenhagen, Copenhagen, Denmark;
  • Find this author on Google Scholar
  • Find this author on PubMed
  • Search for this author on this site
Majid Sheykhzade
2Department of Drug Design and Pharmacology, Faculty of Health and Medical Sciences, University of Copenhagen, Copenhagen, Denmark;
  • Find this author on Google Scholar
  • Find this author on PubMed
  • Search for this author on this site
Mads Wissenberg
3Department of Cardiology, Copenhagen University Hospital, Gentofte, Denmark; and
  • Find this author on Google Scholar
  • Find this author on PubMed
  • Search for this author on this site
Preetee Kapisha Hurry
1Department of Clinical Physiology, Nuclear Medicine and PET and Cluster for Molecular Imaging, Rigshospitalet and University of Copenhagen, Copenhagen, Denmark;
  • Find this author on Google Scholar
  • Find this author on PubMed
  • Search for this author on this site
Anne Vibeke Schmedes
4Department of Biochemistry and Immunology, Lillebaelt Hospital, Vejle, Denmark
  • Find this author on Google Scholar
  • Find this author on PubMed
  • Search for this author on this site
Andreas Kjaer
1Department of Clinical Physiology, Nuclear Medicine and PET and Cluster for Molecular Imaging, Rigshospitalet and University of Copenhagen, Copenhagen, Denmark;
  • Find this author on Google Scholar
  • Find this author on PubMed
  • Search for this author on this site
Philip Hasbak
1Department of Clinical Physiology, Nuclear Medicine and PET and Cluster for Molecular Imaging, Rigshospitalet and University of Copenhagen, Copenhagen, Denmark;
  • Find this author on Google Scholar
  • Find this author on PubMed
  • Search for this author on this site
  • Article
  • Figures & Data
  • Info & Metrics
  • PDF
Loading

Article Figures & Data

Figures

  • Tables
  • Figure
    • Download figure
    • Open in new tab
    • Download powerpoint
  • FIGURE 1.
    • Download figure
    • Open in new tab
    • Download powerpoint
    FIGURE 1.

    Imaging protocol. (A) Acquisition protocol for each of the 4 PET/CT imaging sessions. Both rest and stress scans were acquired over 6 min. (B) Study protocol for the 40 healthy volunteers. CTAC = computed tomographic attenuation correction.

  • FIGURE 2.
    • Download figure
    • Open in new tab
    • Download powerpoint
    FIGURE 2.

    Rest MBF obtained in the volunteers sorted by sex and plasma caffeine concentration with and without RPP correction. W = women; M = men; RPP = rate pressure product; N = number of MPI sessions fulfilling the criteria.

  • FIGURE 3.
    • Download figure
    • Open in new tab
    • Download powerpoint
    FIGURE 3.

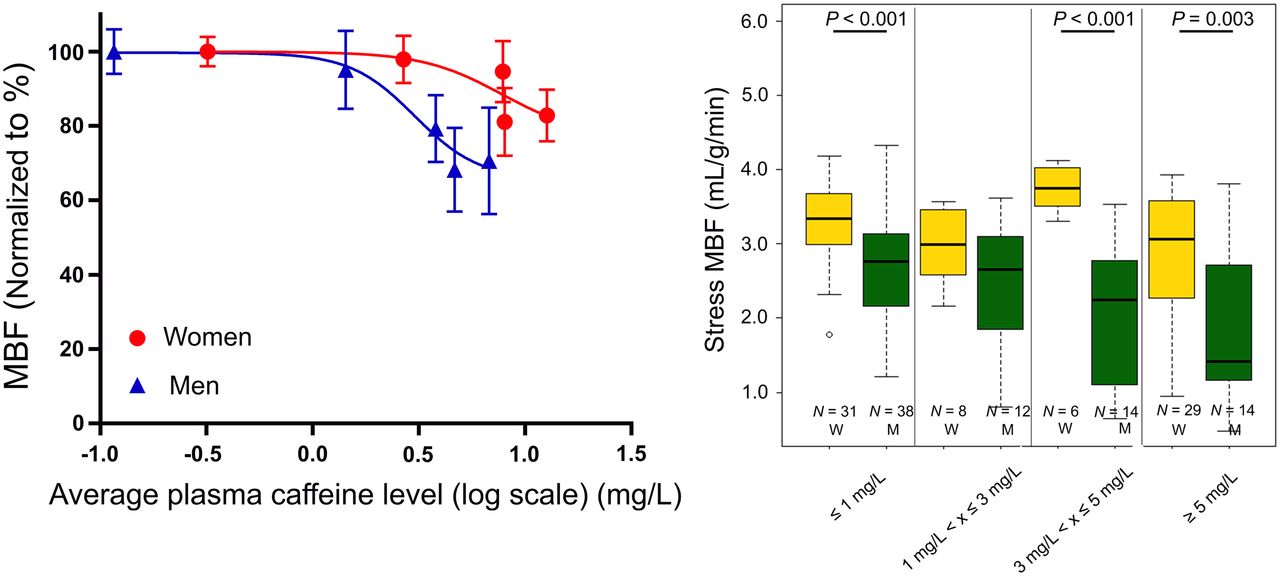
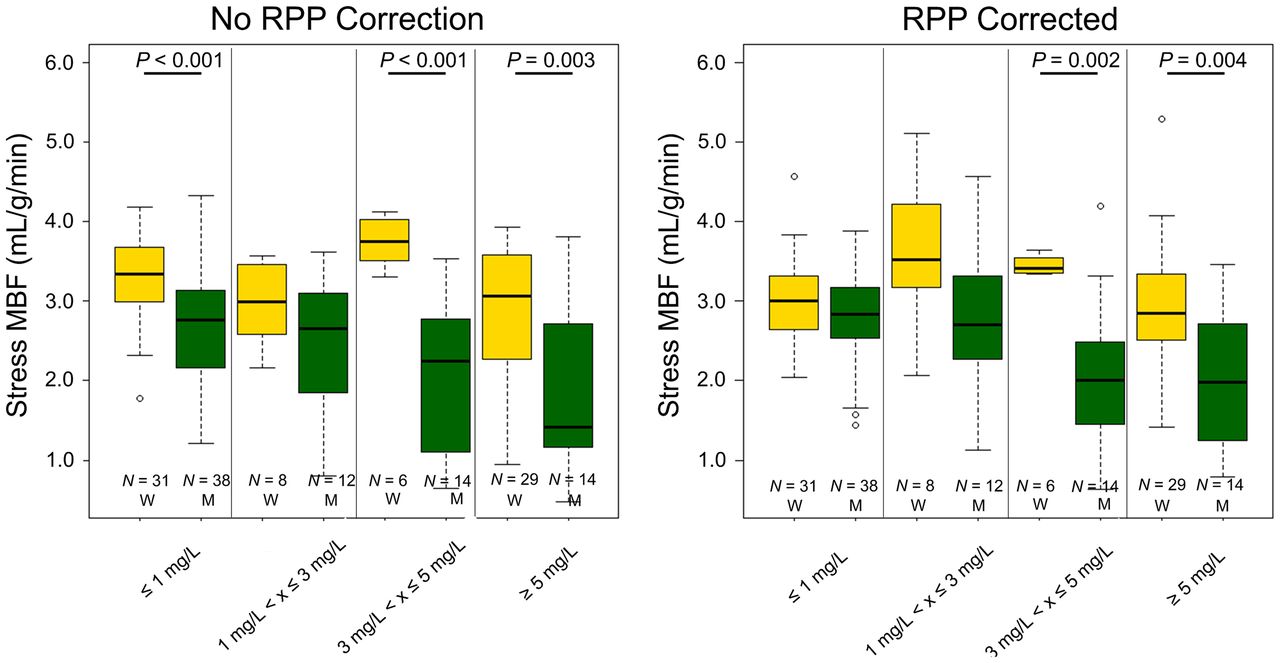
    Stress MBF obtained in the volunteers sorted by sex and plasma caffeine concentration, with and without RPP correction. W = women; M = men; RPP = rate pressure product; N = number of MPI sessions fulfilling the criteria.

  • FIGURE 4.
    • Download figure
    • Open in new tab
    • Download powerpoint
    FIGURE 4.

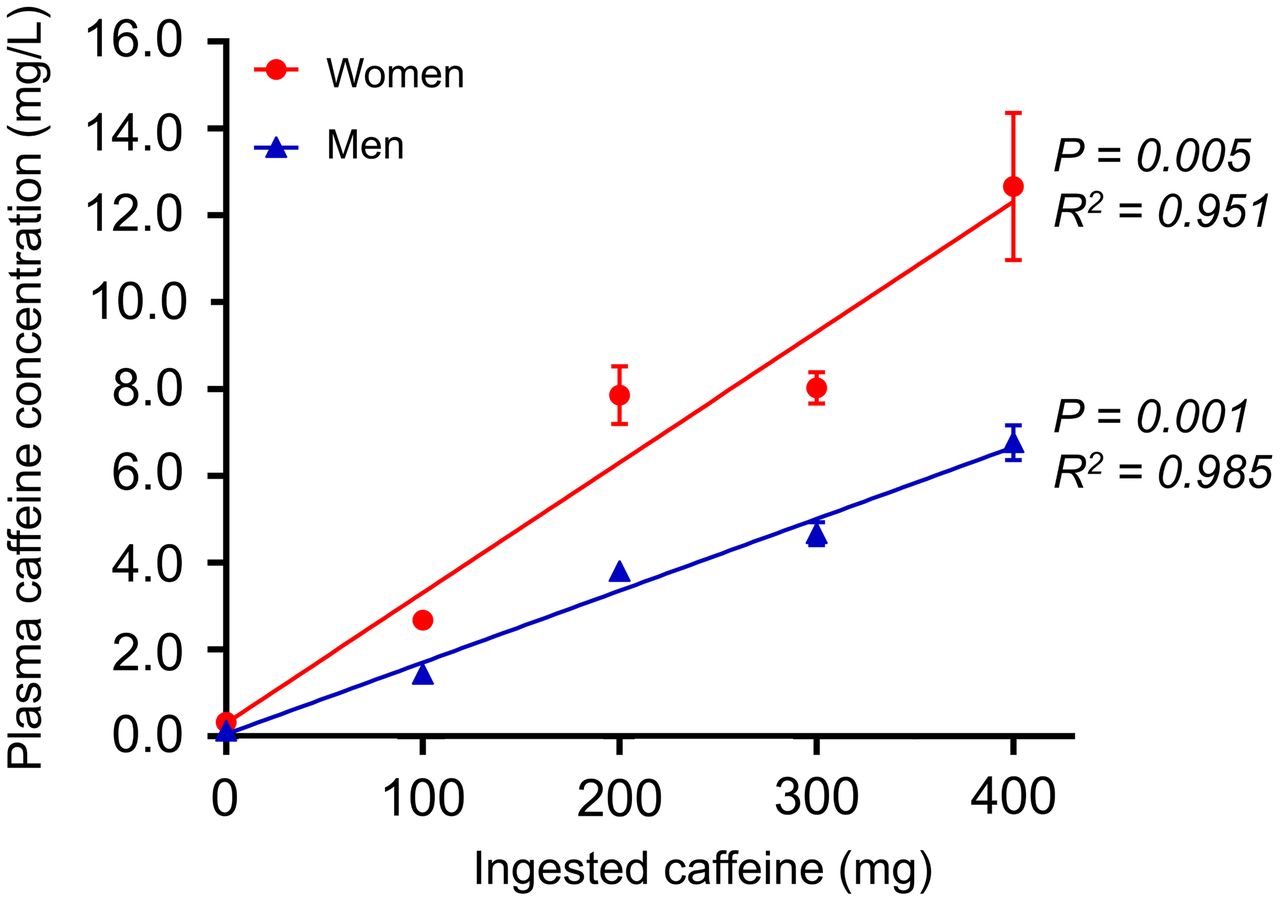
    Relationship between ingested caffeine (mg) and the corresponding plasma caffeine concentrations (mg/L). The plasma caffeine concentrations obtained at 75 and 90 min are given as mean ± SEM in both men (closed blue triangles, n = 9–20) and women (closed red circles, n = 9–18).

  • FIGURE 5.
    • Download figure
    • Open in new tab
    • Download powerpoint
    FIGURE 5.

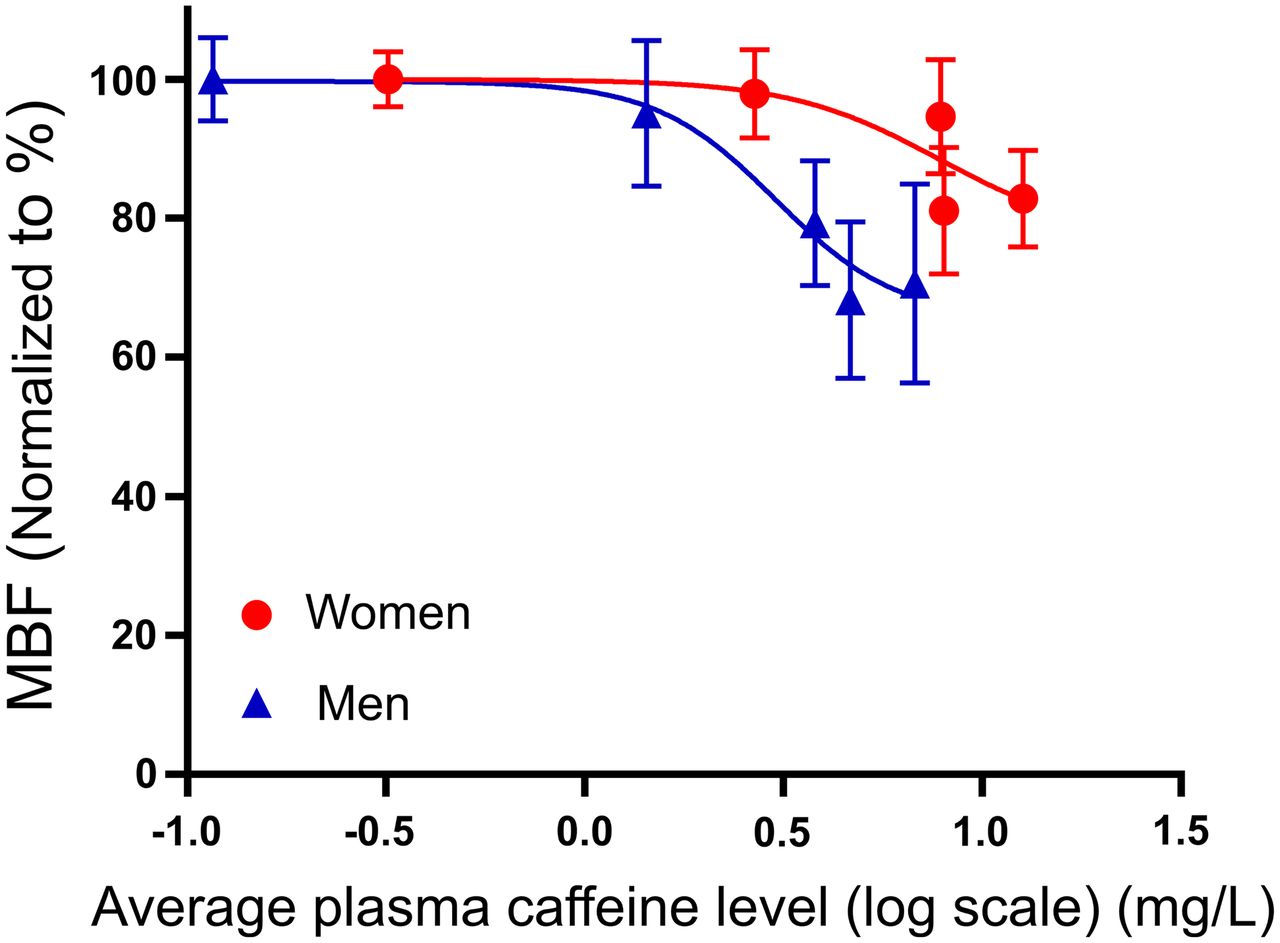
    Relationship between average plasma concentration of caffeine [mg/L] (log) and stress MBF. Points represent mean values, and vertical lines indicate SEM. MBF values were normalized to the maximum stress MBF obtained for the individual volunteers (men, closed blue triangles, n = 9–20, and women, closed red circles, n = 9–18, respectively).
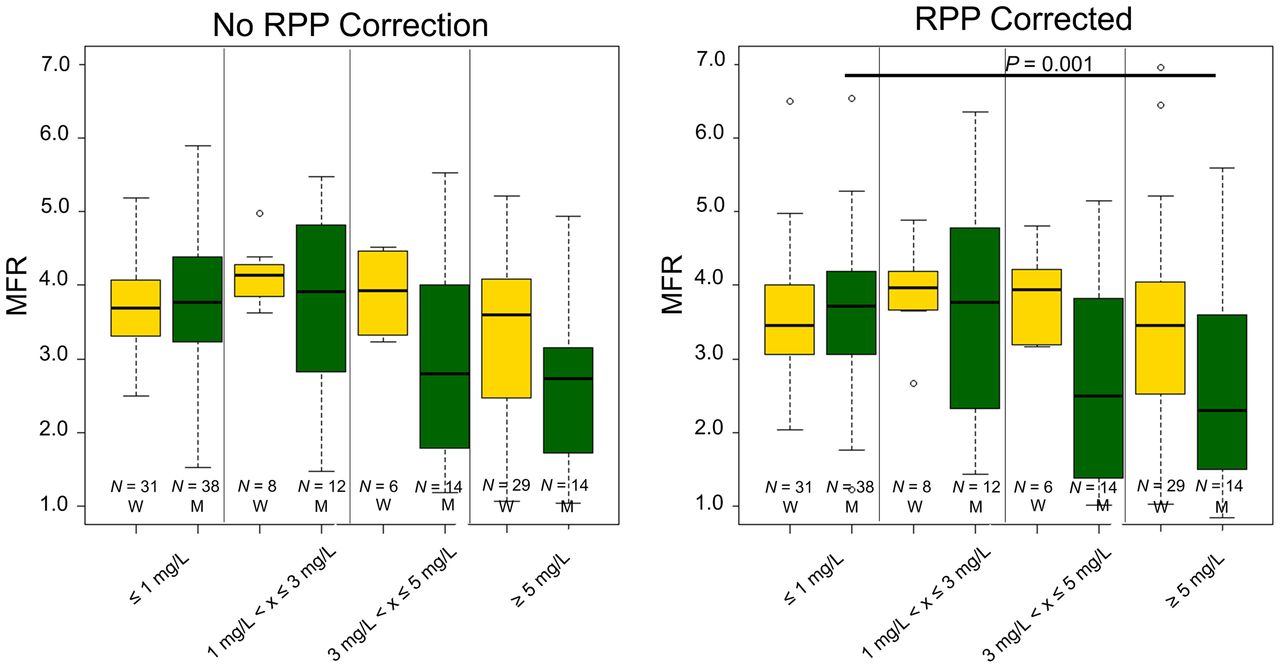
  • FIGURE 6.
    • Download figure
    • Open in new tab
    • Download powerpoint
    FIGURE 6.

    MFR obtained in the volunteers sorted by sex and plasma caffeine levels. W = women; M = men; RPP = rate pressure product; N = number of MPI sessions fulfilling the criteria.

Tables

  • Figures
    • View popup
    TABLE 1.

    Heart Rate (Beats per Minute) Obtained During Scans Using 4 Levels of Plasma Caffeine Concentration

    Plasma caffeine concentration (mg/L)
    PCC≤11 < x ≤ 33 < x ≤ 5>5
    Rest
     Women62.4 ± 10.8 (31)51.4 ± 7.3* (31)68.0 ± 14.3 (6)60.9 ± 10.6 (29)
     Men60.2 ± 13.0 (38)53.8 ± 12.1 (12)55.7 ± 9.0† (14)60.1 ± 9.3 (14)
    Stress
     Women92.5 ± 14.479.3 ± 23.6*91.5 ± 9.778.2 ± 15.2*
     Men80.9 ± 19.7†73.3 ± 18.874.4 ± 15.8†70.6 ± 13.2
    • * Significant variations in the heart rate between the baseline scans (plasma caffeine concentration < 1 mg/L) and studies with increased plasma caffeine concentrations.

    • ↵†Intersex differences in the heart rate observed for the respective plasma caffeine concentrations.

    • Numbers given in parentheses for the rest scans indicate the number of MPI sessions fulfilling the criteria. Differences were considered significant for P < 0.05.

    • PCC = plasma caffeine concentration.

    • View popup
    TABLE 2.

    Test–Retest Repeatability (Measured as Coefficient of Variation) for Baseline MPI Sessions (0 mg of Caffeine Ingested)

    Coefficient of variationRestStressMFR
    Women (n = 19)13.5%10.6%12.9%
    Men (n = 20)16.1%18.4%20.6%
    Combined (n = 39)15.8%15.3%17.8%
    • No differences in test–retest repeatability was observed between the 2 sexes.

    • View popup
    TABLE 3.

    Diastolic Blood Pressure Obtained During Scans Using 4 Levels of Plasma Caffeine Concentration

    Plasma caffeine concentration (mg/L)
    PCC≤11 < x ≤ 33 < x ≤ 5>5
    Rest
     Women60.9 ± 6.5 (31)62.3 ± 4.6 (8)60.5 ± 8.3 (6)64.2 ± 6.4 (29)
     Men57.9 ± 9.1 (38)61.2 ± 7.3 (12)60.4 ± 5.7 (14)62.2 ± 5.7 (14)
    Stress
     Women60.8 ± 9.068.4 ± 10.260.4 ± 5.766.3 ± 8.8*
     Men54.7 ± 9.0†61.0 ± 9.8*58.7 ± 8.159.5 ± 6.8†
    • * Significant variations in the diastolic blood pressure between the baseline scans (plasma caffeine concentration < 1 mg/L) and studies with increased plasma caffeine concentrations.

    • ↵†Intersex differences in the diastolic blood pressure observed for the respective plasma caffeine concentrations.

    • Numbers given in parentheses for the rest scans indicate the number of MPI sessions fulfilling the criteria. Differences were considered significant for P < 0.05.

    • PCC = plasma caffeine concentration.

    • View popup
    TABLE 4.

    Systolic Blood Pressure Obtained During Scans Using 4 Plasma Caffeine Concentration

    Plasma caffeine concentration (mg/L)
    PCC≤11 < x ≤ 33 < x ≤ 5>5
    Rest
     Women102.6 ± 9.9 (31)103.9 ± 8.1 (8)99.2 ± 17.3 (6)108.7 ± 13.6 (29)
     Men108.9 ± 10.7 (38)112.6 ± 10.0 (12)112.5 ± 10.7 (14)114.9 ± 9.3 (14)
    Stress
     Women92.5 ± 14.496.5 ± 17.7102.3 ± 6.4105.9 ± 12.3
     Men107.0 ± 12.7†110.6 ± 13.5112.1 ± 10.1†111.5 ± 12.1
    • * Within-sex variations in the systolic blood pressure between the baseline scans (plasma caffeine concentration < 1 mg/L) and studies with increased plasma caffeine concentrations.

    • ↵†Intersex differences in the systolic blood pressure observed for the respective plasma caffeine concentrations.

    • Numbers given in parentheses for the rest scans indicate the number of MPI sessions fulfilling the criteria. Differences were considered significant for P < 0.05.

    • PCC = plasma caffeine concentration.

    • View popup
    TABLE 5.

    RPP Stratified for the 2 Sexes at 4 Levels of Plasma Caffeine Concentration

    Plasma caffeine concentration (mg/L)
    PCC≤11 < x ≤ 33 < x ≤ 5>5
    Rest
     Women6,422 ± 1,381 (31)5,329 ± 797* (8)6,626 ± 1,253 (6)6,627 ± 1,475 (29)
     Men6,504 ± 1,381 (38)6,100 ± 1,739 (12)6,429 ± 1,075 (14)6,786 ± 1,447 (14)
    Stress
     Women9,624 ± 2,0137,480 ± 2,093*9,328 ± 7028,333 ± 2,105*
     Men8,742 ± 2,3508,208 ± 2,7578,279 ± 1,6667,770 ± 1,703
    • * Sex-specific differences between the baseline scan (0 mg) and the respective plasma caffeine concentrations.

    • Numbers given in parentheses for the rest scans indicate the number of MPI sessions fulfilling the criteria. Differences were considered significant for P < 0.05.

    • PCC = plasma caffeine concentration.

    • View popup
    TABLE 6.

    CVR Obtained for Rest and Stress Using 4 Levels of Plasma Caffeine Concentration

    Plasma caffeine concentration (mg/L)
    PCC≤11 < x ≤ 33 < x ≤ 5>5
    Rest
     Women82.9 ± 19.4 (31)85.7 ± 16.8 (8)77.0 ± 18.5 (6)92.6 ± 21.1 (29)
     Men105.5 ± 30.7* (38)101.3 ± 26.5 (12)102.1 ± 27.6 (14)152.9 ± 25.9*† (14)
    Stress
     Women25.8 ± 5.923.0 ± 7.221.8 ± 1.423.6 ± 8.8
     Men27.5 ± 8.233.0 ± 15.245.2 ± 25.6*†51.8 ± 14.8*†
    • * Significant differences for men and women.

    • †Sex-specific differences between the baseline scan (0 mg) and the respective plasma caffeine concentrations.

    • Numbers given in parentheses for the rest scans indicate the number of MPI sessions fulfilling the criteria. Differences were considered significant for P < 0.05.

    • PCC = plasma caffeine concentration.

PreviousNext
Back to top

In this issue

Journal of Nuclear Medicine: 63 (3)
Journal of Nuclear Medicine
Vol. 63, Issue 3
March 1, 2022
  • Table of Contents
  • Table of Contents (PDF)
  • About the Cover
  • Index by author
  • Complete Issue (PDF)
Print
Download PDF
Article Alerts
Sign In to Email Alerts with your Email Address
Email Article

Thank you for your interest in spreading the word on Journal of Nuclear Medicine.

NOTE: We only request your email address so that the person you are recommending the page to knows that you wanted them to see it, and that it is not junk mail. We do not capture any email address.

Enter multiple addresses on separate lines or separate them with commas.
Sex Differences and Caffeine Impact in Adenosine-Induced Hyperemia
(Your Name) has sent you a message from Journal of Nuclear Medicine
(Your Name) thought you would like to see the Journal of Nuclear Medicine web site.
Citation Tools
Sex Differences and Caffeine Impact in Adenosine-Induced Hyperemia
Martin Lyngby Lassen, Christina Byrne, Majid Sheykhzade, Mads Wissenberg, Preetee Kapisha Hurry, Anne Vibeke Schmedes, Andreas Kjaer, Philip Hasbak
Journal of Nuclear Medicine Mar 2022, 63 (3) 431-437; DOI: 10.2967/jnumed.121.261970

Citation Manager Formats

  • BibTeX
  • Bookends
  • EasyBib
  • EndNote (tagged)
  • EndNote 8 (xml)
  • Medlars
  • Mendeley
  • Papers
  • RefWorks Tagged
  • Ref Manager
  • RIS
  • Zotero
Share
Sex Differences and Caffeine Impact in Adenosine-Induced Hyperemia
Martin Lyngby Lassen, Christina Byrne, Majid Sheykhzade, Mads Wissenberg, Preetee Kapisha Hurry, Anne Vibeke Schmedes, Andreas Kjaer, Philip Hasbak
Journal of Nuclear Medicine Mar 2022, 63 (3) 431-437; DOI: 10.2967/jnumed.121.261970
Twitter logo Facebook logo LinkedIn logo Mendeley logo
  • Tweet Widget
  • Facebook Like
  • Google Plus One
Bookmark this article

Jump to section

  • Article
    • Visual Abstract
    • Abstract
    • MATERIALS AND METHODS
    • RESULTS
    • DISCUSSION
    • CONCLUSION
    • DISCLOSURE
    • Footnotes
    • REFERENCES
  • Figures & Data
  • Info & Metrics
  • PDF

Related Articles

  • No related articles found.
  • PubMed
  • Google Scholar

Cited By...

  • Positron Range Correction Helps Enhance the Image Quality of Cardiac 82Rb PET/CT
  • Google Scholar

More in this TOC Section

  • Impact of the ISCHEMIA Trial on Stress Nuclear Myocardial Perfusion Imaging
Show more Clinical (Cardiovascular)

Similar Articles

Keywords

  • caffeine
  • adenosine
  • Myocardial flow reserve
  • PET
  • stress myocardial blood flow
SNMMI

© 2025 SNMMI

Powered by HighWire