


Article Figures & Data
Figures
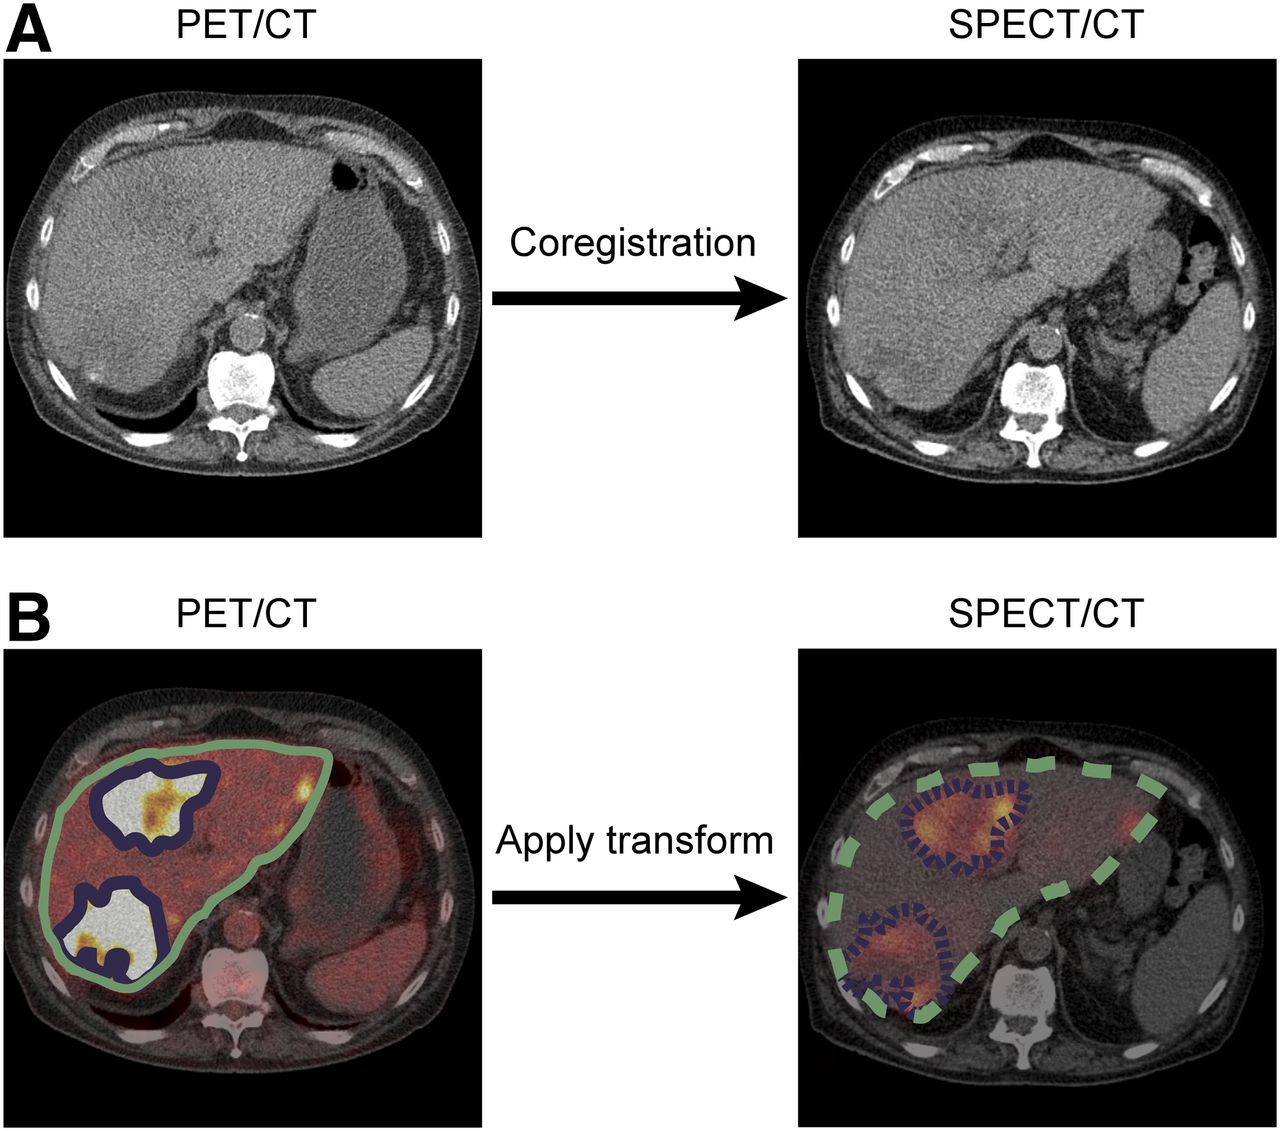
- FIGURE 1.
Example of tumor delineation and absorbed-dose estimation. (A) Using liver contour, low-dose CT of PET/CT was matched to low-dose CT of SPECT/CT. Tumors were automatically defined using threshold. (B) Liver and tumor contours were transferred from PET/CT to SPECT/CT, and absorbed doses were calculated.
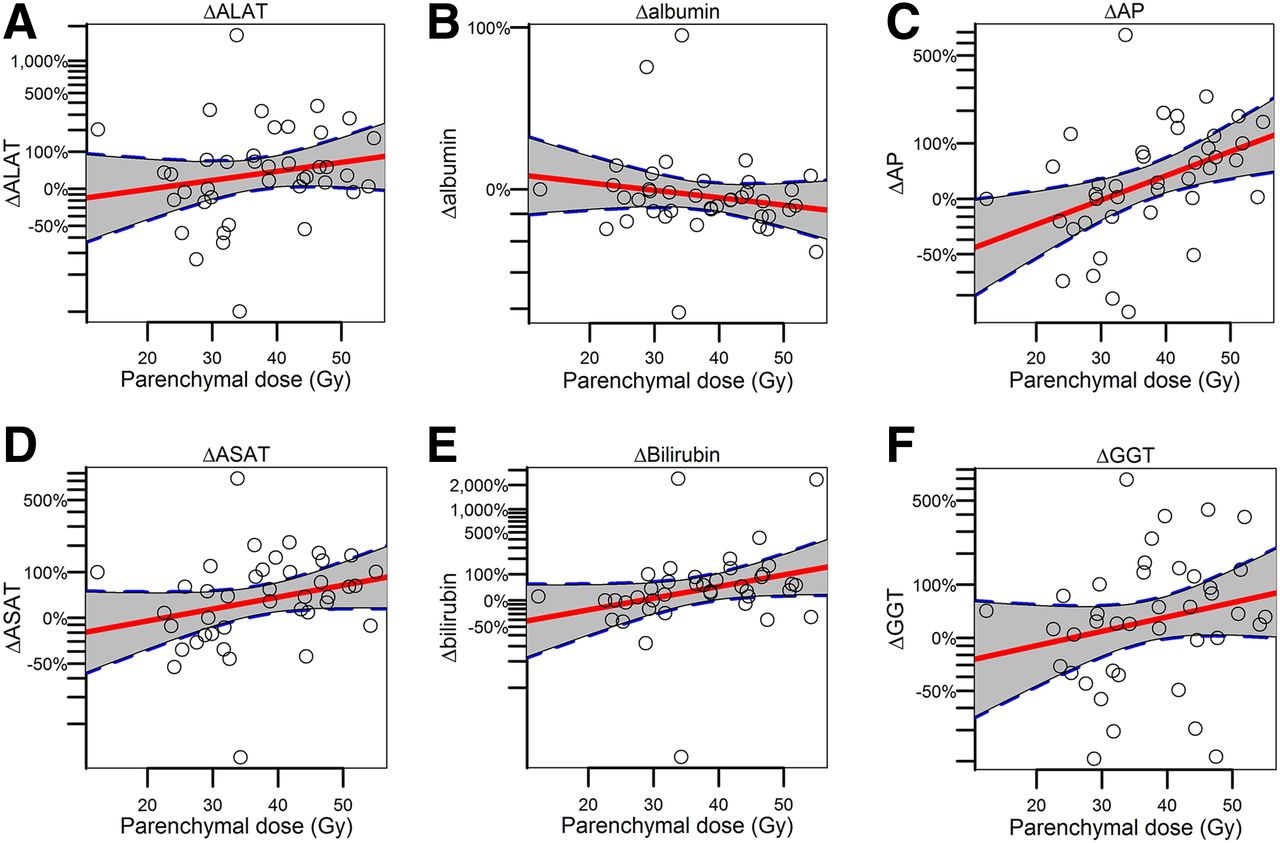
- FIGURE 2.
Association between change in laboratory parameters and parenchyma-absorbed dose. Red lines are regression lines, with 95% CIs indicated as surrounding gray areas. ALAT = alanine aminotransferase; AP = alkaline phosphatase; ASAT = aspartate aminotransferase; GGT = γ-glutamyltransferase.
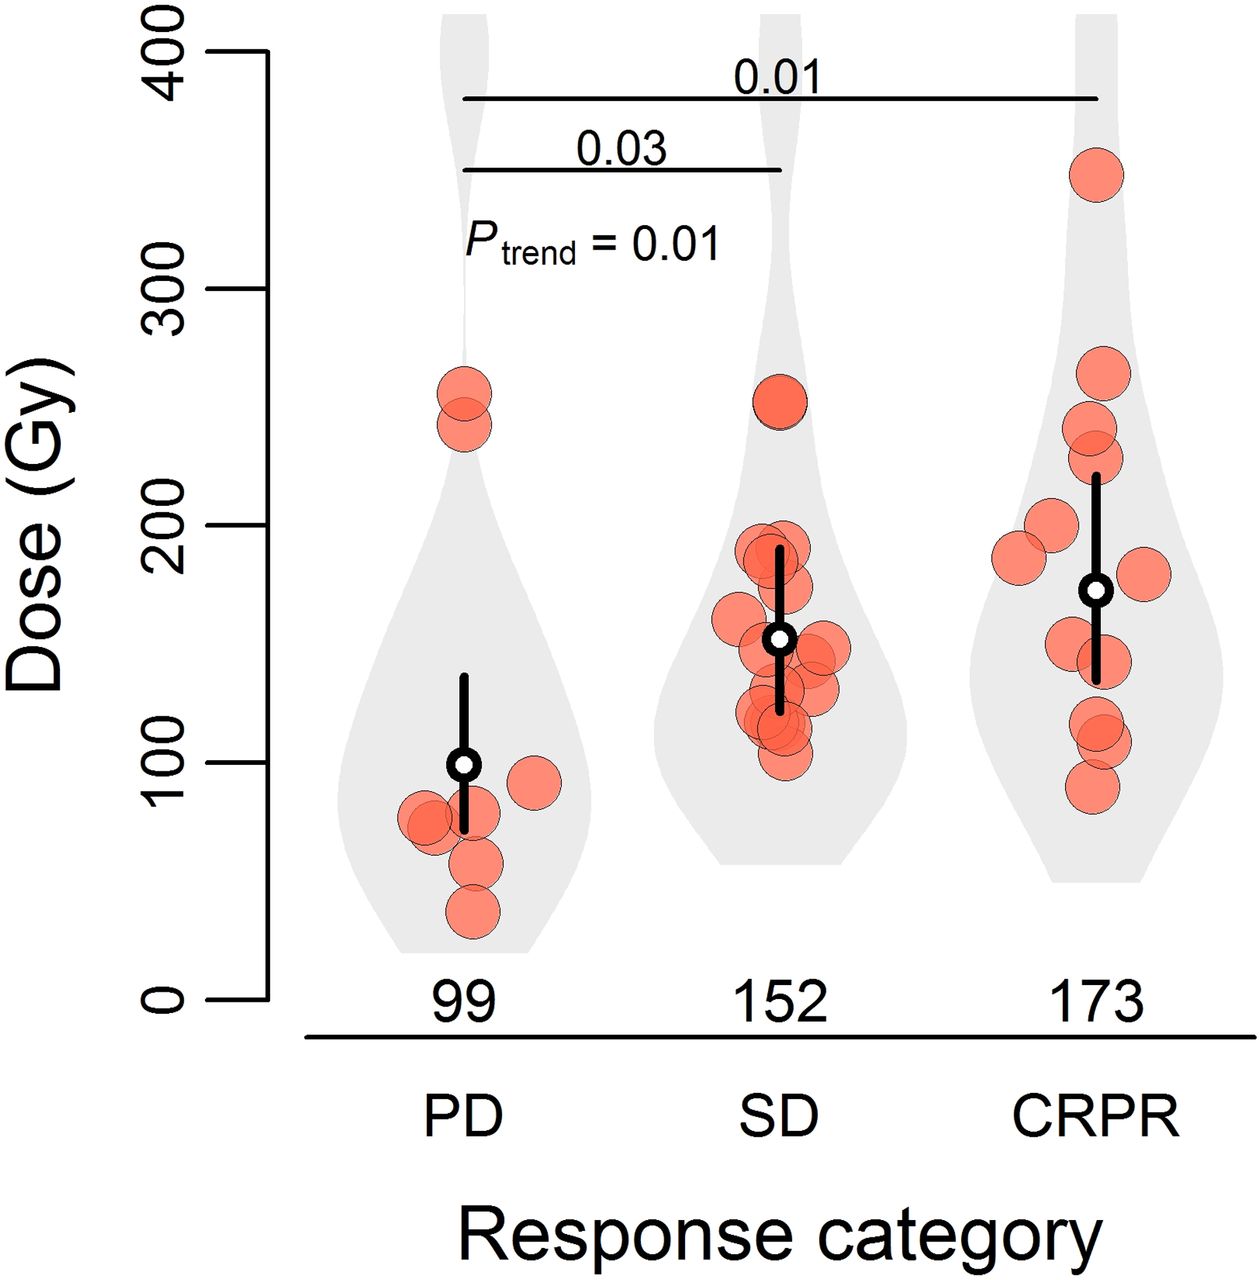
- FIGURE 3.
Relationship between mean tumor-absorbed dose per patient and metabolic response to treatment at 3-mo follow-up. Bullets show mean tumor-absorbed dose per patient. Black vertical lines are 95% CIs of mean doses per response category, with white dot in middle indicating mean tumor-absorbed dose per response category. This figure is based on unadjusted linear mixed-effects regression model as described in Table 3. CRPR = complete or partial response.
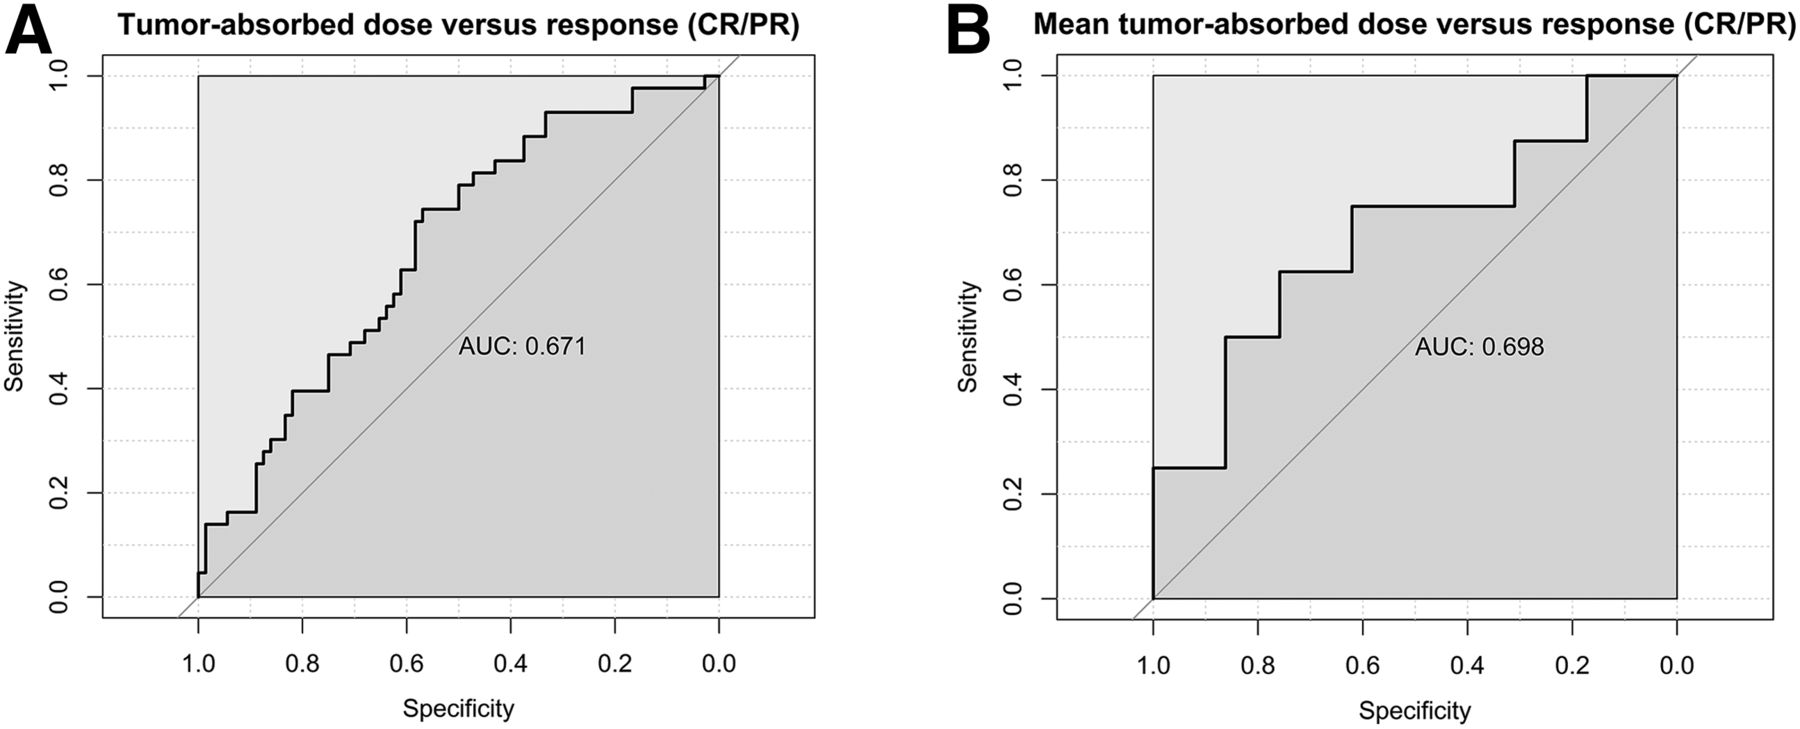
- FIGURE 4.
Receiver-operating-characteristic curve showing discriminative value of tumor-absorbed dose for response (A) and ability of mean tumor-absorbed dose per patient to discriminate between patients with CR or PR vs. stable disease or PD (B). AUCs are based on clustered data analysis; however, receiver-operating-characteristic curves are not.
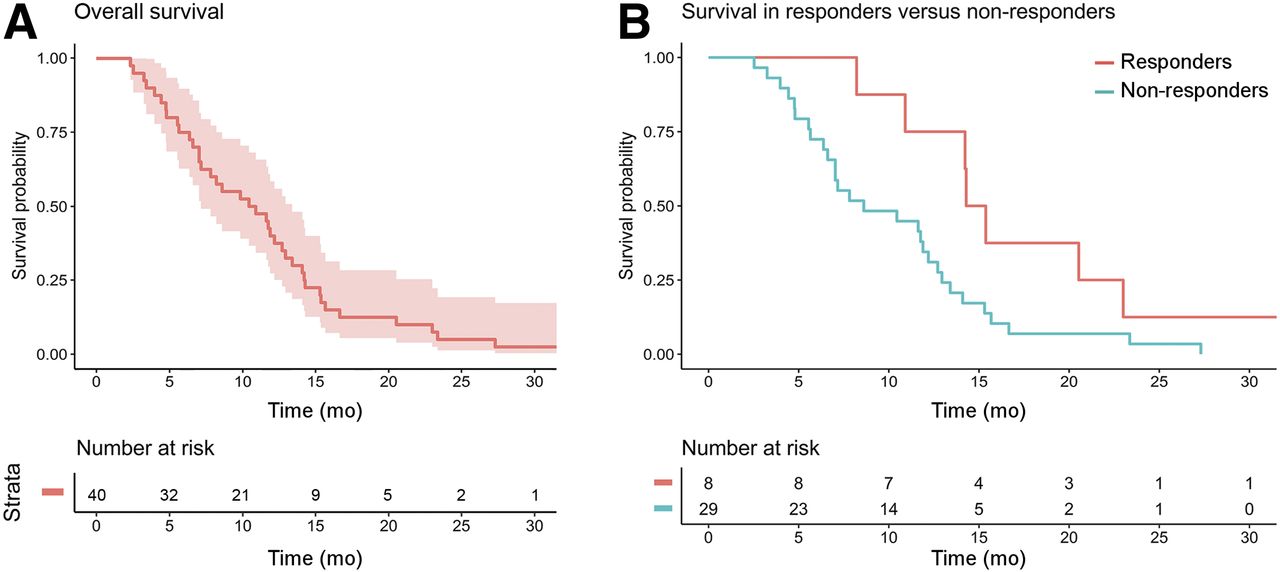
- FIGURES 5.
(A) Overall survival curve. (B) Survival curves for patients with and without metabolic response (including development of new lesions) at 3 mo.
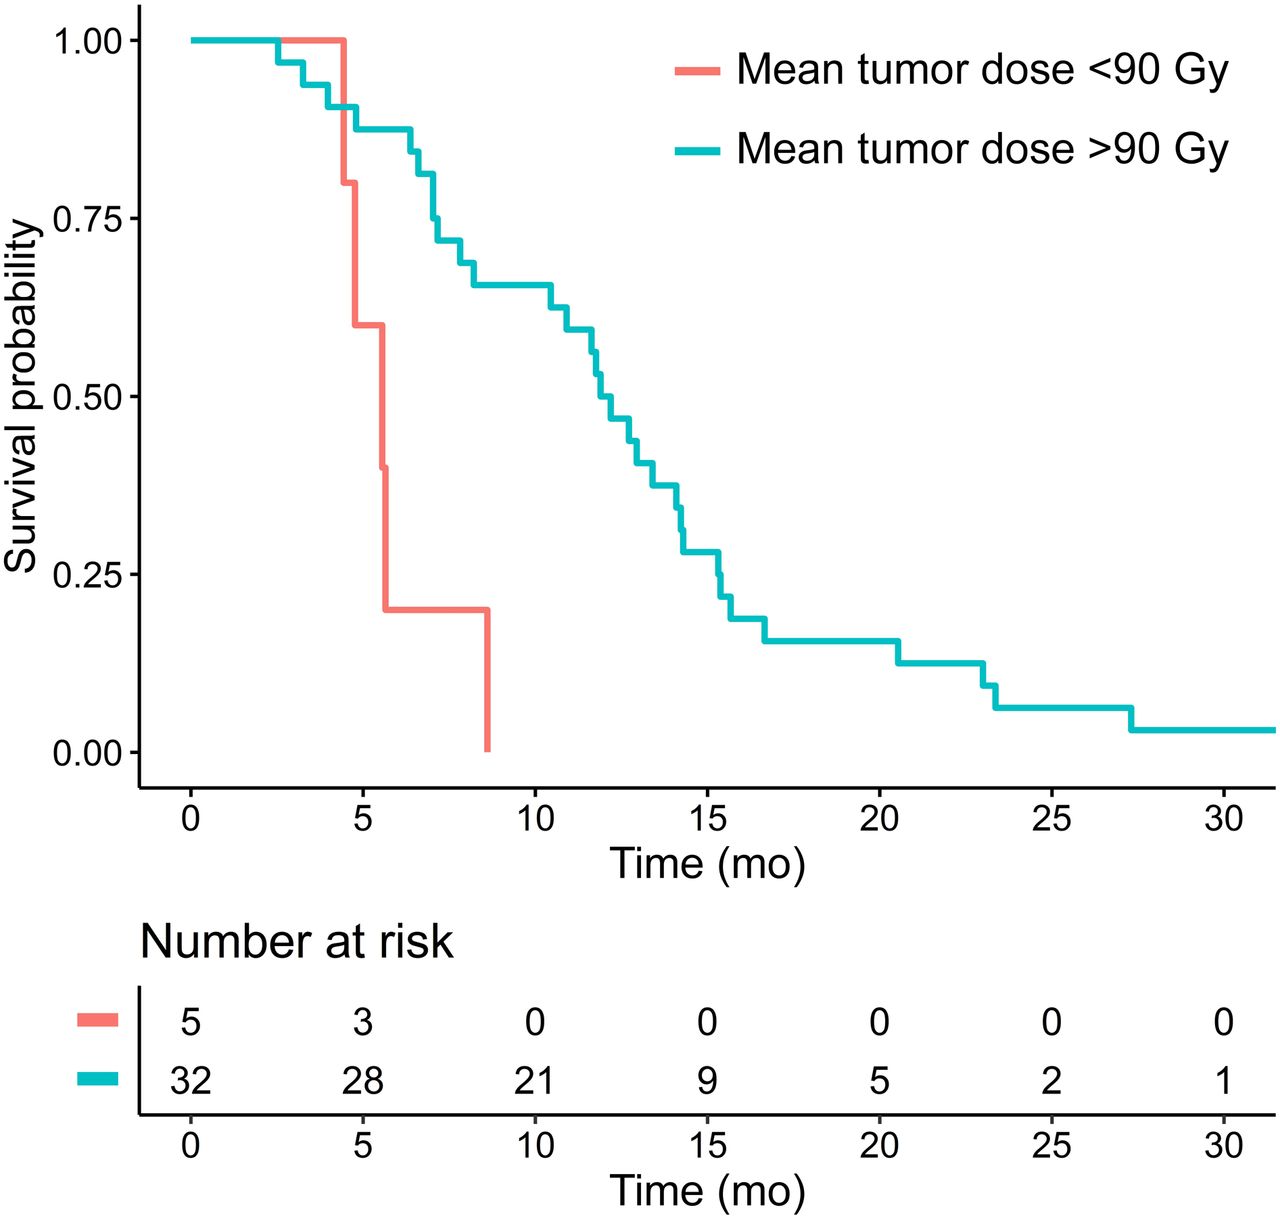
- FIGURE 6.
Survival curves for patients with higher (>90 Gy) or lower (<90 Gy) mean tumor-absorbed dose.


Tables
Characteristic Data Sex Male 25 (62.5) Female 15 (37.5) Age (y) 64 (37–84) World Health Organization performance score 0 28 (70) 1 11 (27.5) 2 1 (2.5) Previous locoregional (liver) therapy* External-beam radiation therapy 2 (5) Metastasectomy 5 (12.5) Radiofrequency ablation 3 (7.5) Lines of prior systemic treatment 1 8 (20) 2 20 (50) 3 7 (17.5) 4 5 (12.5) Extrahepatic disease before treatment Lymph node 10 (25) Lung 10 (25) No 23 (57.5) Liver volume (cm3) 1,987 (1,272–3,167) Metabolic tumor volume (cm3) 320 (26–1,446) Fractional tumor load 0.15 (0.01–0.49) Radioembolization treatment Whole-liver 39 (97.5) Lobar (right lobe only) 1 (2.5) Administered activity (MBq) 6,387 (3,822–12,386) ↵* No patient received synchronous systemic treatment.
Qualitative data are numbers and percentages; continuous data are median and range.
- TABLE 2
CTCAE Grading of New Clinical Toxicity per Patient During the 3 Months After Treatment
Toxicity CTCAE grade I CTCAE grade II CTCAE grade III CTCAE grade IV CTCAE grade V Abdominal pain 16 10 4 Nausea 15 9 2 Fatigue 21 10 2 Anorexia 10 5 Dyspnea 4 1 Fever 7 1 1 Ascites 1 2 Flulike symptoms 2 1 Malaise 4 1 Hepatic failure 1 1* Weight loss 2 Chest pain 1 2 Vomiting 9 5 Dyspepsia 1 1 Metal taste 3 Contrast allergy 1 2 Hematoma 1 Diarrhea 1 Constipation 4 Upper gastrointestinal tract bleeding 1 Limb edema 2 Dizziness 1 Chills 2 Any clinical toxicity 13 19 7 1 Lowered albumin 9 4 Elevated alanine aminotransferase 24 1 1 Elevated alkaline phosphatase 4 14 2 Elevated aspartate aminotransferase 28 2 Elevated bilirubin 2 1 2 Elevated γ-glutamyltransferase 5 15 5 Any laboratory toxicity 7 23 5 2 ↵* Radioembolization-induced liver disease.
Highest CTCAE grades per clinical symptom or laboratory value are represented.
Level PR Stable disease PR CR* P (trend) Patient level without new lesions n = 8 n = 17 n = 11 n = 1 Unadjusted Reference 53.8 (5.6–24.2) 74.6 (18.6–57.6) — 0.012 Adjusted† Reference 62.0 (10.4–136.0) 77.3 (18.3–163.6) — 0.019 Patient level with new lesions‡ n = 23 n = 6 n = 7 n = 1 Unadjusted Reference 29.8 (−15.1–98.6) 44.4 (1.4–106.0) — 0.041 Adjusted† Reference 18.7 (−24.3–85.4) 38.1 (−5.8–101.9) — 0.12 Tumor level n = 23 n = 49 n = 20 n = 23 Unadjusted Reference 31.1 (−3.2–78.8) 71.5 (17.1–150.4) 95.2 (34.7–183.6) 0.00030 Adjusted Reference 35.2 (0.2–87.5) 72.2 (16.6–151.3) 94.8 (33.9–188.4) 0.00068 ↵* As there was only 1 patient with complete metabolic response, categories CR and PR were taken together at patient level.
↵† Analyses were adjusted for previous treatment and tumor load or tumor volume (tumor-level analyses).
↵‡ In which case patients were categorized as having PR.
Data are in grays, with 95% CIs in parentheses. For interpretation at tumor level, average dose is 95.23% higher in CR than PD (95% CI, 4.69%–183.62%).
Supplemental Data
Files in this Data Supplement:


