


Article Figures & Data
Figures
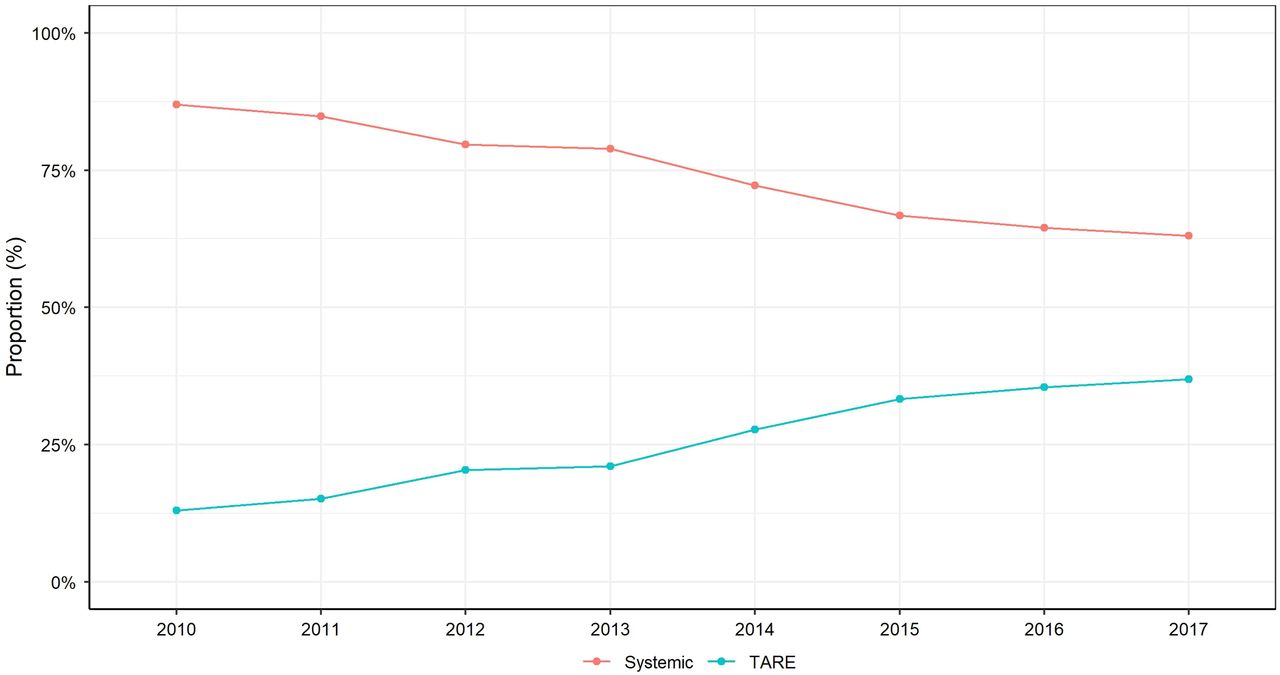
- FIGURE 1.
Proportion of patients who received TARE vs. systemic treatment for HCC with MVI between 2010 and 2017.
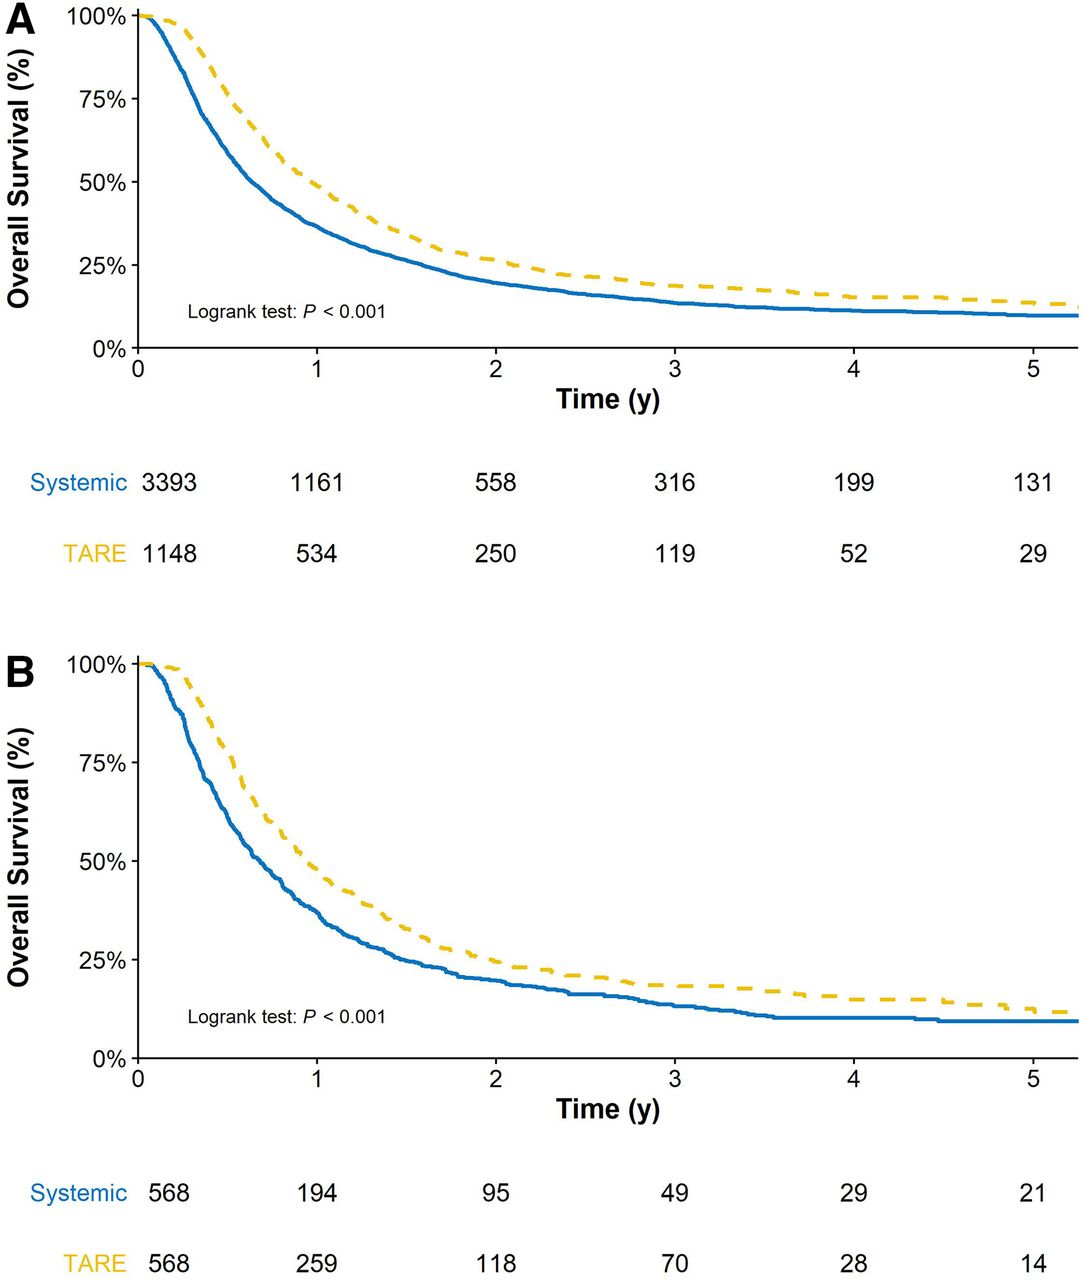
- FIGURE 2.
OS estimates of patients treated with TARE vs. systemic treatment before propensity score matching and after propensity score matching (B).
- FIGURE 3.
Comparison of survival in various subgroup of patients treated with TARE vs. systemic treatment. HSD = high school degree.


Tables
Before propensity score matching After propensity score matching Characteristic All (n = 5,369) Systemic (n = 3,915) TARE (n = 1,454) P All (n = 1,136) Systemic (n = 568) TARE (n = 568) P Demographics Age (y) 63.0 ± 9.73 62.6 ± 9.84 64.2 ± 9.33 <0.001 63.9 ± 9.13 63.7 ± 9.49 64.1 ± 8.75 0.420 Sex 0.720 0.880 Male 4,331 (80.7%) 3,153 (80.5%) 1,178 (81.0%) 917 (80.7%) 460 (81.0%) 457 (80.5%) Female 1,038 (19.3%) 762 (19.5%) 276 (19.0%) 219 (19.3%) 108 (19.0%) 111 (19.5%) Race <0.001 0.587 White 3,347 (64.0%) 2,356 (61.8%) 991 (70.0%) 781 (68.8%) 385 (67.8%) 396 (69.7%) Hispanic 536 (10.2%) 426 (11.2%) 110 (7.77%) 87 (7.66%) 47 (8.27%) 40 (7.04%) Black 851 (16.3%) 660 (17.3%) 191 (13.5%) 168 (14.8%) 81 (14.3%) 87 (15.3%) Asian + others 496 (9.48%) 373 (9.78%) 123 (8.69%) 100 (8.80%) 55 (9.68%) 45 (7.92%) Socioeconomic factors Insurance status <0.001 0.933 Uninsured 285 (5.42%) 247 (6.46%) 38 (2.65%) 39 (3.43%) 21 (3.70%) 18 (3.17%) Private 1,815 (34.5%) 1,319 (34.5%) 496 (34.5%) 392 (34.5%) 197 (34.7%) 195 (34.3%) Medicaid/Medicare 3,072 (58.4%) 2,209 (57.8%) 863 (60.1%) 683 (60.1%) 340 (59.9%) 343 (60.4%) Other 88 (1.67%) 49 (1.28%) 39 (2.72%) 22 (1.94%) 10 (1.76%) 12 (2.11%) Median income 0.025 0.716 <$40,227 1,168 (23.7%) 882 (24.5%) 286 (21.6%) 246 (21.7%) 125 (22.0%) 121 (21.3%) $40,227–$50,353 1,103 (22.4%) 825 (22.9%) 278 (21.0%) 268 (23.6%) 135 (23.8%) 133 (23.4%) $50,354–$63,332 1,113 (22.6%) 790 (21.9%) 323 (24.4%) 279 (24.6%) 145 (25.5%) 134 (23.6%) $63,333+ 1,540 (31.3%) 1,103 (30.6%) 437 (33.0%) 343 (30.2%) 163 (28.7%) 180 (31.7%) Without high school diploma 0.003 0.099 ≥17.6% 1,345 (27.3%) 1,023 (28.4%) 322 (24.3%) 269 (23.7%) 152 (26.8%) 117 (20.6%) 10.9%–17.5% 1,360 (27.6%) 1,007 (27.9%) 353 (26.6%) 310 (27.3%) 152 (26.8%) 158 (27.8%) 6.3%–10.8% 1,305 (26.5%) 934 (25.9%) 371 (28.0%) 338 (29.8%) 162 (28.5%) 176 (31.0%) <6.3% 922 (18.7%) 641 (17.8%) 281 (21.2%) 219 (19.3%) 102 (18.0%) 117 (20.6%) Urban/rural 0.373 0.885 Metro 4,554 (87.1%) 3,338 (87.5%) 1,216 (86.1%) 974 (85.7%) 489 (86.1%) 485 (85.4%) Urban 600 (11.5%) 424 (11.1%) 176 (12.5%) 142 (12.5%) 70 (12.3%) 72 (12.7%) Rural 73 (1.40%) 52 (1.36%) 21 (1.49%) 20 (1.76%) 9 (1.58%) 11 (1.94%) * Available in only 24% of patients.
Data are number followed by percentage in parentheses, except for MELD and tumor size (median followed by interquartile range) and age (mean ± SD).
Characteristic Univariate Multivariate HR P HR P Age (10-y change) 1.194 (1.122–1.272) <0.001 1.174 (1.091–1.267) <0.001 Sex, male (reference) (reference) (reference) Sex, female 0.969 (0.831–1.129) 0.691 0.957 (0.802–1.122) 0.607 Race, white (reference) (reference) (reference) Race, Hispanic 0.615 (0.496–0.768) <0.001 0.685 (0.536–0.883) 0.003 Black 0.688 (0.576–0.817) <0.001 0.829 (0.675–1.013) 0.070 Race, Asian + others 0.796 (0.664–1.013) 0.034 0.735 (0.604–0.973) 0.012 Uninsured (reference) (reference) (reference) Private insurance 2.362 (1.648–3.318) <0.001 2.038 (1.376–2.950) <0.001 Medicaid/Medicare insurance 2.470 (1.736–3.452) <0.001 1.889 (1.276–2.716) <0.001 Other insurance 5.004 (2.913–8.547) <0.001 3.225 (1.730–5.869) <0.001 Median income, <$40,227 (reference) (reference) (reference) Median income, $40,227–$50,353 1.039 (0.850–1.221) 0.680 0.943 (0.742–1.144) 0.599 Median income, $50,354–$63,332 1.252 (1.061–1.511) 0.013 1.095 (0.889–1.394) 0.430 Median income, $63,333+ 1.202 (1.025–1.429) 0.030 0.980 (0.761–1.258) 0.872 Without high school diploma, ≥17.6% (reference) (reference) (reference) Without high school diploma, 10.9%–17.5% 1.100 (0.949–1.323) 0.262 0.976 (0.808–1.203) 0.811 Without high school diploma, 6.3%–10.8% 1.246 (1.057–1.471) 0.009 1.024 (0.815–1.264) 0.829 Without high school diploma, <6.3% 1.377 (1.151–1.652) <0.001 1.181 (0.896–1.511) 0.212 Metro (reference) (reference) (reference) Urban 1.125 (0.941–1.363) 0.212 1.161 (0.939–1.444) 0.174 Rural 1.085 (0.626–1.740) 0.753 1.134 (0.608–1.901) 0.663 Facility, academic (reference) (reference) (reference) Facility, community cancer program 0.346 (0.231–0.534) <0.001 0.424 (0.274–0.676) <0.001 Facility, comprehensive community cancer program 0.762 (0.656–0.892) <0.001 0.729 (0.612–0.864) <0.001 Facility, integrated network 1.003 (0.826–1.196) 0.973 1.034 (0.845–1.274) 0.747 Region, Northeast (reference) (reference) (reference) Region, Midwest 1.651 (1.390–2.017) <0.001 1.640 (1.364–2.076) <0.001 Region, South 1.110 (0.951–1.333) 0.225 1.268 (1.068–1.562) 0.014 Region, West 1.556 (1.287–1.906) <0.001 1.740 (1.418–2.198) <0.001 Charlson index, 0 or 1 (reference) (reference) (reference) Charlson index, 2 1.087 (0.870–1.352) 0.457 1.117 (0.873–1.416) 0.371 Charlson index, 3 0.787 (0.662–0.934) 0.006 0.821 (0.676–0.984) 0.039 AFP, normal (reference) (reference) (reference) AFP, elevated 0.992 (0.841–1.182) 0.928 1.123 (0.947–1.373) 0.223 MELD (10-unit change) 0.736 (0.660–0.785) <0.001 0.756 (0.663–0.801) <0.001 Tumor size 0.993 (0.983–1.002) 0.136 0.992 (0.982–1.001) 0.101 Data in parentheses are 95% CIs.
Characteristic Univariate Multivariate HR P HR P Age (10-y change) 1.022 (0.990–1.056) 0.184 1.035 (0.998–1.072) 0.063 Sex, male (reference) (reference) (reference) Sex, female 0.925 (0.852–1.003) 0.060 0.912 (0.840–0.990) 0.029 Race, white (reference) (reference) (reference) Race, Hispanic 0.830 (0.741–0.930) 0.001 0.850 (0.754–0.959) 0.008 Race, black 0.947 (0.865–1.036) 0.232 0.933 (0.846–1.029) 0.164 Race, Asian + others 0.887 (0.791–0.994) 0.040 0.894 (0.793–1.008) 0.066 Uninsured (reference) (reference) (reference) Private insurance 0.909 (0.787–1.051) 0.198 0.920 (0.793–1.067) 0.269 Medicaid/Medicare insurance 0.970 (0.843–1.116) 0.672 0.956 (0.827–1.106) 0.547 Other insurance 0.877 (0.659–1.167) 0.368 0.912 (0.685–1.215) 0.530 Median income, <$40,227 (reference) (reference) (reference) Median income, $40,227–$50,353 1.024 (0.927–1.131) 0.638 0.978 (0.878–1.089) 0.682 Median income, $50,354–$63,332 0.923 (0.836–1.018) 0.107 0.884 (0.790–0.989) 0.032 Median income, $63,333+ 0.991 (0.907–1.083) 0.841 0.949 (0.839–1.073) 0.404 Without high school degree, ≥17.6% (reference) (reference) (reference) Without high school degree, 10.9%–17.5% 1.086 (0.993–1.189) 0.072 1.082 (0.981–1.193) 0.114 Without high school degree, 6.3%–10.8% 1.098 (1.005–1.199) 0.038 1.117 (1.003–1.244) 0.044 Without high school degree, <6.3% 1.088 (0.985–1.202) 0.097 1.131 (0.988–1.294) 0.073 Metro (reference) (reference) (reference) Urban 1.134 (1.025–1.255) 0.014 1.106 (0.992–1.233) 0.070 Rural 1.276 (0.982–1.657) 0.068 1.171 (0.892–1.537) 0.255 Facility, academic (reference) (reference) (reference) Facility, community cancer program 1.552 (1.311–1.838) <0.001 1.376 (1.159–1.634) <0.001 Facility, comprehensive community cancer program 1.247 (1.149–1.352) <0.001 1.234 (1.135–1.342) <0.001 Facility, integrated network 1.164 (1.055–1.285) 0.003 1.153 (1.043–1.275) 0.005 Region, Northeast (reference) (reference) (reference) Region, Midwest 1.179 (1.069–1.301) <0.001 1.167 (1.055–1.292) 0.003 Region, South 1.013 (0.929–1.105) 0.763 0.963 (0.879–1.054) 0.414 Region, West 1.000 (0.900–1.111) 0.996 0.987 (0.883–1.102) 0.813 Charlson index 0 or 1 (reference) (reference) (reference) Charlson index 2 0.994 (0.878–1.126) 0.928 0.979 (0.863–1.109) 0.735 Charlson index 3 1.082 (0.989–1.184) 0.087 1.073 (0.979–1.177) 0.131 AFP, normal (reference) (reference) (reference) AFP, elevated 1.330 (1.202–1.473) <0.001 1.356 (1.220–1.506) <0.001 MELD score (10-unit change) 1.134 (1.084–1.186) <0.001 1.113 (1.061–1.167) <0.001 Treatment, systemic (reference) (reference) (reference) Treatment, TARE 0.745 (0.691–0.803) <0.001 0.739 (0.684–0.798) <0.001 Data in parentheses are 95% CIs.
Supplemental Data
Files in this Data Supplement:
In this issue


Jump to section
Related Articles
Cited By...
- No citing articles found.