


Article Figures & Data
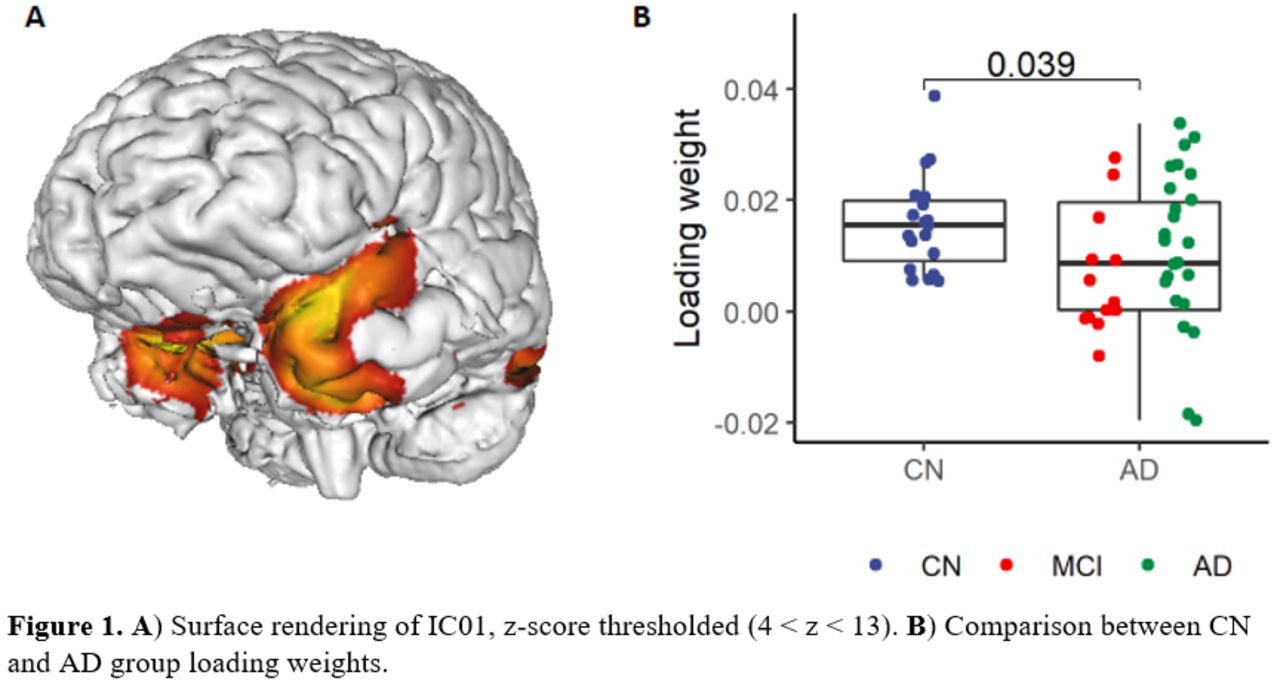
Figures


Tables
Participant characteristics and cognitive test scores
CN AD p-value Participants (n) 19 38 Sex (F/M) 10/9 20/18 Age (years) 71.5 (7.6) [61-83] 70.5 (7.7) [50-85] 0.66 Education (years) 17.7 (2.1) [12-20] 16.3 (2.3) [12-20] 0.03 CDR-global 0 (0) 0.7 (0.3) [0.5-1.0] < 0.00001 CDR-sob 0 (0) 4.2 (2.0) [0.5-9.0] < 0.00001 MMSE 29.2 (1.1) [27-30] 23.2 (3.7) [14-30] < 0.00001 LMII 13.6 (4.4) [5-19] 1.5 (2.4) [0-8] < 0.00001 RAVLT-delay 11.1 (2.8) [5-15] 1.0 (1.9) [0-7] < 0.00001
In this issue


Jump to section
Related Articles
Cited By...
- No citing articles found.